| Param | Original file | Final file |
|---|---|---|
| Filename | modeM0/AS1C07_001T12_9000005352_37872cztM0_level2.evt | modeM0/AS1C07_001T12_9000005352_37872cztM0_level2_quad_clean.evt |
| Size (bytes) | 430,171,200 | 81,460,800 |
| Size | 410.2 MB | 77.7 MB |
| Events in quadrant A | 2,835,195 | 534,107 |
| Events in quadrant B | 3,126,956 | 526,588 |
| Events in quadrant C | 2,836,050 | 518,591 |
| Events in quadrant D | 3,850,341 | 497,065 |
| Mode M9 | |||
|---|---|---|---|
| Quadrant | BADHDUFLAG | Total packets | Discarded packets |
| A | 0 | 20 | 0 |
| B | 0 | 20 | 0 |
| C | 0 | 20 | 0 |
| D | 0 | 21 | 0 |
| Mode M0 | |||
|---|---|---|---|
| Quadrant | BADHDUFLAG | Total packets | Discarded packets |
| A | 0 | 11934 | 3 |
| B | 0 | 13031 | 2 |
| C | 0 | 11899 | 2 |
| D | 0 | 15291 | 2 |
| Mode SS | |||
|---|---|---|---|
| Quadrant | BADHDUFLAG | Total packets | Discarded packets |
| A | 0 | 116 | 0 |
| B | 0 | 116 | 0 |
| C | 0 | 116 | 0 |
| D | 0 | 116 | 0 |
| Quadrant | Total seconds | Saturated seconds | Saturation percentage |
|---|---|---|---|
| A | 5571 | 13 | 0.233351% |
| B | 5571 | 170 | 3.051517% |
| C | 5571 | 47 | 0.843655% |
| D | 5571 | 210 | 3.769521% |
Noise dominated data is calculated using 1-second bins in cleaned event files. If a bin has >2000 counts, and if more than 50% of those come from <1% of pixels, then it is considered to be noise-dominated and hence unusable.
| Quadrant | # 1 sec bins | Bins with >0 counts | Bins with >2000 counts | High rate bins dominated by noise | Noise dominated (total time) | Noise dominated (detector-on time) | Marked lightcurve |
|---|---|---|---|---|---|---|---|
| A | 7123 | 5572 | 6 | 6 | 0.08% | 0.11% | 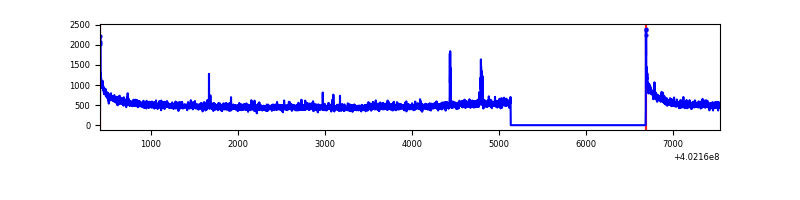 |
| B | 7123 | 5572 | 127 | 127 | 1.78% | 2.28% | 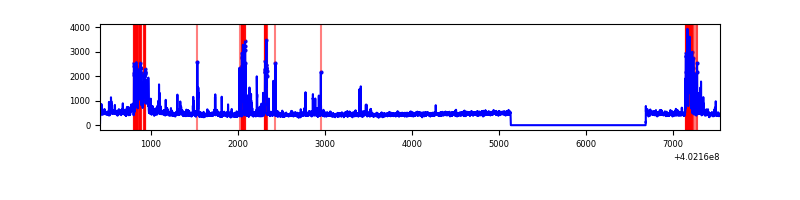 |
| C | 7123 | 5572 | 44 | 44 | 0.62% | 0.79% | 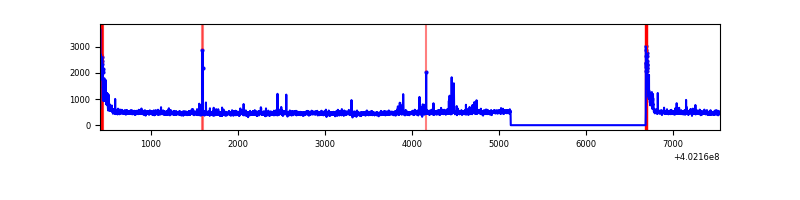 |
| D | 7123 | 5572 | 160 | 160 | 2.25% | 2.87% | 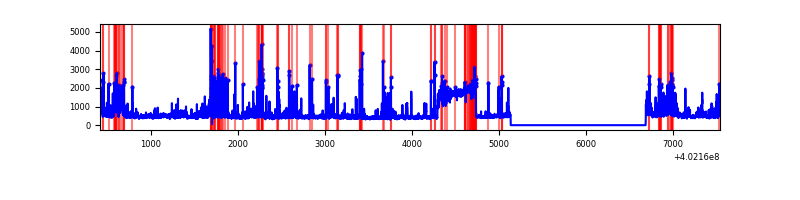 |
Top three noisy pixels from each quadrant. If the there are fewer than three noisy pixels in the level2.evt file, extra rows are filled as -1
| Pixel properties | Quadrant properties | ||||||
|---|---|---|---|---|---|---|---|
| Quadrant | DetID | PixID | Counts | Sigma | Mean | Median | Sigma |
| A | 10 | 83 | 370138 | 2964.62 | 615 | 604 | 124.6 |
| A | 13 | 248 | 28814 | 226.32 | 615 | 604 | 124.6 |
| A | 13 | 6 | 20793 | 161.97 | 615 | 604 | 124.6 |
| B | 5 | 172 | 392114 | 3419.29 | 603 | 588 | 114.5 |
| B | 4 | 232 | 181558 | 1580.45 | 603 | 588 | 114.5 |
| B | 0 | 229 | 66652 | 576.95 | 603 | 588 | 114.5 |
| C | 15 | 214 | 234327 | 1690.89 | 596 | 601 | 138.2 |
| C | 0 | 10 | 191254 | 1379.28 | 596 | 601 | 138.2 |
| C | 14 | 254 | 55545 | 397.49 | 596 | 601 | 138.2 |
| D | 7 | 38 | 580718 | 3959.52 | 594 | 576 | 146.5 |
| D | 1 | 52 | 372976 | 2541.66 | 594 | 576 | 146.5 |
| D | 2 | 250 | 152170 | 1034.64 | 594 | 576 | 146.5 |
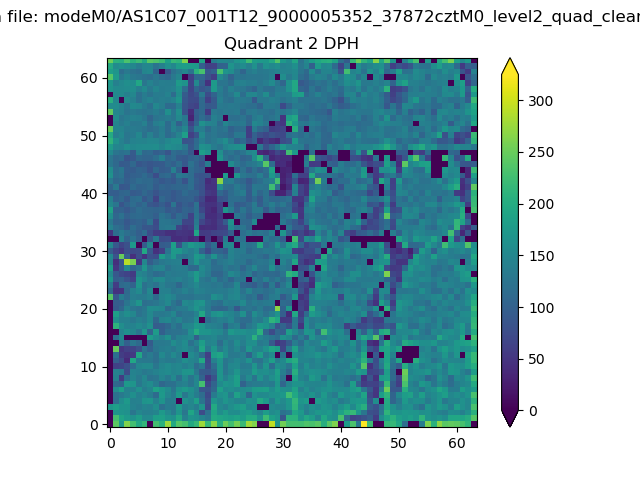
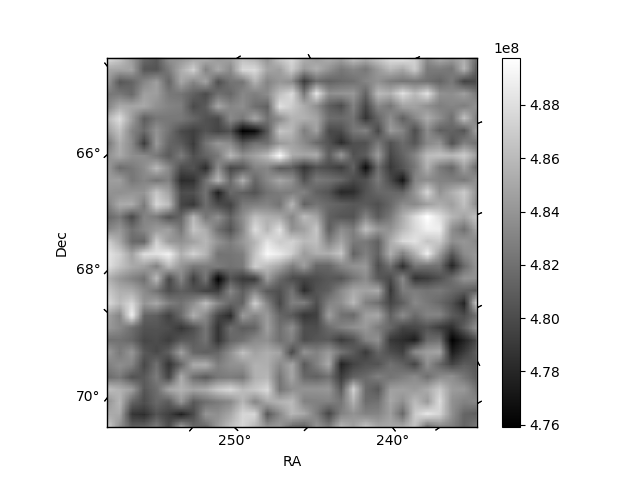
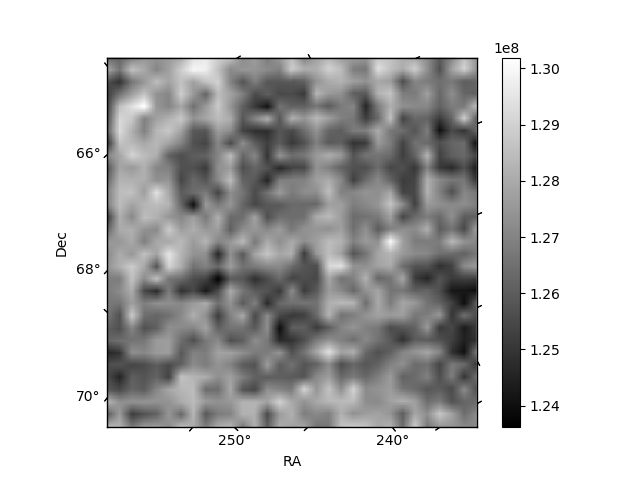
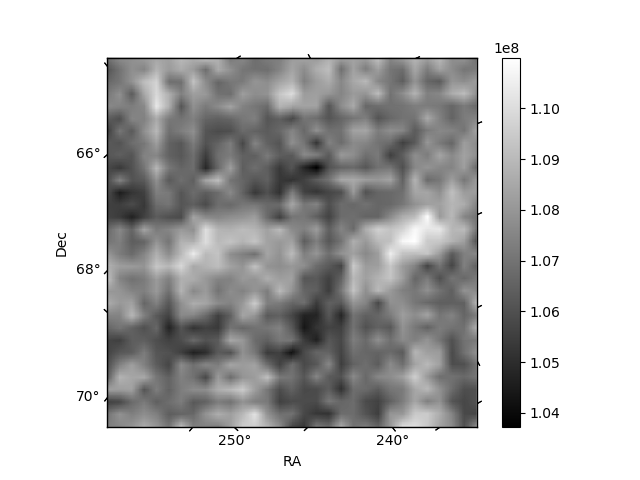
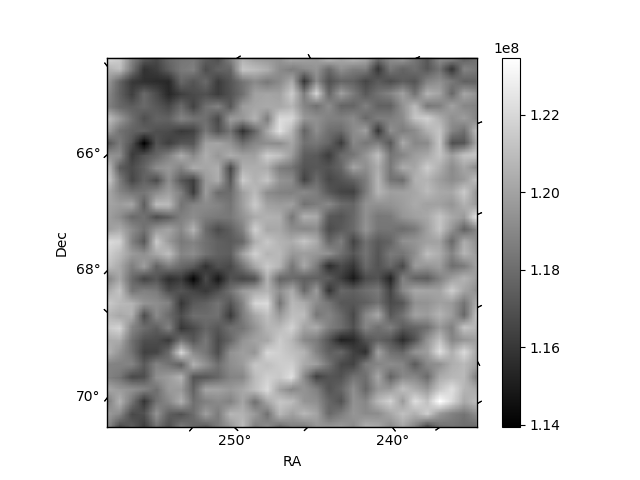
Histogram calculated using DETX and DETY for each event in the final _common_clean file
| Quadrant A | 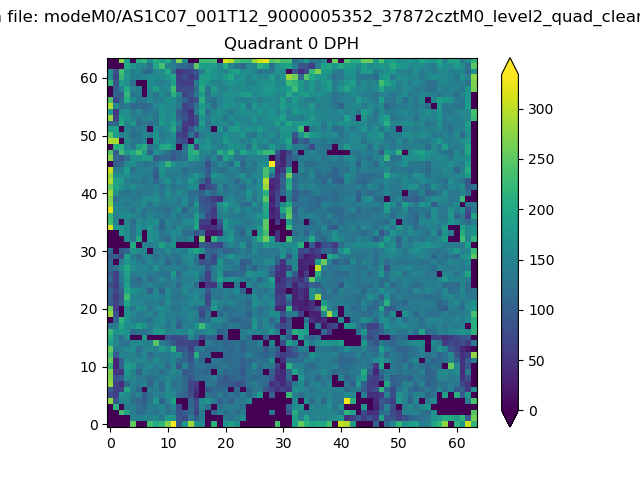 |
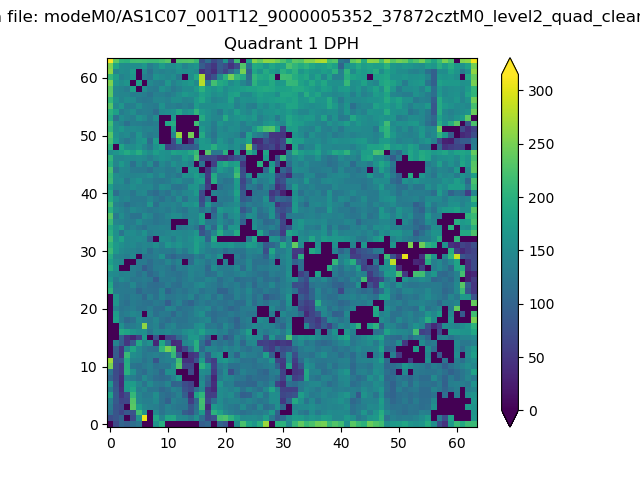 |
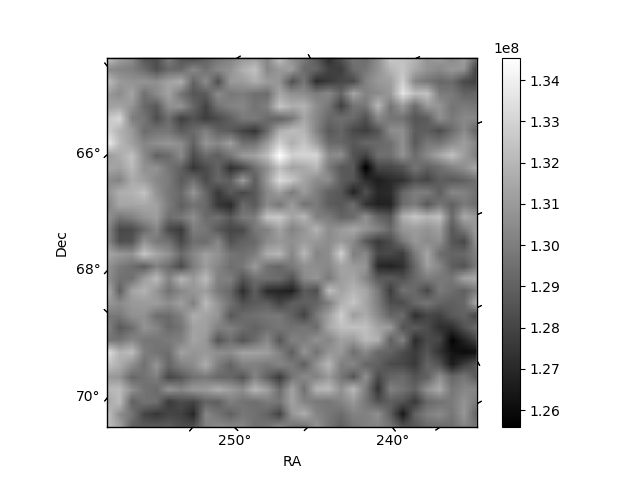
Quadrant B |
|---|---|---|---|
| Quadrant D | 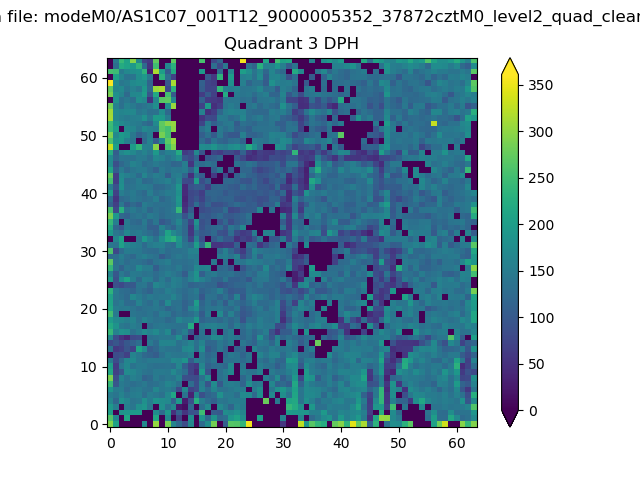 |
 |
Quadrant C |
| Plot type | Count rate plots | Images |
|---|---|---|
| Comparison with Poisson distribution Blue bars denote a histogram of data divided into 1 sec bins. Red curve is a Poisson curve with rate = median count rate of data. |
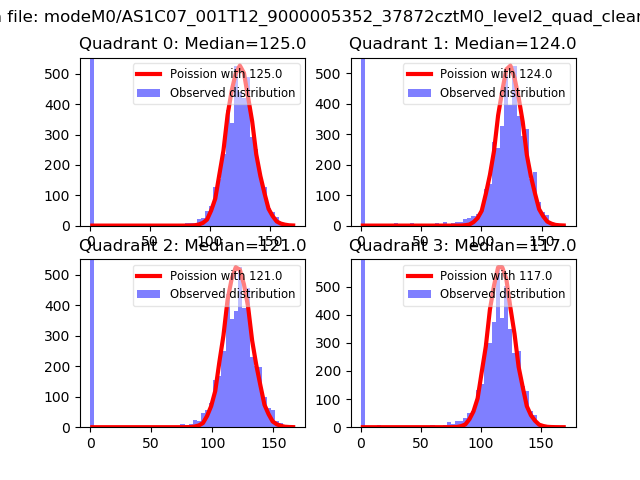 |
 |
| Quadrant-wise count rates Data is divided into 100 sec bins |
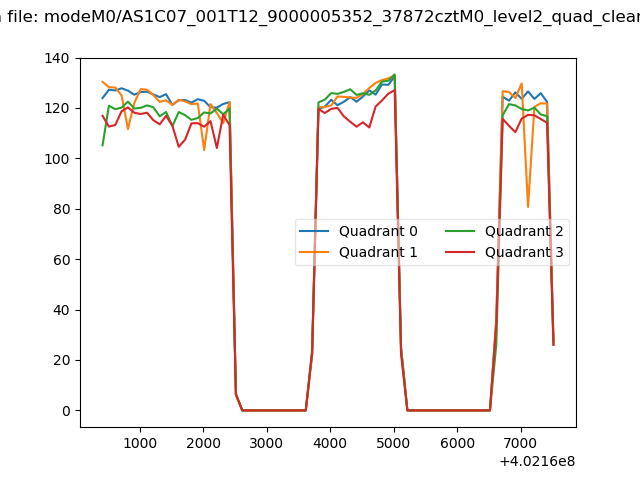 |
|
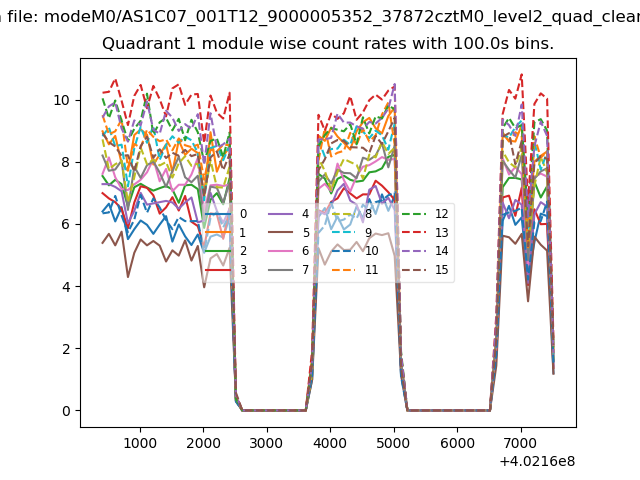
| Module-wise count rates for Quadrant A Data is divided into 100 sec bins |
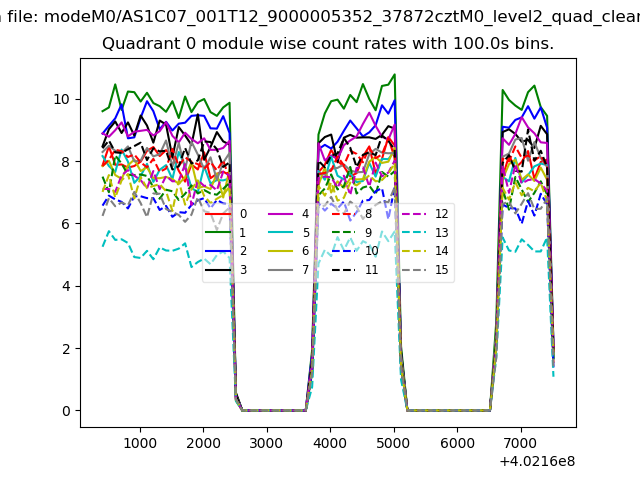 |
 |
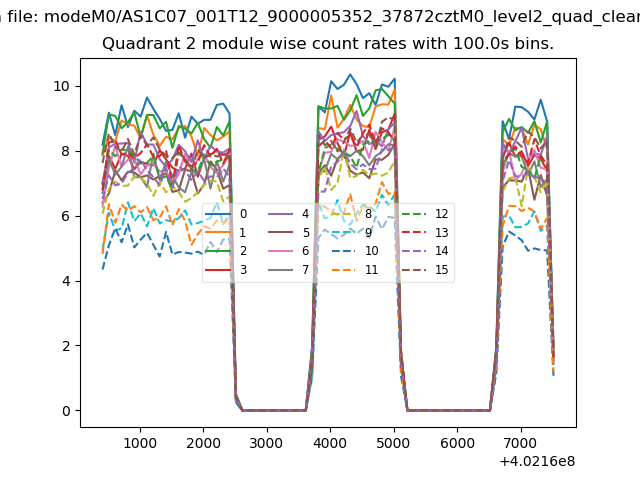
| Module-wise count rates for Quadrant B Data is divided into 100 sec bins |
 |
 |
| Module-wise count rates for Quadrant C Data is divided into 100 sec bins |
 |
 |
| Module-wise count rates for Quadrant D Data is divided into 100 sec bins |
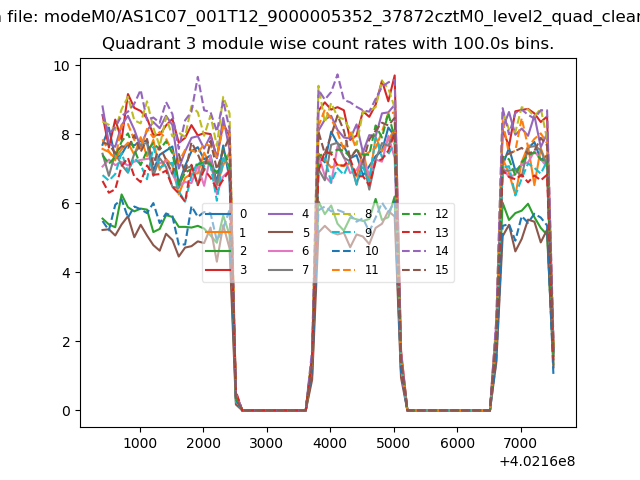 |
 |
| Parameter | Plot |
|---|---|
| CZT HV Monitor | 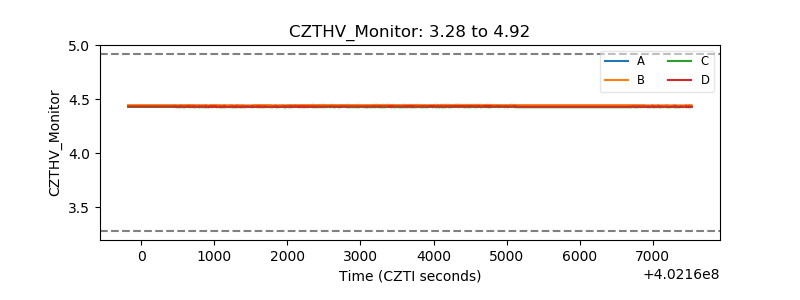 |
| D_VDD | 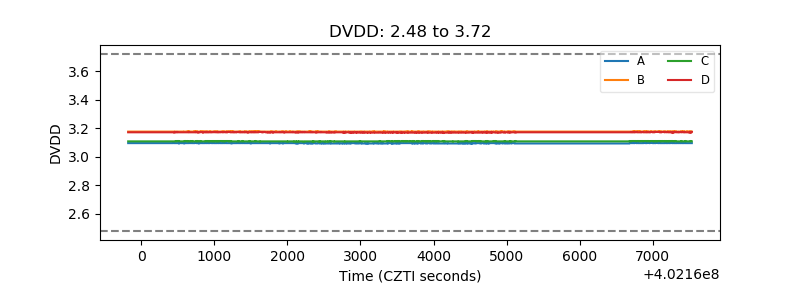 |
| Temperature 1 | 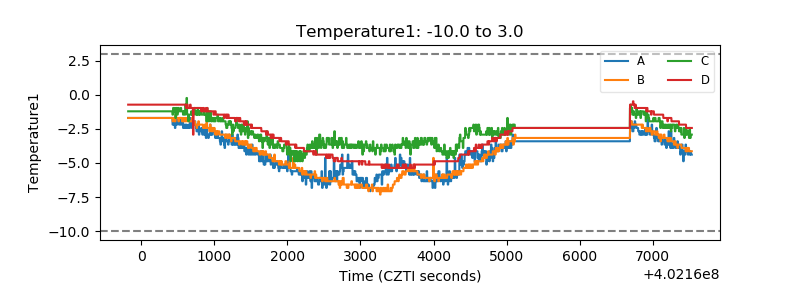 |
| Veto HV Monitor | 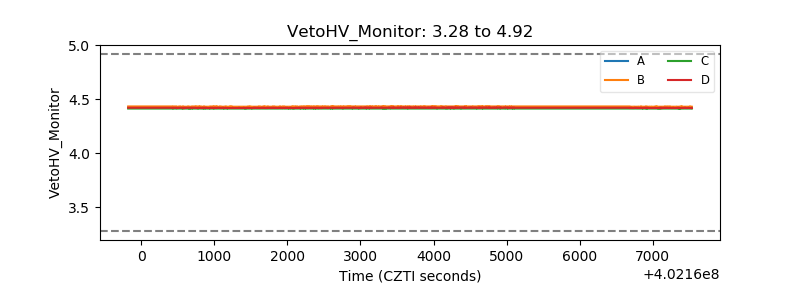 |
| Veto LLD | 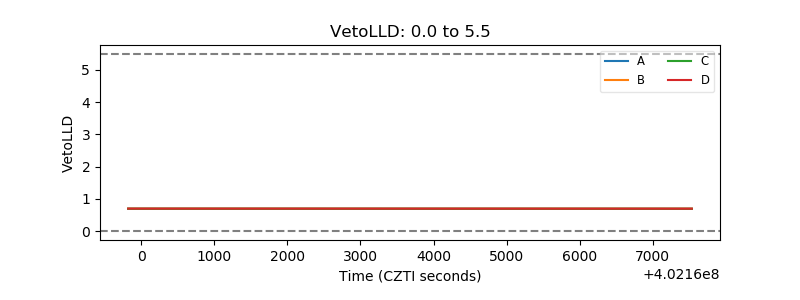 |
| Alpha Counter | 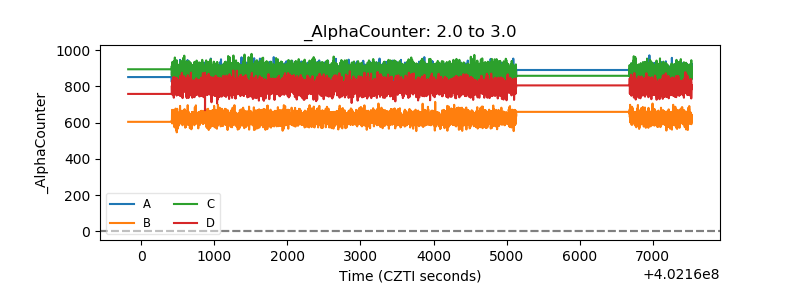 |
| _CPM_Rate | 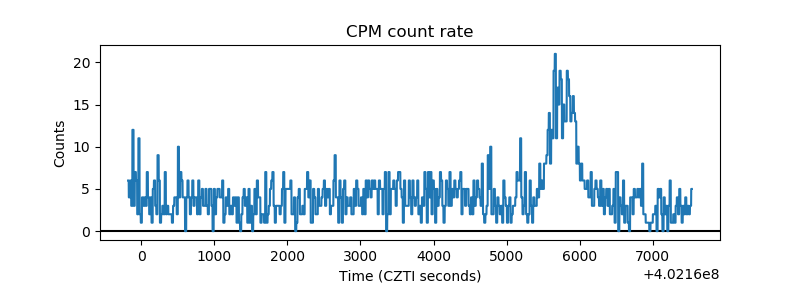 |
| CZT Counter | 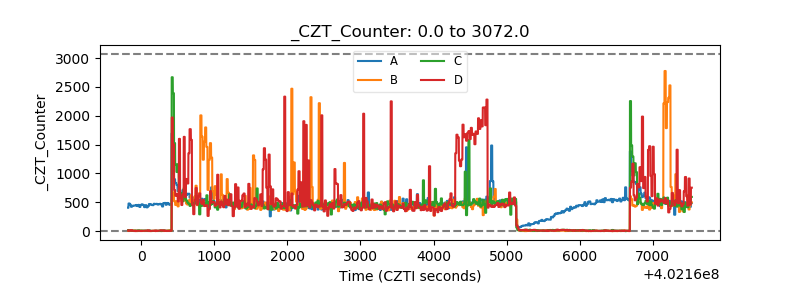 |
| +2.5 Volts monitor |  |
| +5 Volts monitor | 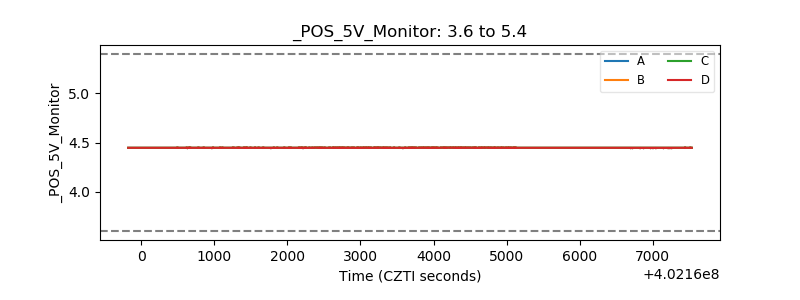 |
| _ROLL_ROT | 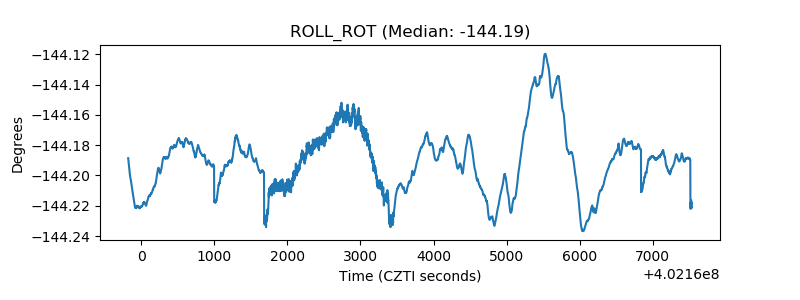 |
| _Roll_DEC | 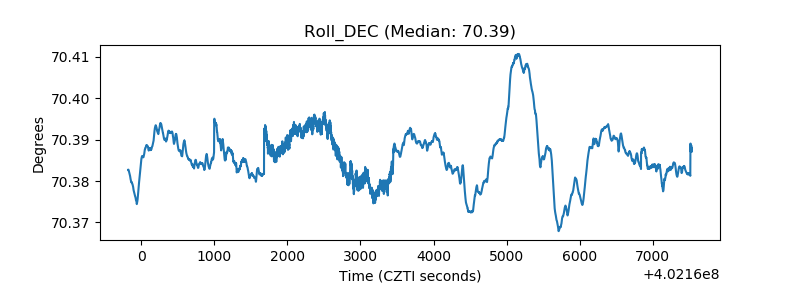 |
| _Roll_RA | 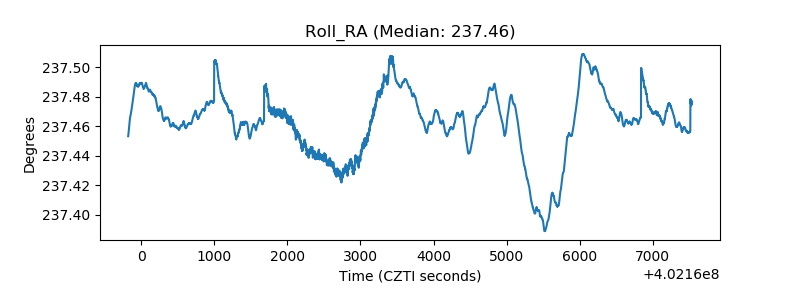 |
| Veto Counter | 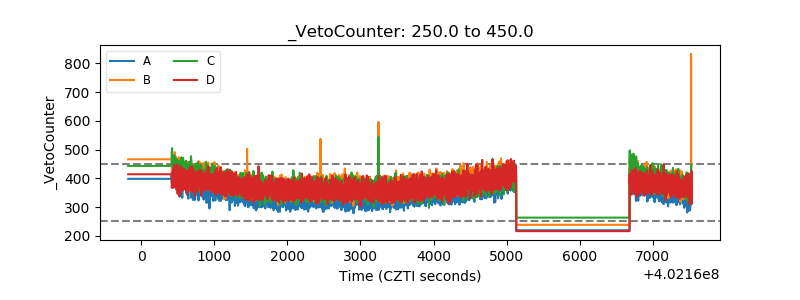 |