| Param | Original file | Final file |
|---|---|---|
| Filename | modeM0/AS1C07_001T12_9000005352_37873cztM0_level2.evt | modeM0/AS1C07_001T12_9000005352_37873cztM0_level2_quad_clean.evt |
| Size (bytes) | 424,889,280 | 83,796,480 |
| Size | 405.2 MB | 79.9 MB |
| Events in quadrant A | 2,916,274 | 546,862 |
| Events in quadrant B | 3,220,232 | 541,851 |
| Events in quadrant C | 2,924,073 | 533,989 |
| Events in quadrant D | 3,418,605 | 515,175 |
| Mode M9 | |||
|---|---|---|---|
| Quadrant | BADHDUFLAG | Total packets | Discarded packets |
| A | 0 | 23 | 0 |
| B | 0 | 23 | 0 |
| C | 0 | 23 | 0 |
| D | 0 | 24 | 0 |
| Mode M0 | |||
|---|---|---|---|
| Quadrant | BADHDUFLAG | Total packets | Discarded packets |
| A | 0 | 12266 | 3 |
| B | 0 | 13358 | 2 |
| C | 0 | 12231 | 2 |
| D | 0 | 14113 | 2 |
| Mode SS | |||
|---|---|---|---|
| Quadrant | BADHDUFLAG | Total packets | Discarded packets |
| A | 0 | 116 | 0 |
| B | 0 | 116 | 0 |
| C | 0 | 116 | 0 |
| D | 0 | 116 | 0 |
| Quadrant | Total seconds | Saturated seconds | Saturation percentage |
|---|---|---|---|
| A | 5716 | 27 | 0.472358% |
| B | 5716 | 149 | 2.606718% |
| C | 5716 | 39 | 0.682295% |
| D | 5716 | 125 | 2.186844% |
Noise dominated data is calculated using 1-second bins in cleaned event files. If a bin has >2000 counts, and if more than 50% of those come from <1% of pixels, then it is considered to be noise-dominated and hence unusable.
| Quadrant | # 1 sec bins | Bins with >0 counts | Bins with >2000 counts | High rate bins dominated by noise | Noise dominated (total time) | Noise dominated (detector-on time) | Marked lightcurve |
|---|---|---|---|---|---|---|---|
| A | 7057 | 5717 | 20 | 20 | 0.28% | 0.35% | 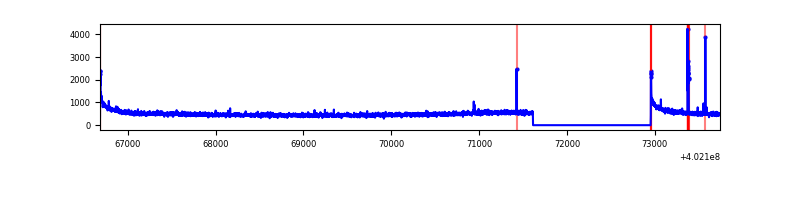 |
| B | 7057 | 5717 | 114 | 114 | 1.62% | 1.99% | 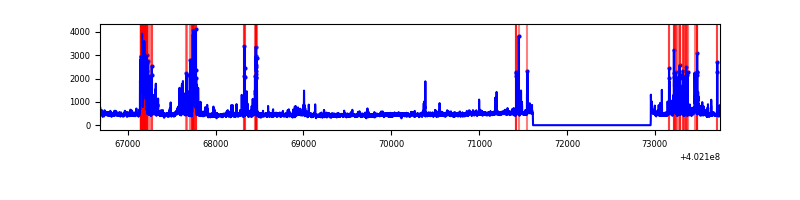 |
| C | 7057 | 5717 | 36 | 36 | 0.51% | 0.63% | 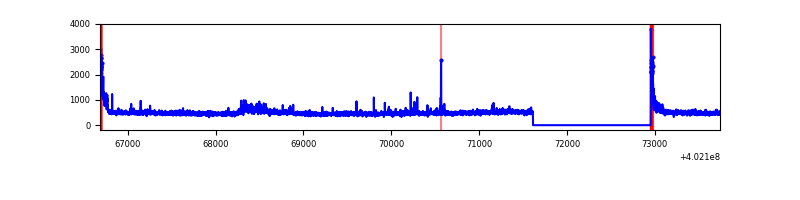 |
| D | 7057 | 5717 | 103 | 103 | 1.46% | 1.80% | 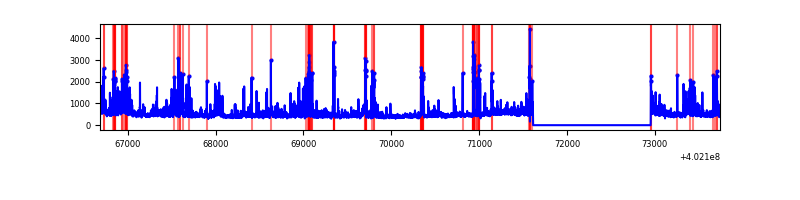 |
Top three noisy pixels from each quadrant. If the there are fewer than three noisy pixels in the level2.evt file, extra rows are filled as -1
| Pixel properties | Quadrant properties | ||||||
|---|---|---|---|---|---|---|---|
| Quadrant | DetID | PixID | Counts | Sigma | Mean | Median | Sigma |
| A | 10 | 83 | 373372 | 2940.96 | 630 | 616 | 126.7 |
| A | 15 | 222 | 29933 | 231.3 | 630 | 616 | 126.7 |
| A | 9 | 143 | 29566 | 228.41 | 630 | 616 | 126.7 |
| B | 4 | 232 | 270673 | 2263.0 | 621 | 604 | 119.3 |
| B | 5 | 172 | 254798 | 2129.98 | 621 | 604 | 119.3 |
| B | 0 | 183 | 68429 | 568.33 | 621 | 604 | 119.3 |
| C | 15 | 214 | 241346 | 1672.72 | 614 | 618 | 143.9 |
| C | 0 | 10 | 152391 | 1054.61 | 614 | 618 | 143.9 |
| C | 14 | 67 | 80625 | 555.93 | 614 | 618 | 143.9 |
| D | 2 | 250 | 258528 | 1714.02 | 613 | 596 | 150.5 |
| D | 1 | 52 | 174193 | 1153.59 | 613 | 596 | 150.5 |
| D | 7 | 223 | 101141 | 668.14 | 613 | 596 | 150.5 |
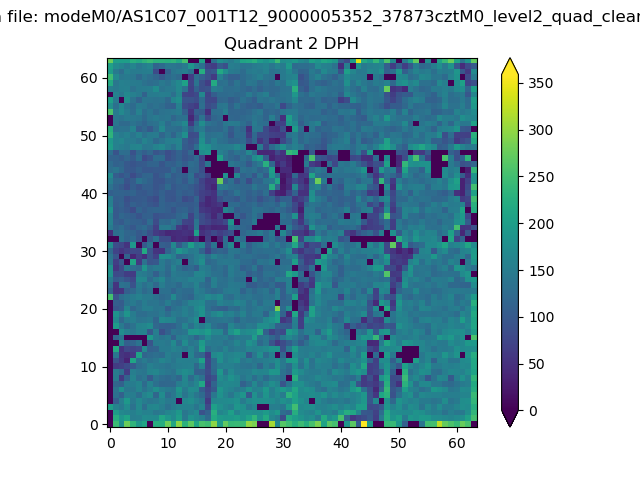
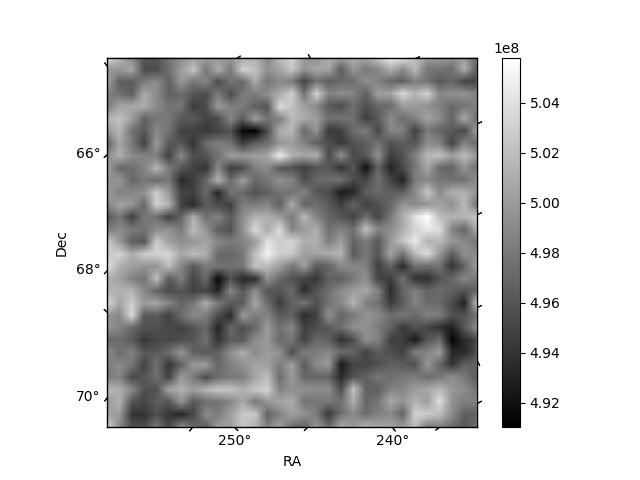
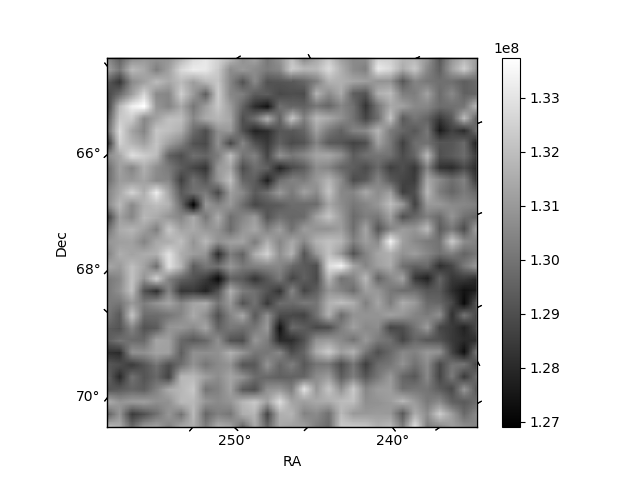
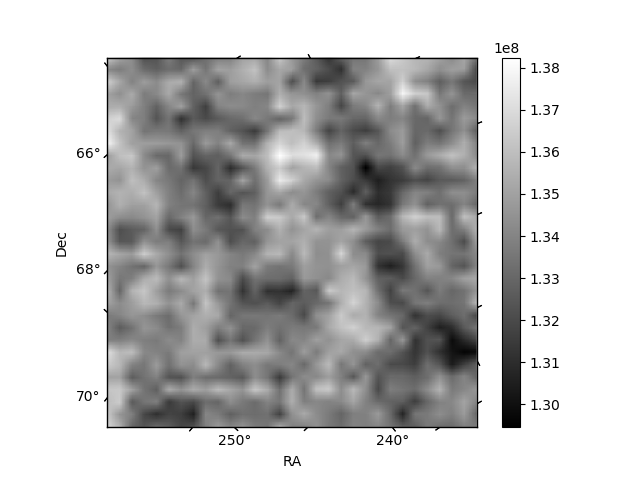
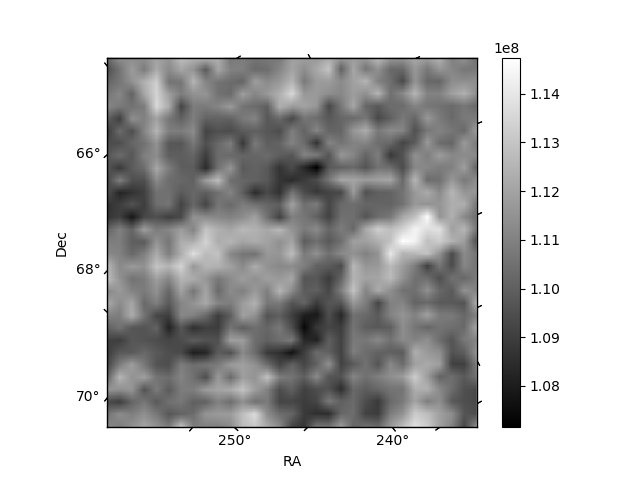
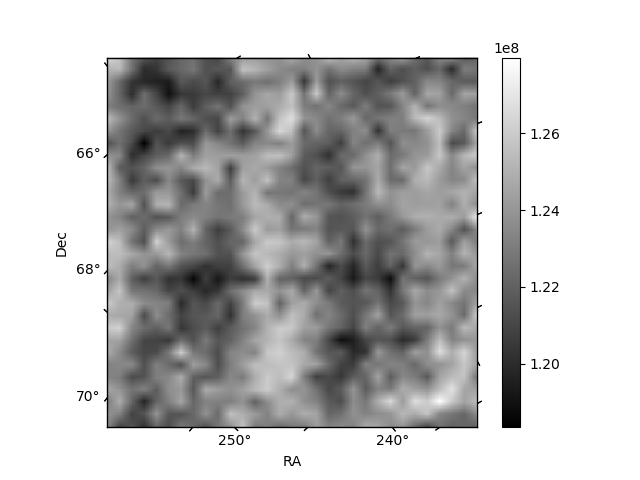
Histogram calculated using DETX and DETY for each event in the final _common_clean file
| Quadrant A | 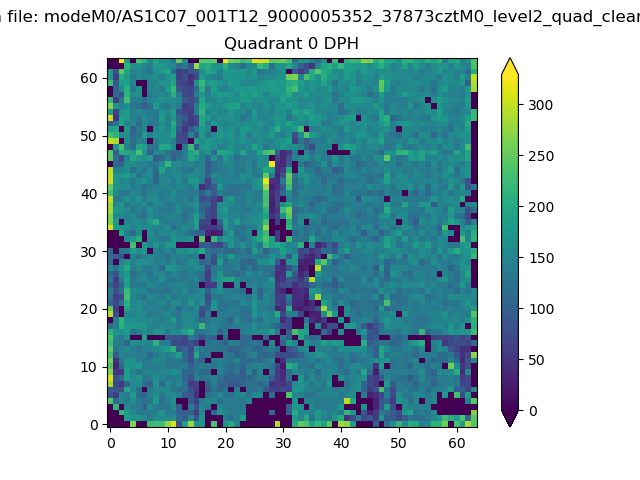 |
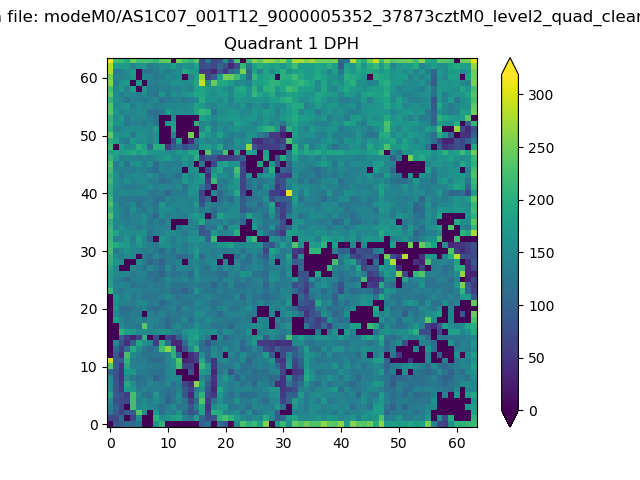 |
Quadrant B |
|---|---|---|---|
| Quadrant D | 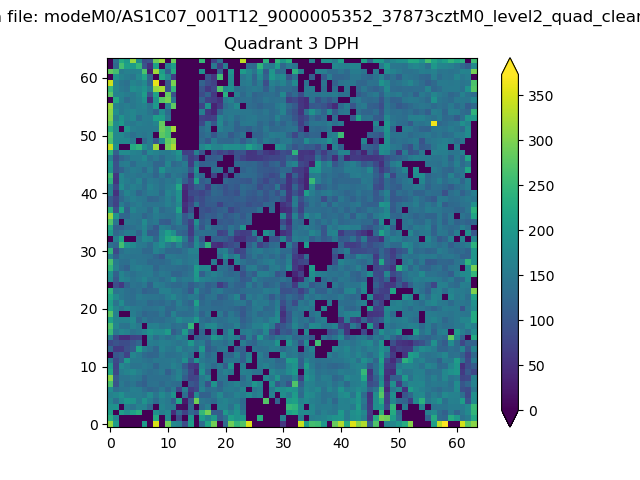 |
 |
Quadrant C |
| Plot type | Count rate plots | Images |
|---|---|---|
| Comparison with Poisson distribution Blue bars denote a histogram of data divided into 1 sec bins. Red curve is a Poisson curve with rate = median count rate of data. |
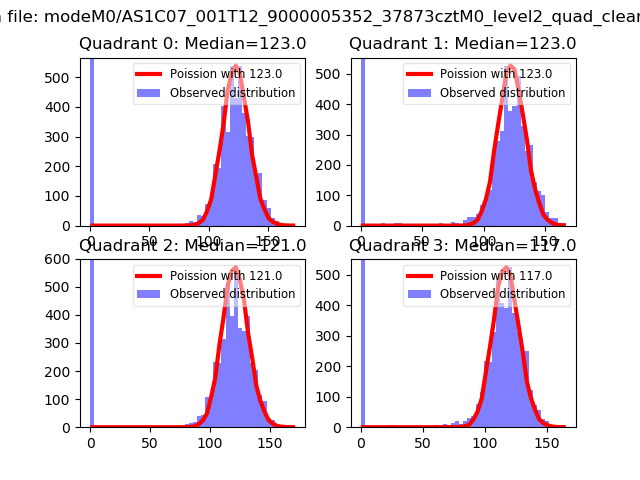 |
 |
| Quadrant-wise count rates Data is divided into 100 sec bins |
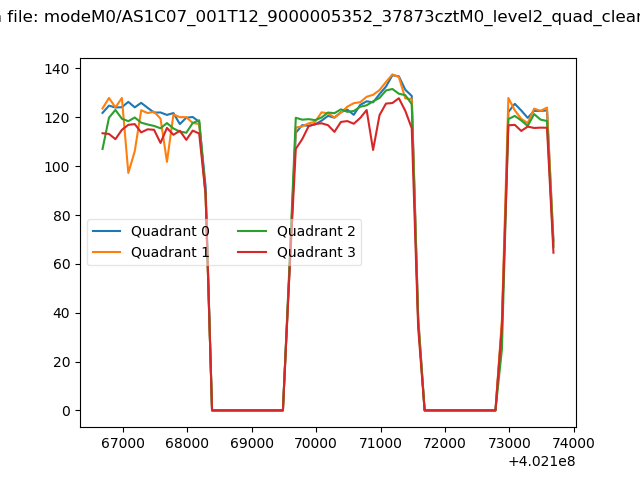 |
|
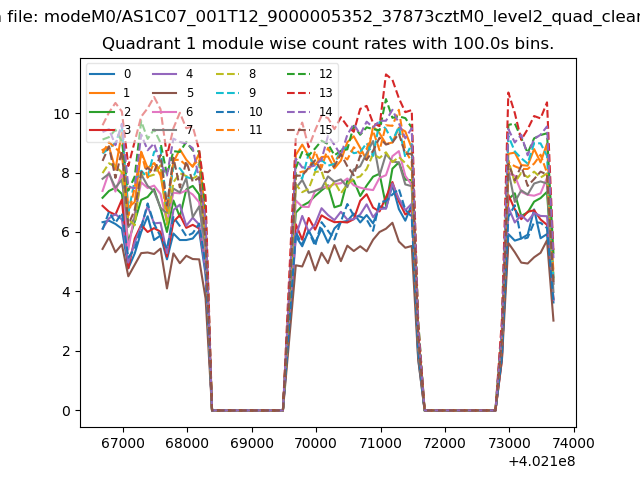
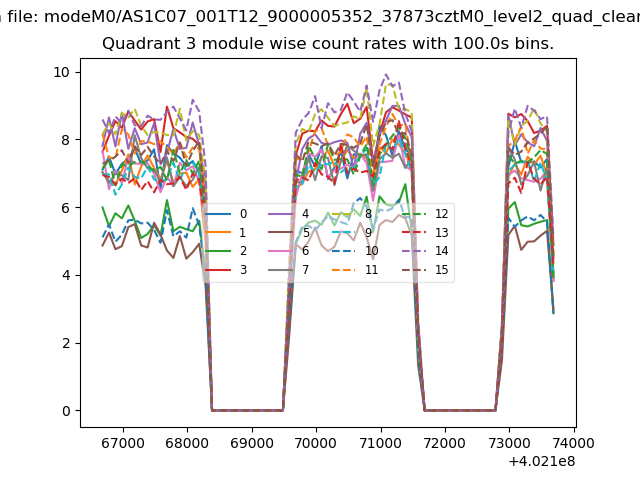
| Module-wise count rates for Quadrant A Data is divided into 100 sec bins |
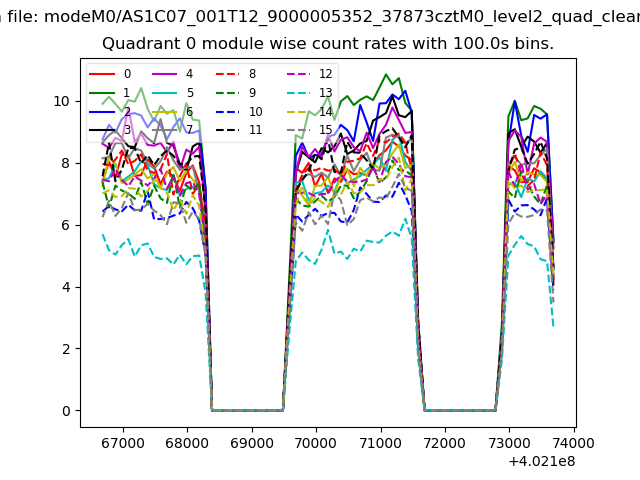 |
 |
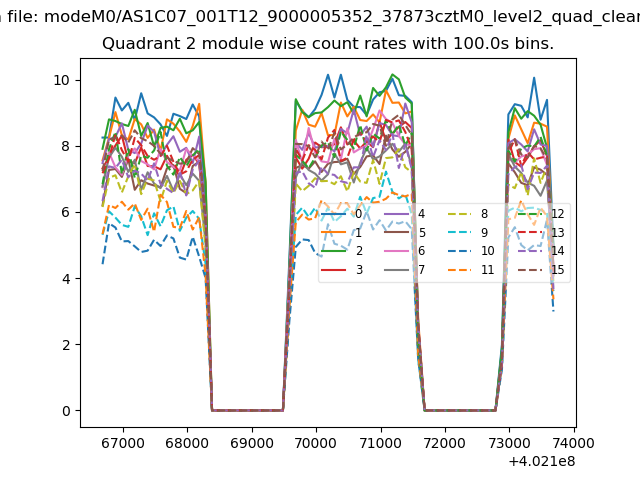
| Module-wise count rates for Quadrant B Data is divided into 100 sec bins |
 |
 |
| Module-wise count rates for Quadrant C Data is divided into 100 sec bins |
 |
 |
| Module-wise count rates for Quadrant D Data is divided into 100 sec bins |
 |
 |
| Parameter | Plot |
|---|---|
| CZT HV Monitor | 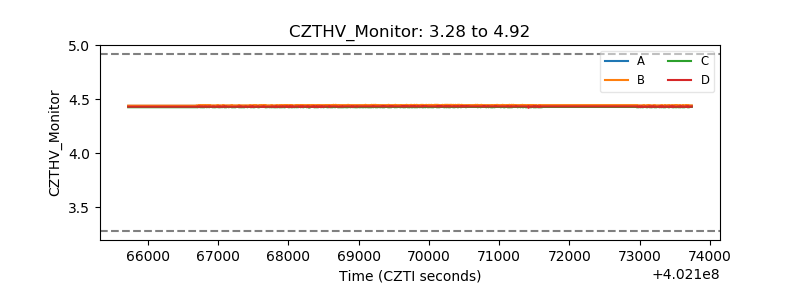 |
| D_VDD | 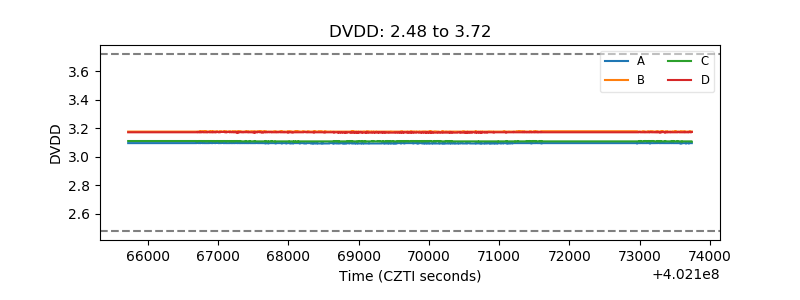 |
| Temperature 1 | 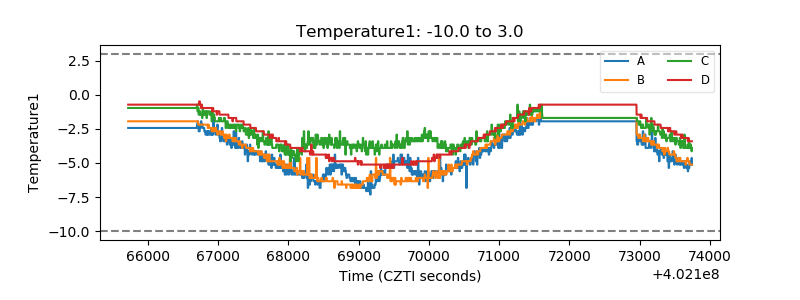 |
| Veto HV Monitor | 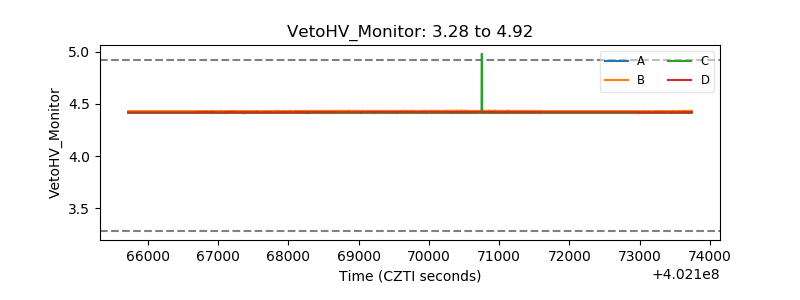 |
| Veto LLD | 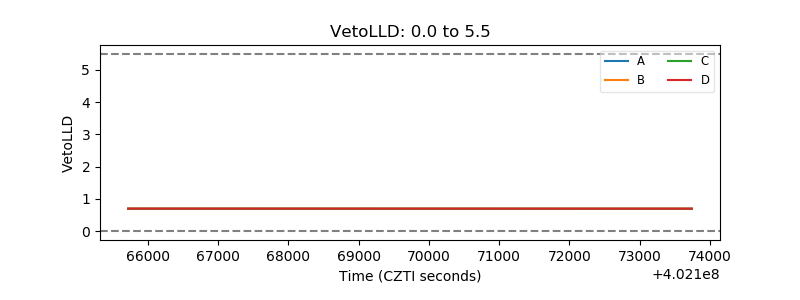 |
| Alpha Counter | 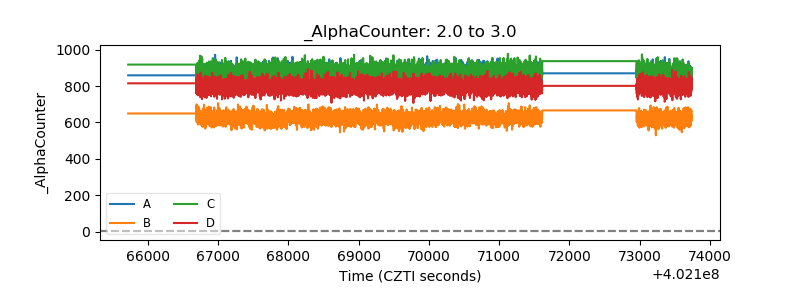 |
| _CPM_Rate | 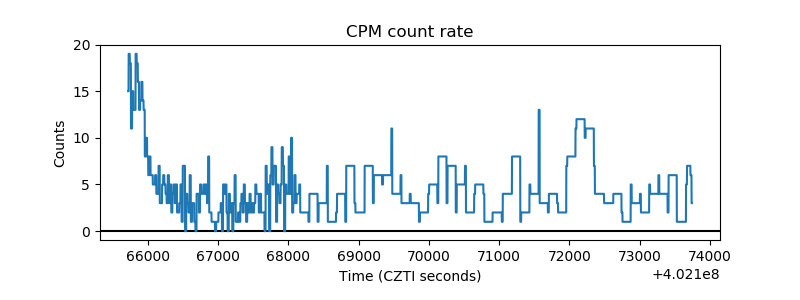 |
| CZT Counter | 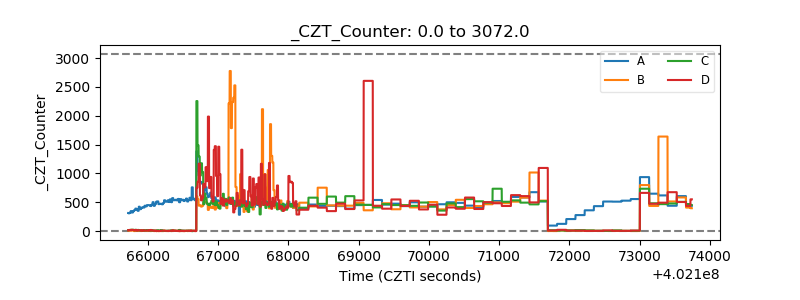 |
| +2.5 Volts monitor | 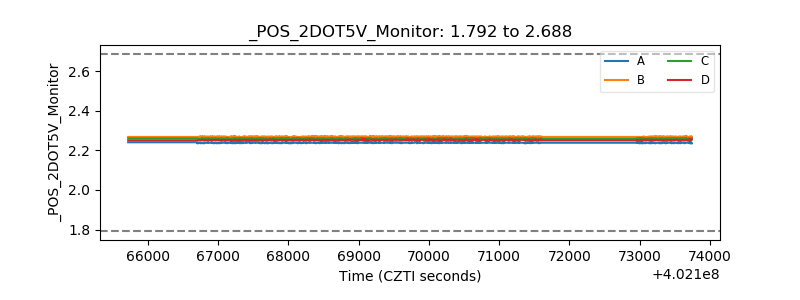 |
| +5 Volts monitor | 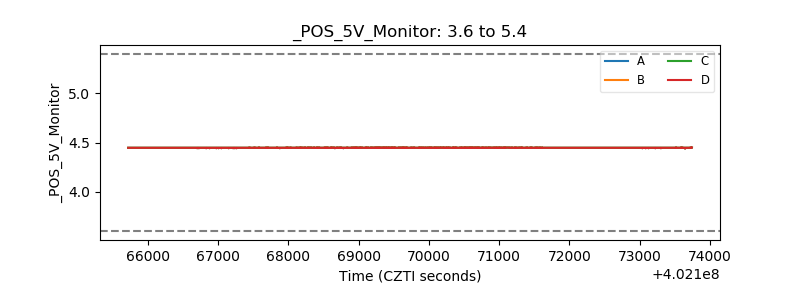 |
| _ROLL_ROT | 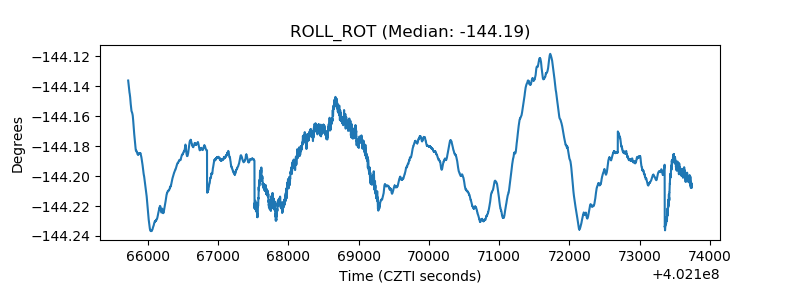 |
| _Roll_DEC | 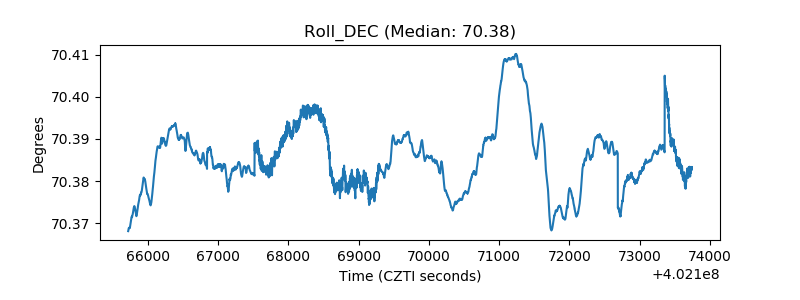 |
| _Roll_RA | 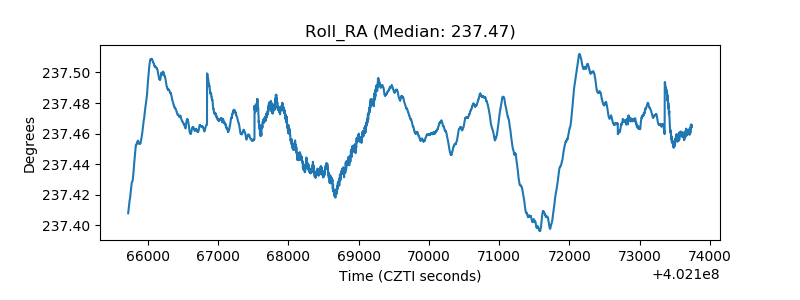 |
| Veto Counter | 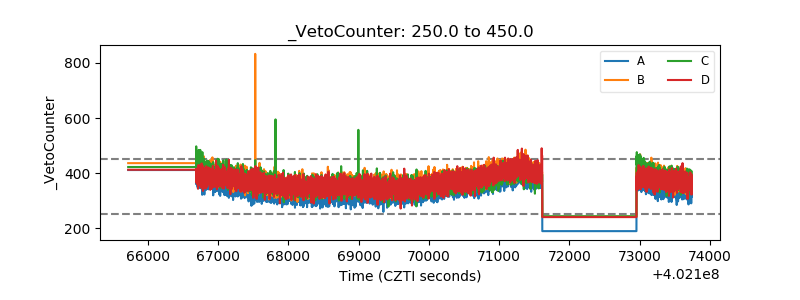 |