| Param | Original file | Final file |
|---|---|---|
| Filename | modeM0/AS1C07_001T12_9000005352_37874cztM0_level2.evt | modeM0/AS1C07_001T12_9000005352_37874cztM0_level2_quad_clean.evt |
| Size (bytes) | 449,812,800 | 84,971,520 |
| Size | 429.0 MB | 81.0 MB |
| Events in quadrant A | 3,097,297 | 550,368 |
| Events in quadrant B | 3,290,045 | 552,054 |
| Events in quadrant C | 2,957,078 | 541,249 |
| Events in quadrant D | 3,877,810 | 517,662 |
| Mode M9 | |||
|---|---|---|---|
| Quadrant | BADHDUFLAG | Total packets | Discarded packets |
| A | 0 | 26 | 0 |
| B | 0 | 26 | 0 |
| C | 0 | 26 | 0 |
| D | 0 | 27 | 0 |
| Mode M0 | |||
|---|---|---|---|
| Quadrant | BADHDUFLAG | Total packets | Discarded packets |
| A | 0 | 13027 | 3 |
| B | 0 | 13859 | 2 |
| C | 0 | 12495 | 2 |
| D | 0 | 15644 | 2 |
| Mode SS | |||
|---|---|---|---|
| Quadrant | BADHDUFLAG | Total packets | Discarded packets |
| A | 0 | 118 | 0 |
| B | 0 | 118 | 0 |
| C | 0 | 118 | 0 |
| D | 0 | 118 | 0 |
| Quadrant | Total seconds | Saturated seconds | Saturation percentage |
|---|---|---|---|
| A | 5899 | 50 | 0.847601% |
| B | 5899 | 134 | 2.271571% |
| C | 5899 | 49 | 0.830649% |
| D | 5899 | 231 | 3.915918% |
Noise dominated data is calculated using 1-second bins in cleaned event files. If a bin has >2000 counts, and if more than 50% of those come from <1% of pixels, then it is considered to be noise-dominated and hence unusable.
| Quadrant | # 1 sec bins | Bins with >0 counts | Bins with >2000 counts | High rate bins dominated by noise | Noise dominated (total time) | Noise dominated (detector-on time) | Marked lightcurve |
|---|---|---|---|---|---|---|---|
| A | 7213 | 5900 | 32 | 32 | 0.44% | 0.54% | 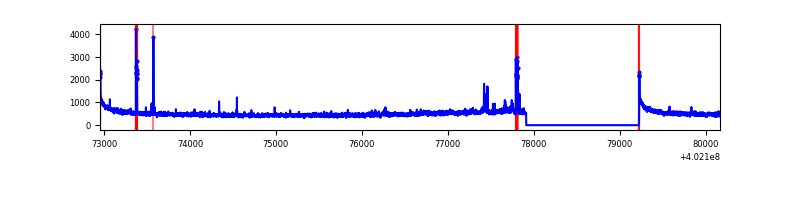 |
| B | 7213 | 5900 | 95 | 95 | 1.32% | 1.61% | 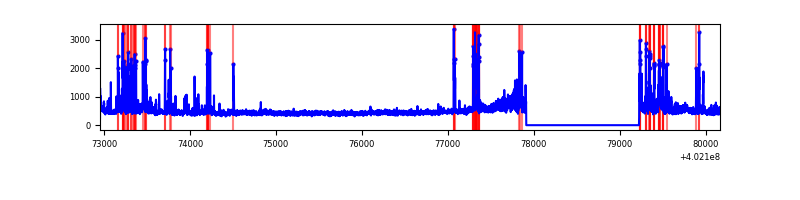 |
| C | 7213 | 5900 | 43 | 43 | 0.60% | 0.73% | 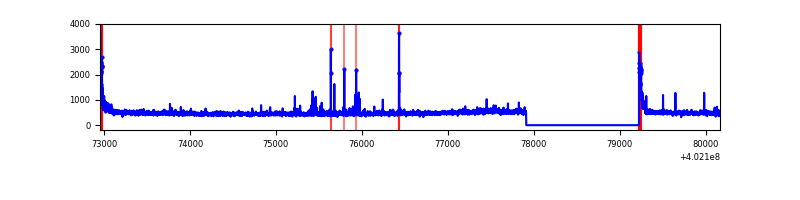 |
| D | 7213 | 5900 | 192 | 192 | 2.66% | 3.25% | 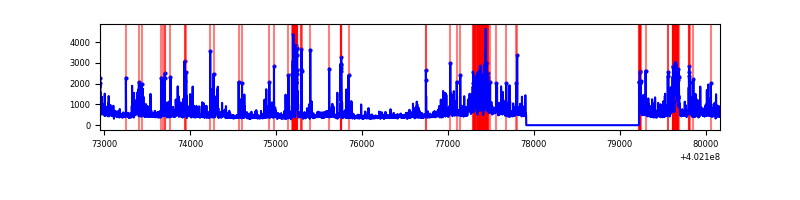 |
Top three noisy pixels from each quadrant. If the there are fewer than three noisy pixels in the level2.evt file, extra rows are filled as -1
| Pixel properties | Quadrant properties | ||||||
|---|---|---|---|---|---|---|---|
| Quadrant | DetID | PixID | Counts | Sigma | Mean | Median | Sigma |
| A | 10 | 83 | 376621 | 2887.86 | 651 | 638 | 130.2 |
| A | 9 | 143 | 123554 | 944.1 | 651 | 638 | 130.2 |
| A | 15 | 222 | 35345 | 266.58 | 651 | 638 | 130.2 |
| B | 5 | 172 | 416869 | 3382.05 | 645 | 628 | 123.1 |
| B | 0 | 189 | 133075 | 1076.16 | 645 | 628 | 123.1 |
| B | 0 | 230 | 47991 | 384.83 | 645 | 628 | 123.1 |
| C | 15 | 214 | 249233 | 1661.04 | 636 | 639 | 149.7 |
| C | 0 | 10 | 137066 | 911.57 | 636 | 639 | 149.7 |
| C | 14 | 254 | 74966 | 496.63 | 636 | 639 | 149.7 |
| D | 12 | 233 | 411663 | 2677.89 | 630 | 614 | 153.5 |
| D | 2 | 249 | 185880 | 1206.97 | 630 | 614 | 153.5 |
| D | 1 | 52 | 120352 | 780.07 | 630 | 614 | 153.5 |
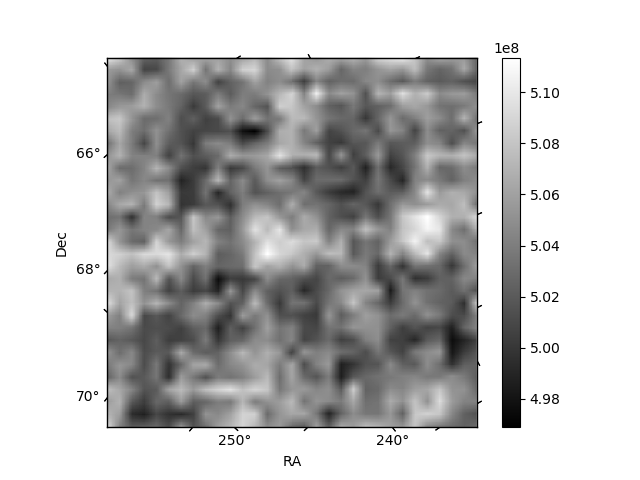
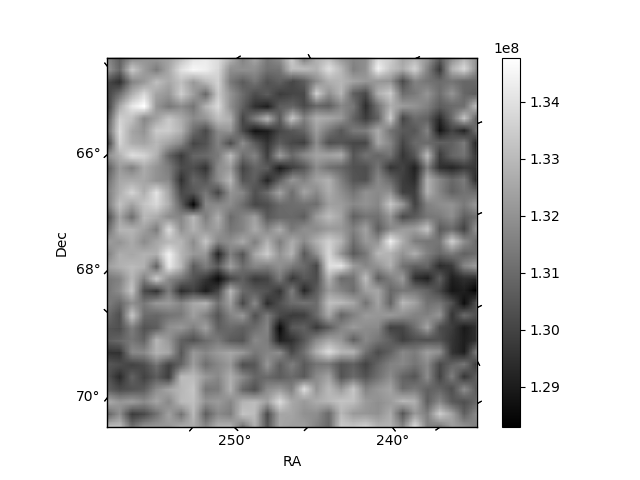
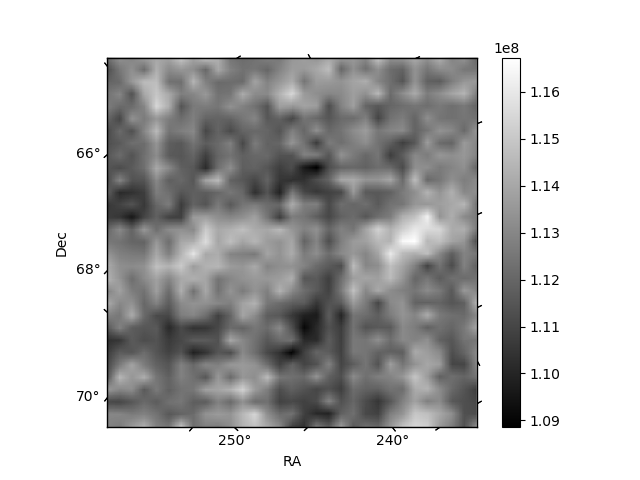
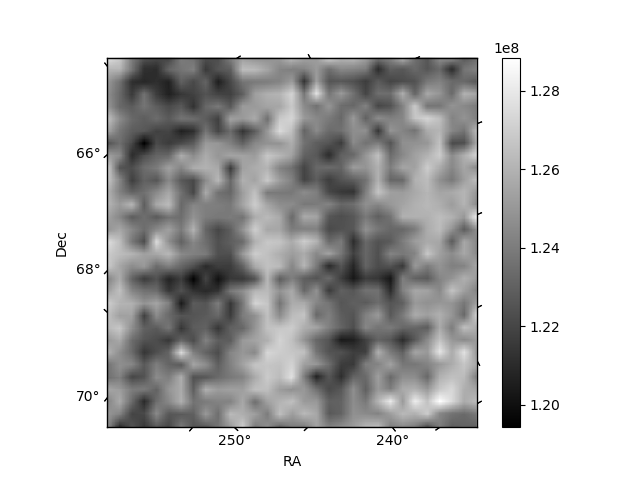
Histogram calculated using DETX and DETY for each event in the final _common_clean file
| Quadrant A | 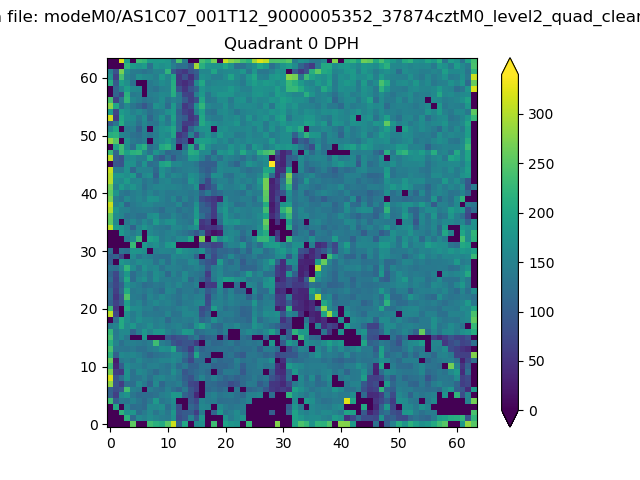 |
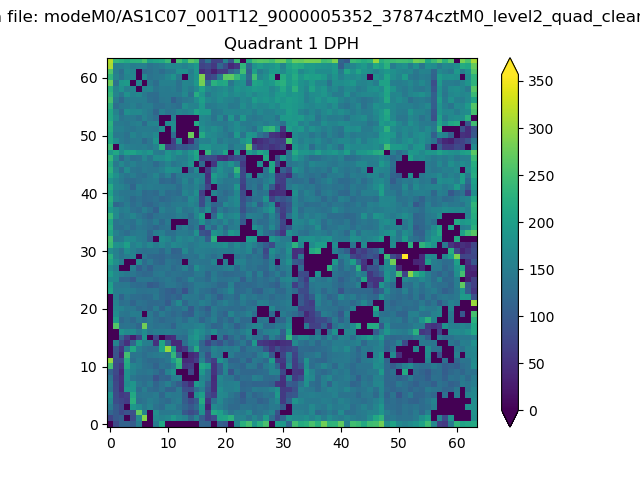 |
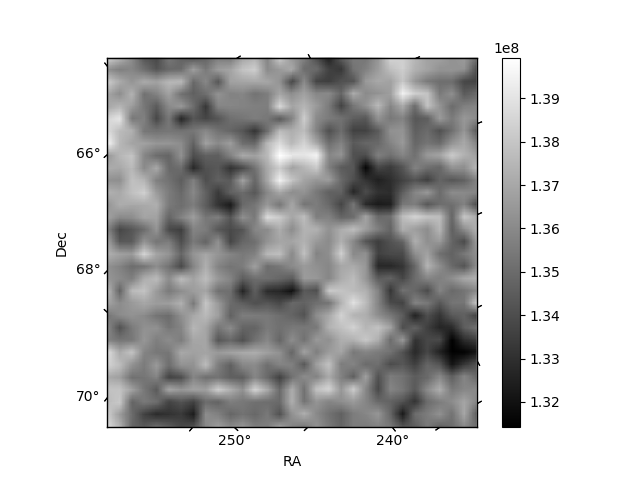
Quadrant B |
|---|---|---|---|
| Quadrant D | 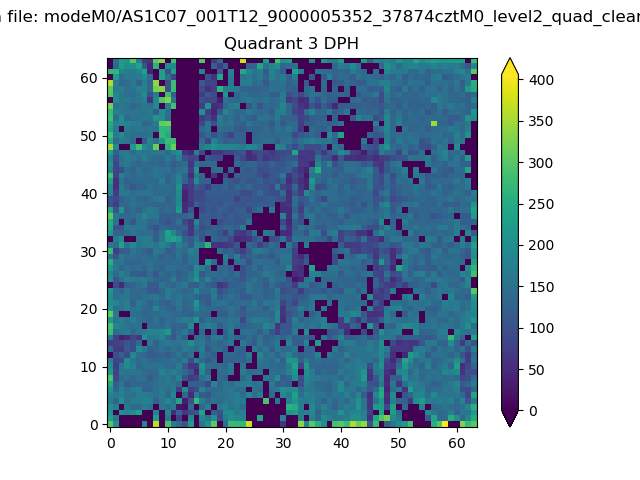 |
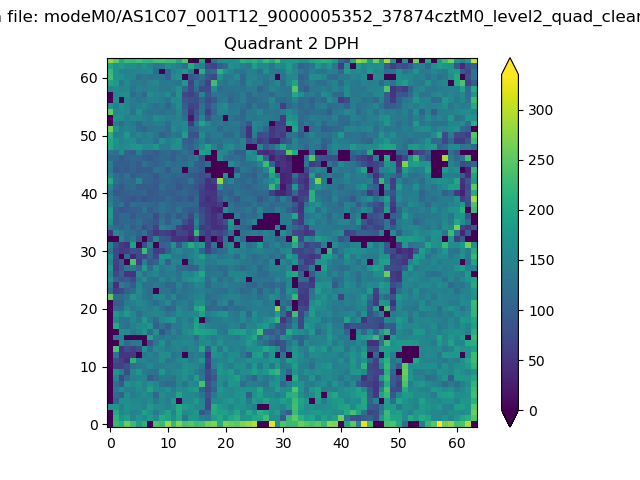 |
Quadrant C |
| Plot type | Count rate plots | Images |
|---|---|---|
| Comparison with Poisson distribution Blue bars denote a histogram of data divided into 1 sec bins. Red curve is a Poisson curve with rate = median count rate of data. |
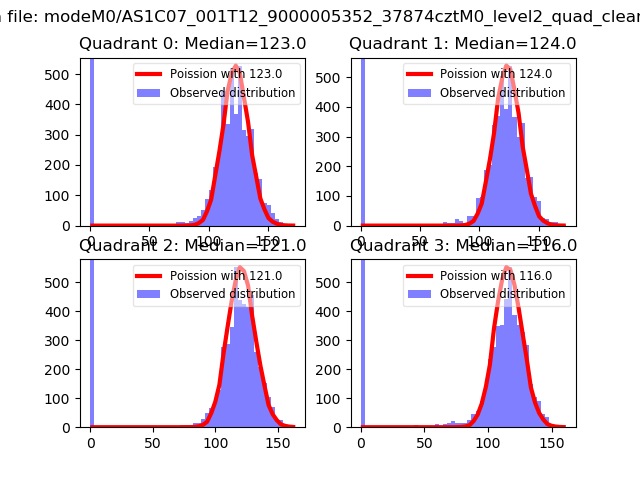 |
 |
| Quadrant-wise count rates Data is divided into 100 sec bins |
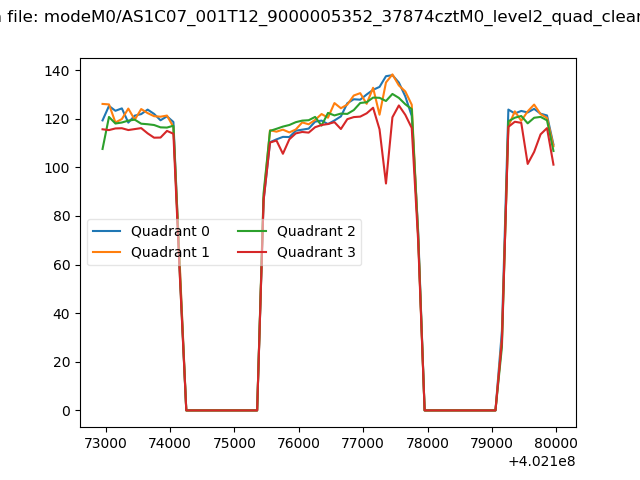 |
|
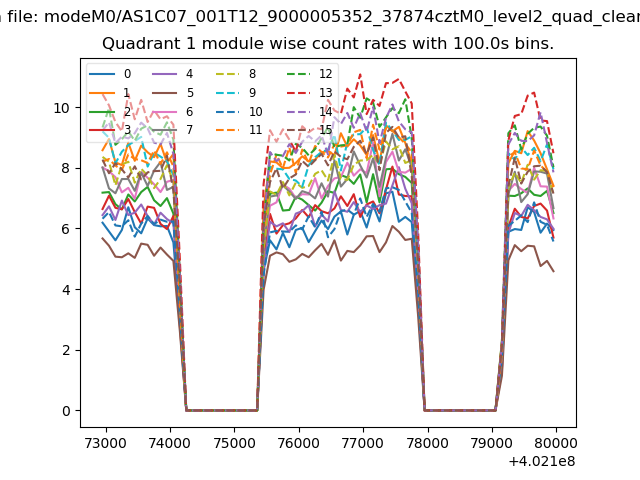
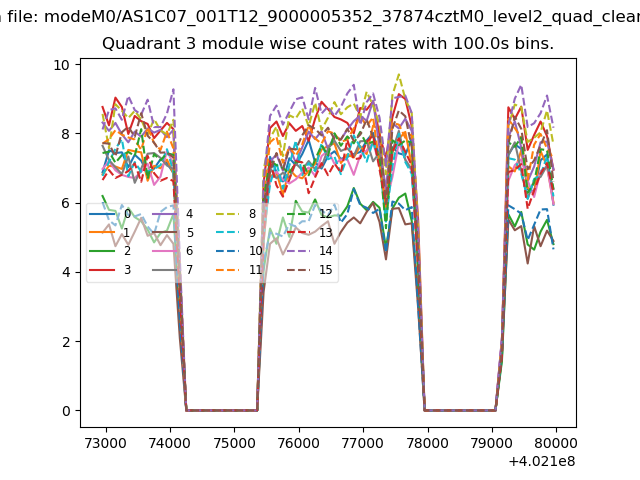
| Module-wise count rates for Quadrant A Data is divided into 100 sec bins |
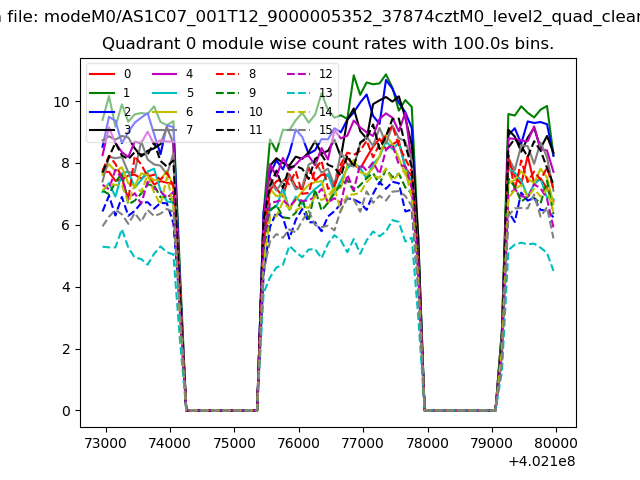 |
 |
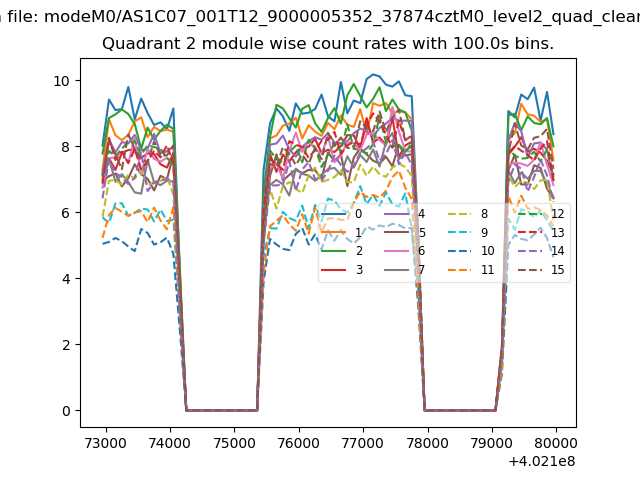
| Module-wise count rates for Quadrant B Data is divided into 100 sec bins |
 |
 |
| Module-wise count rates for Quadrant C Data is divided into 100 sec bins |
 |
 |
| Module-wise count rates for Quadrant D Data is divided into 100 sec bins |
 |
 |
| Parameter | Plot |
|---|---|
| CZT HV Monitor | 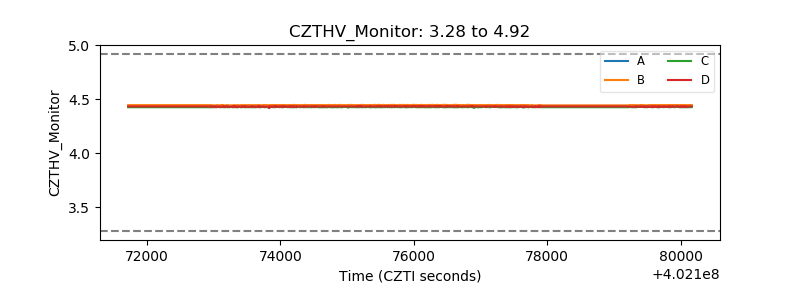 |
| D_VDD | 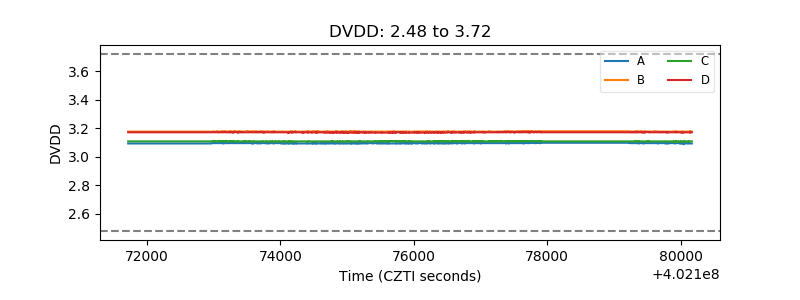 |
| Temperature 1 | 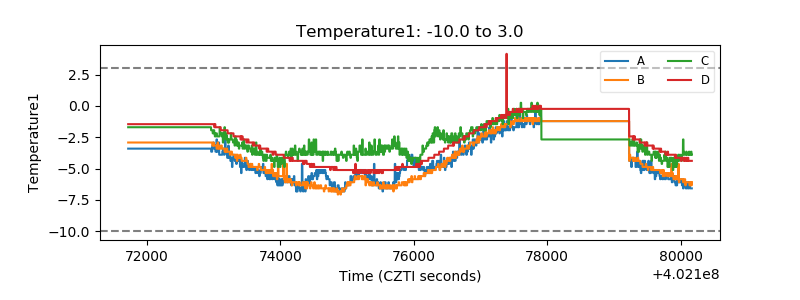 |
| Veto HV Monitor | 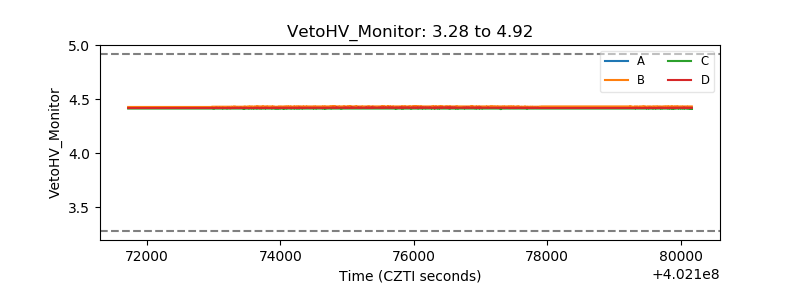 |
| Veto LLD | 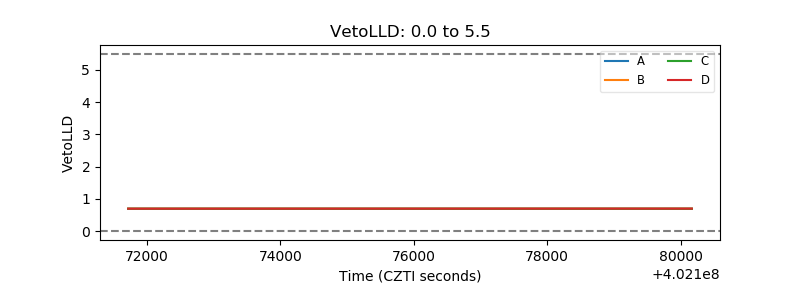 |
| Alpha Counter | 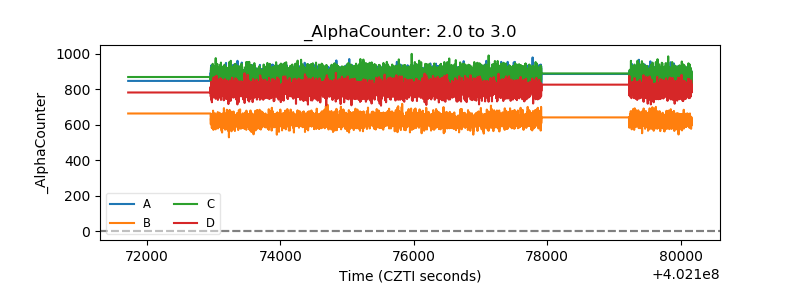 |
| _CPM_Rate | 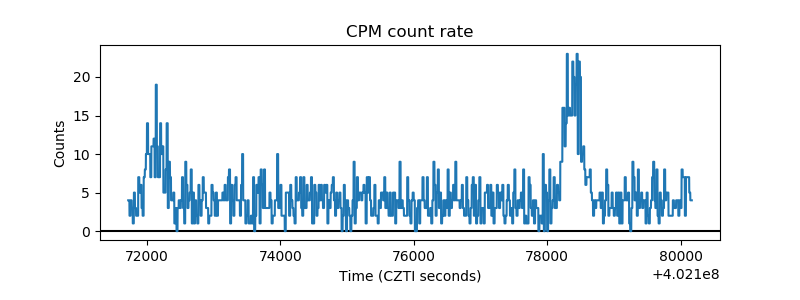 |
| CZT Counter | 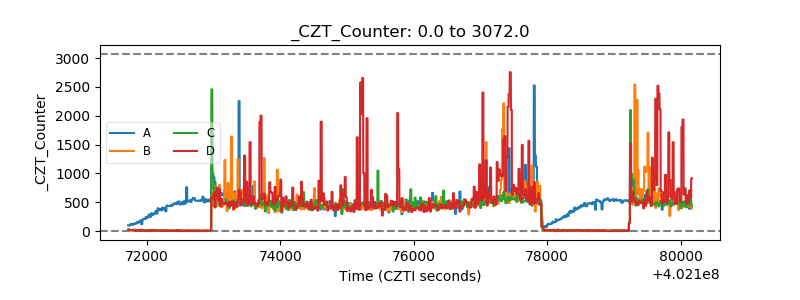 |
| +2.5 Volts monitor | 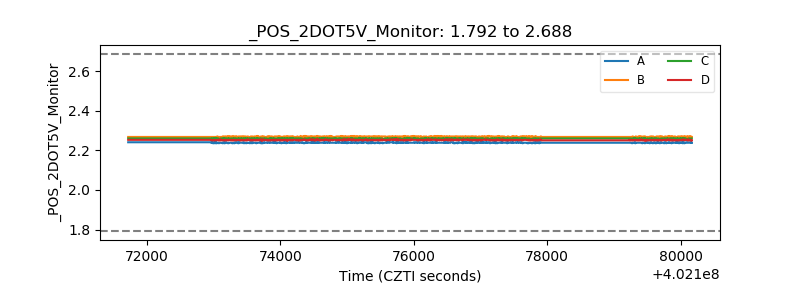 |
| +5 Volts monitor | 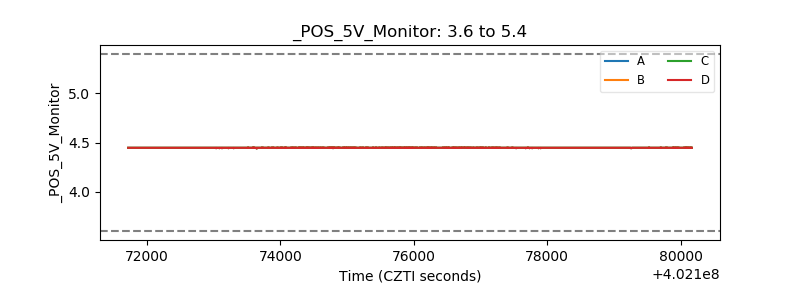 |
| _ROLL_ROT | 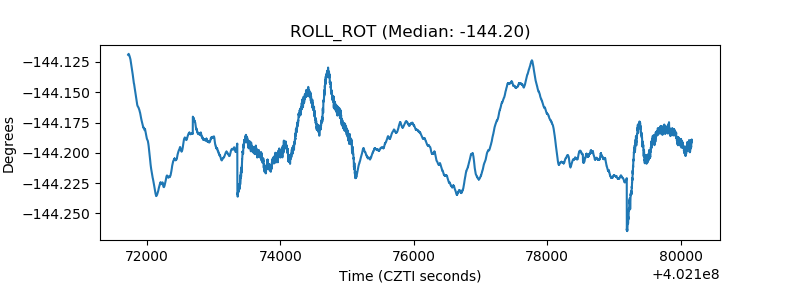 |
| _Roll_DEC | 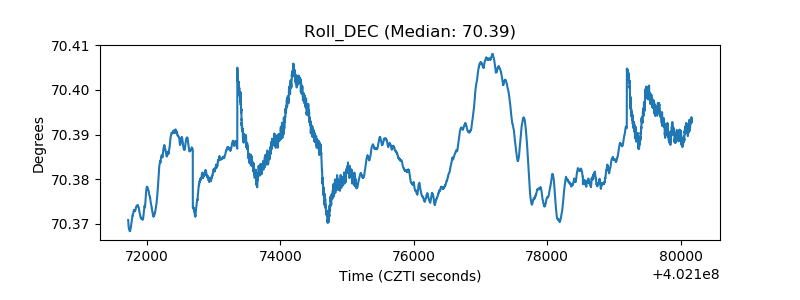 |
| _Roll_RA | 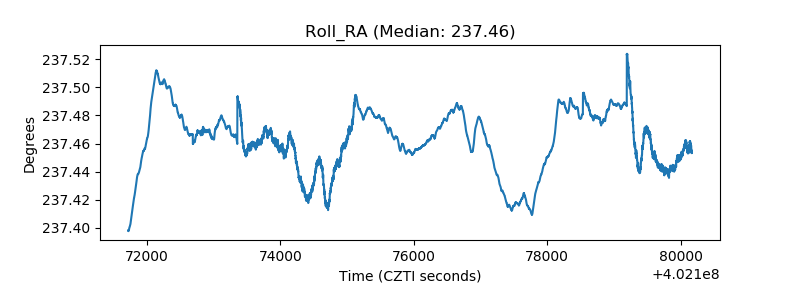 |
| Veto Counter | 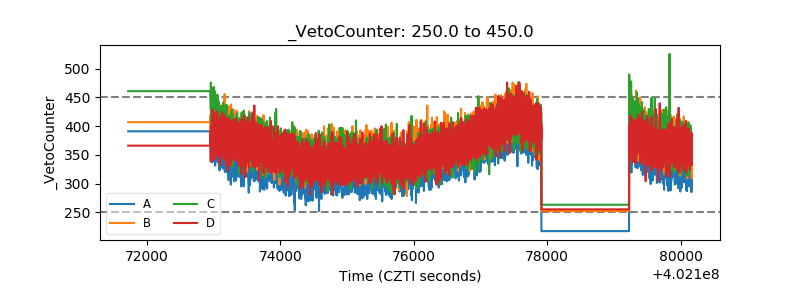 |