| Param | Original file | Final file |
|---|---|---|
| Filename | modeM0/AS1C07_001T12_9000005352_37876cztM0_level2.evt | modeM0/AS1C07_001T12_9000005352_37876cztM0_level2_quad_clean.evt |
| Size (bytes) | 805,582,080 | 138,677,760 |
| Size | 768.3 MB | 132.3 MB |
| Events in quadrant A | 5,657,031 | 879,987 |
| Events in quadrant B | 5,810,754 | 879,174 |
| Events in quadrant C | 5,458,863 | 866,761 |
| Events in quadrant D | 6,738,036 | 824,483 |
| Mode M9 | |||
|---|---|---|---|
| Quadrant | BADHDUFLAG | Total packets | Discarded packets |
| A | 0 | 33 | 0 |
| B | 0 | 33 | 0 |
| C | 0 | 33 | 0 |
| D | 0 | 34 | 0 |
| Mode M0 | |||
|---|---|---|---|
| Quadrant | BADHDUFLAG | Total packets | Discarded packets |
| A | 0 | 23976 | 4 |
| B | 0 | 24688 | 3 |
| C | 0 | 23136 | 3 |
| D | 0 | 27791 | 3 |
| Mode SS | |||
|---|---|---|---|
| Quadrant | BADHDUFLAG | Total packets | Discarded packets |
| A | 0 | 222 | 0 |
| B | 0 | 222 | 0 |
| C | 0 | 222 | 0 |
| D | 0 | 222 | 0 |
| Quadrant | Total seconds | Saturated seconds | Saturation percentage |
|---|---|---|---|
| A | 10820 | 27 | 0.249538% |
| B | 10820 | 229 | 2.116451% |
| C | 10820 | 65 | 0.600739% |
| D | 10820 | 329 | 3.040665% |
Noise dominated data is calculated using 1-second bins in cleaned event files. If a bin has >2000 counts, and if more than 50% of those come from <1% of pixels, then it is considered to be noise-dominated and hence unusable.
| Quadrant | # 1 sec bins | Bins with >0 counts | Bins with >2000 counts | High rate bins dominated by noise | Noise dominated (total time) | Noise dominated (detector-on time) | Marked lightcurve |
|---|---|---|---|---|---|---|---|
| A | 13599 | 10822 | 10 | 10 | 0.07% | 0.09% | 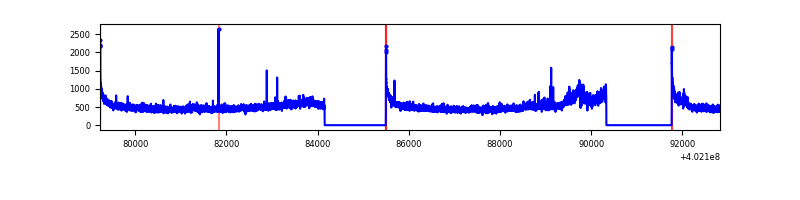 |
| B | 13599 | 10822 | 140 | 140 | 1.03% | 1.29% | 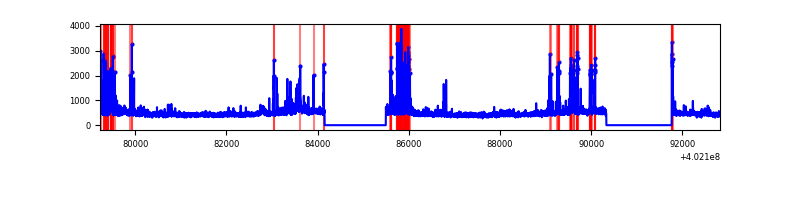 |
| C | 13599 | 10822 | 58 | 58 | 0.43% | 0.54% | 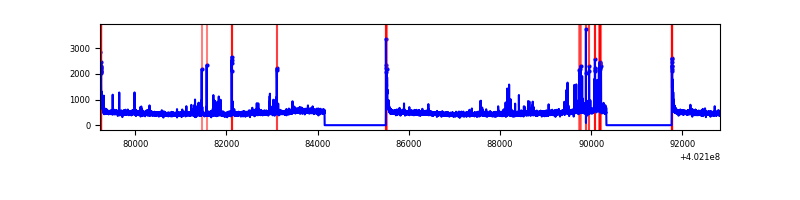 |
| D | 13599 | 10822 | 266 | 266 | 1.96% | 2.46% | 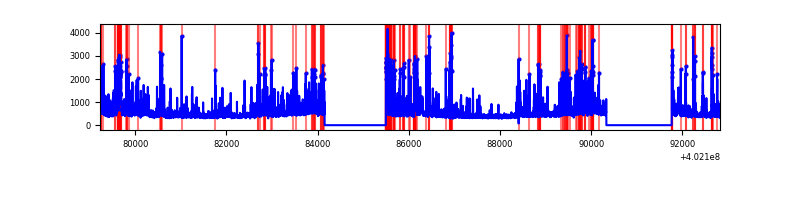 |
Top three noisy pixels from each quadrant. If the there are fewer than three noisy pixels in the level2.evt file, extra rows are filled as -1
| Pixel properties | Quadrant properties | ||||||
|---|---|---|---|---|---|---|---|
| Quadrant | DetID | PixID | Counts | Sigma | Mean | Median | Sigma |
| A | 10 | 83 | 629847 | 2592.17 | 1202 | 1176 | 242.5 |
| A | 15 | 222 | 305458 | 1254.63 | 1202 | 1176 | 242.5 |
| A | 12 | 189 | 22398 | 87.5 | 1202 | 1176 | 242.5 |
| B | 5 | 172 | 713513 | 3166.97 | 1189 | 1159 | 224.9 |
| B | 0 | 189 | 191176 | 844.77 | 1189 | 1159 | 224.9 |
| B | 4 | 81 | 55916 | 243.44 | 1189 | 1159 | 224.9 |
| C | 15 | 214 | 451160 | 1655.02 | 1166 | 1171 | 271.9 |
| C | 14 | 254 | 266249 | 974.93 | 1166 | 1171 | 271.9 |
| C | 0 | 10 | 165004 | 602.56 | 1166 | 1171 | 271.9 |
| D | 2 | 250 | 553766 | 1936.72 | 1162 | 1128 | 285.3 |
| D | 2 | 249 | 312865 | 1092.48 | 1162 | 1128 | 285.3 |
| D | 1 | 52 | 256004 | 893.21 | 1162 | 1128 | 285.3 |
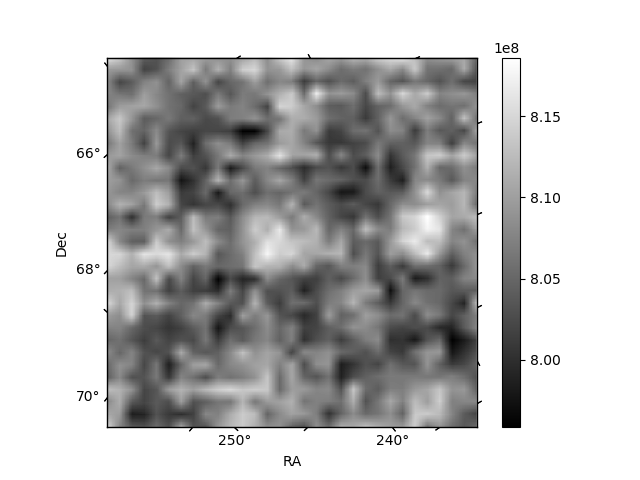
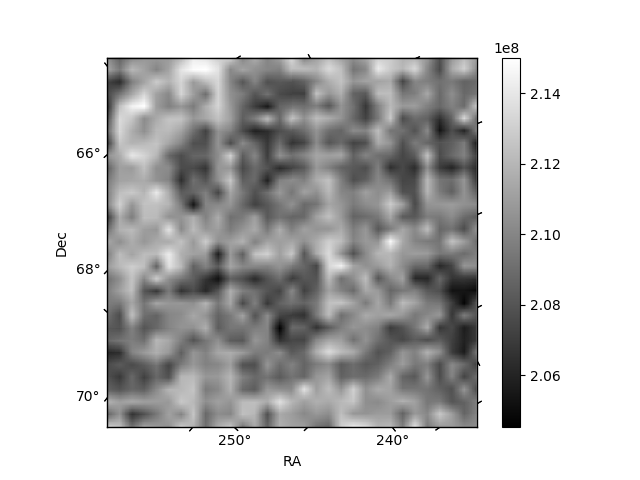
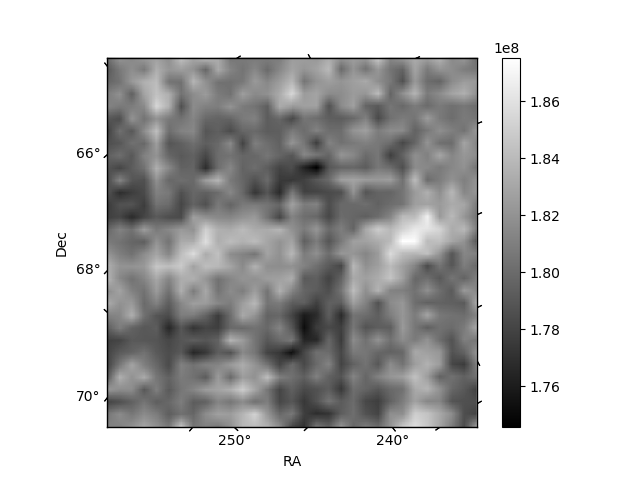
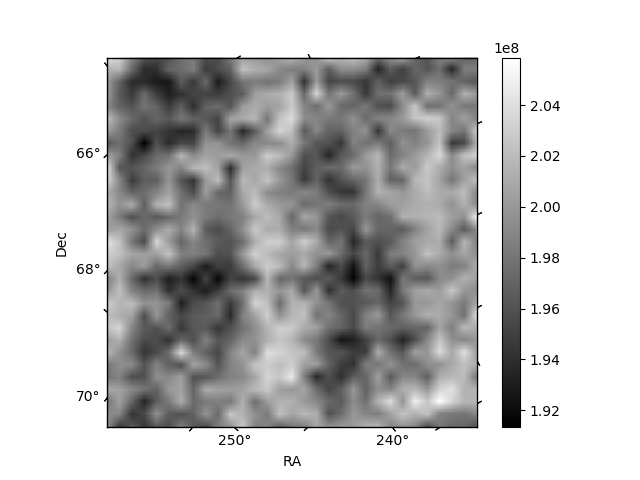
Histogram calculated using DETX and DETY for each event in the final _common_clean file
| Quadrant A | 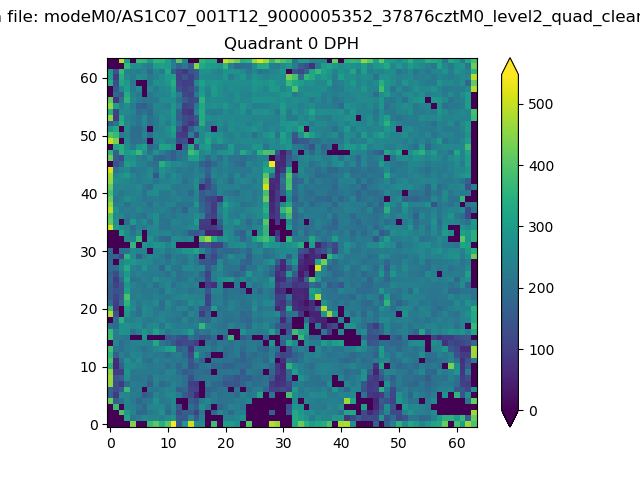 |
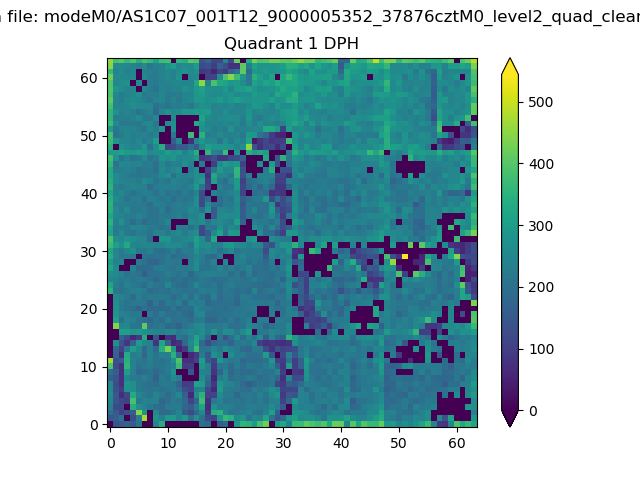 |
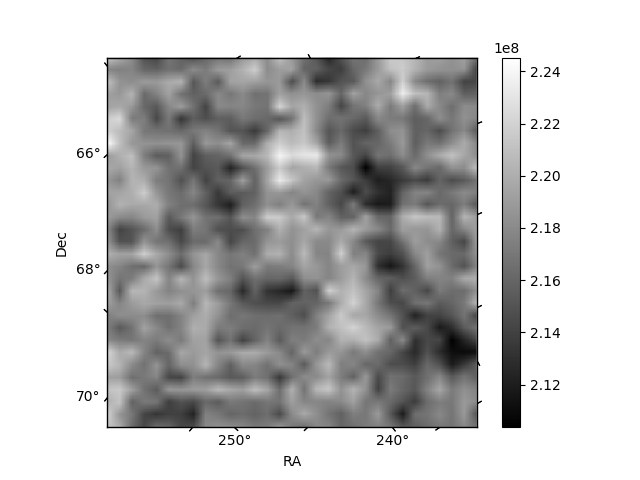
Quadrant B |
|---|---|---|---|
| Quadrant D | 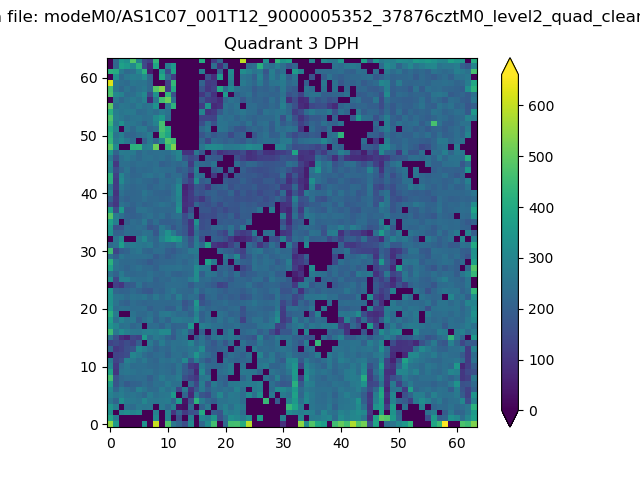 |
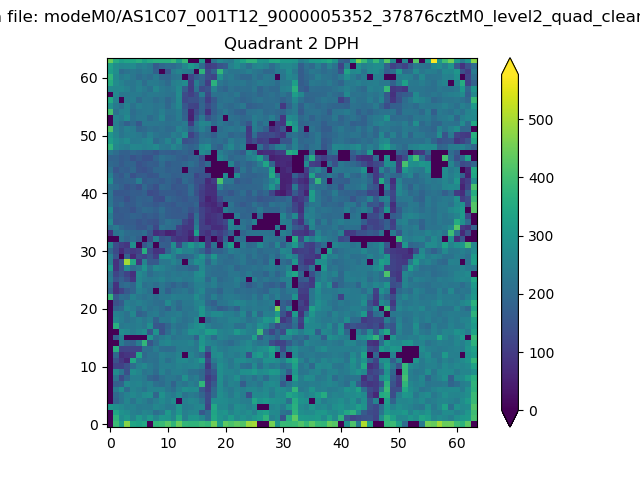 |
Quadrant C |
| Plot type | Count rate plots | Images |
|---|---|---|
| Comparison with Poisson distribution Blue bars denote a histogram of data divided into 1 sec bins. Red curve is a Poisson curve with rate = median count rate of data. |
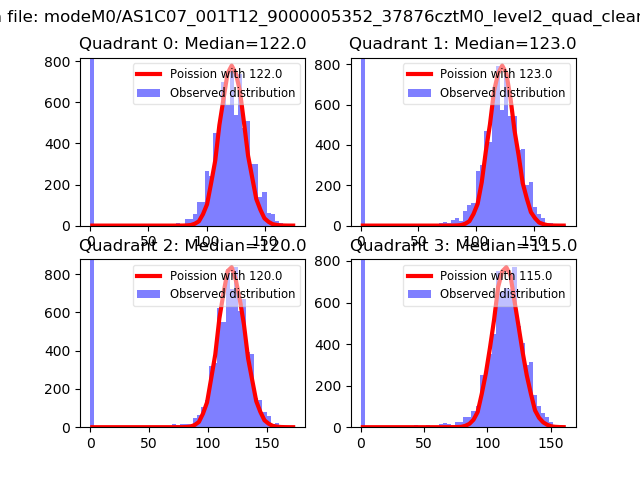 |
 |
| Quadrant-wise count rates Data is divided into 100 sec bins |
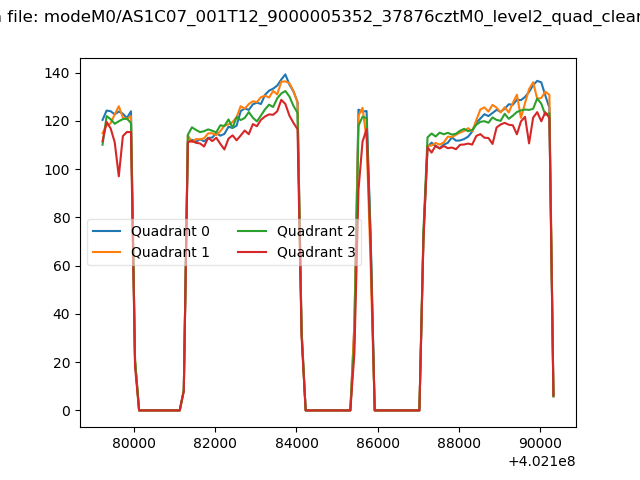 |
|
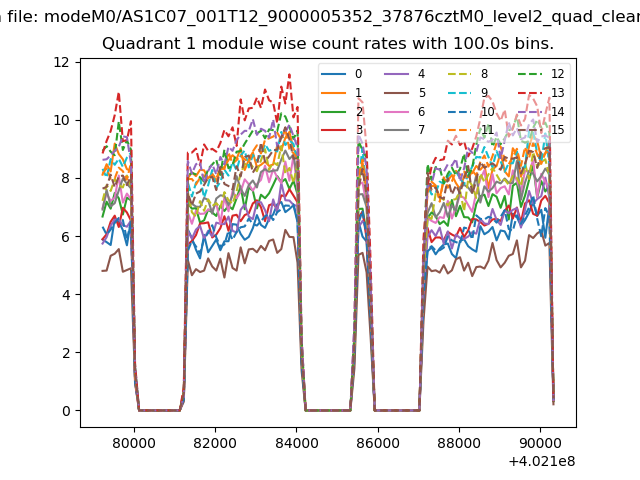
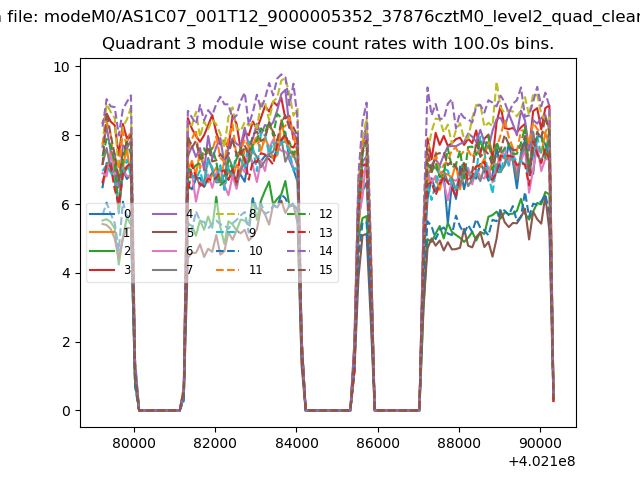
| Module-wise count rates for Quadrant A Data is divided into 100 sec bins |
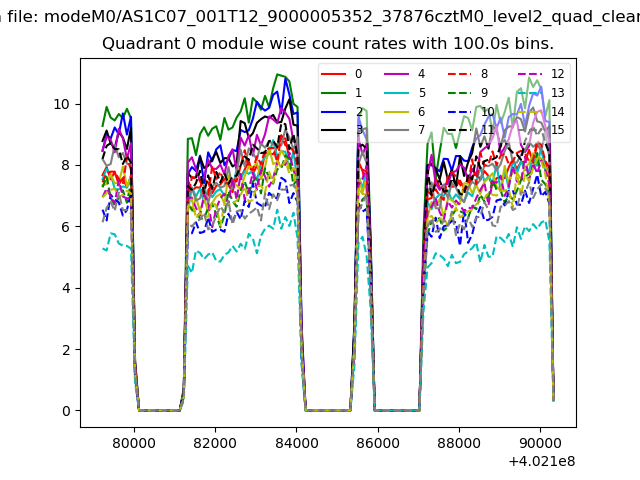 |
 |
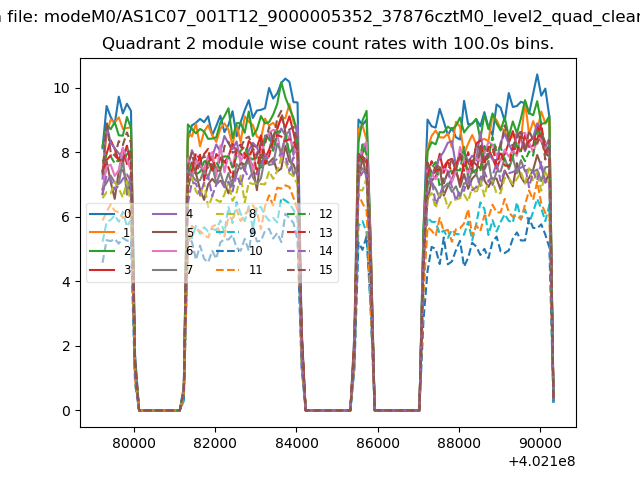
| Module-wise count rates for Quadrant B Data is divided into 100 sec bins |
 |
 |
| Module-wise count rates for Quadrant C Data is divided into 100 sec bins |
 |
 |
| Module-wise count rates for Quadrant D Data is divided into 100 sec bins |
 |
 |
| Parameter | Plot |
|---|---|
| CZT HV Monitor | 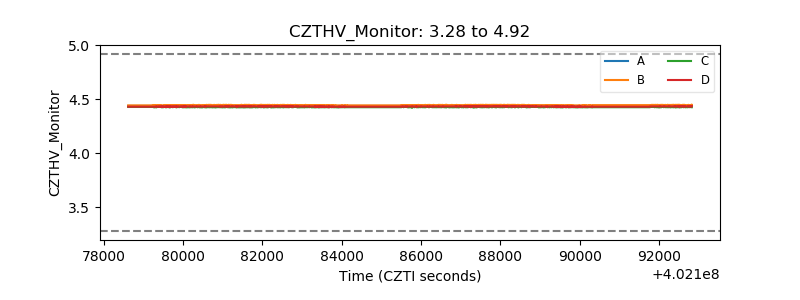 |
| D_VDD | 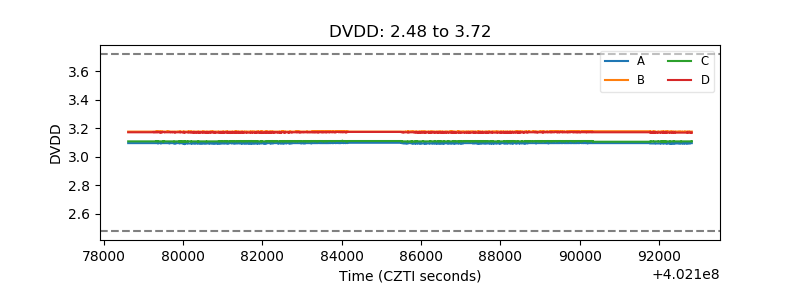 |
| Temperature 1 | 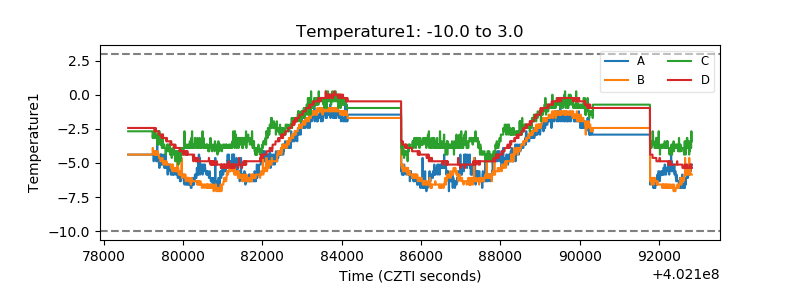 |
| Veto HV Monitor | 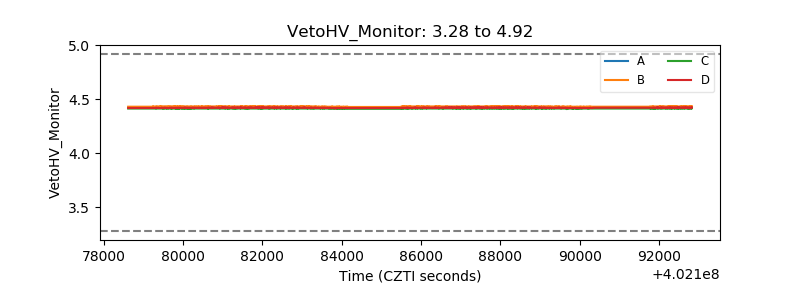 |
| Veto LLD | 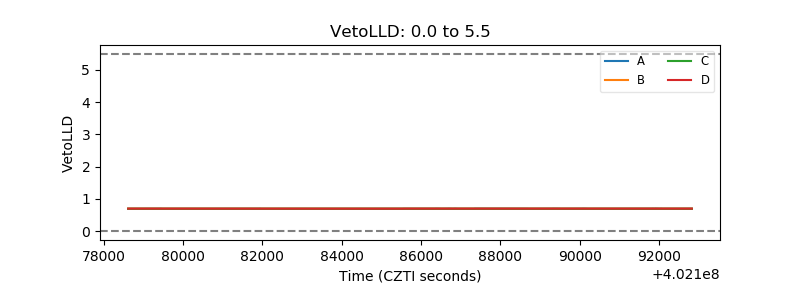 |
| Alpha Counter | 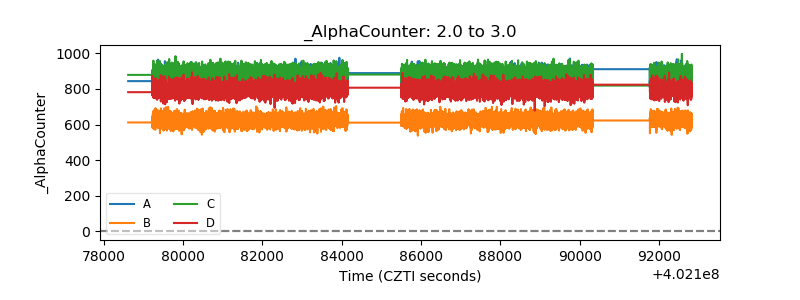 |
| _CPM_Rate | 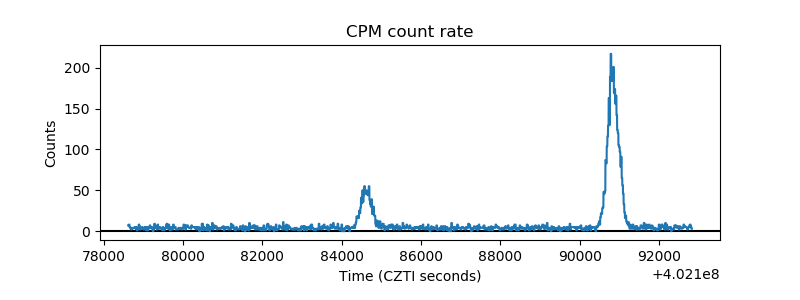 |
| CZT Counter | 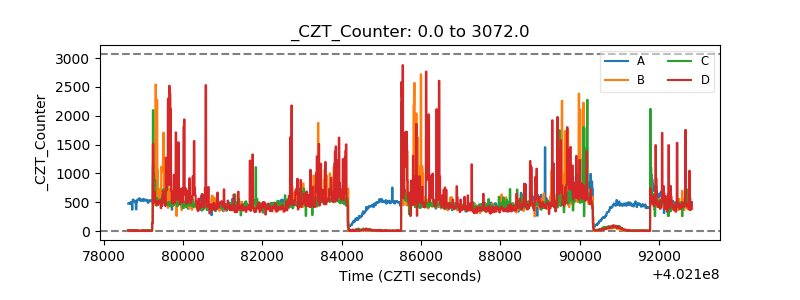 |
| +2.5 Volts monitor | 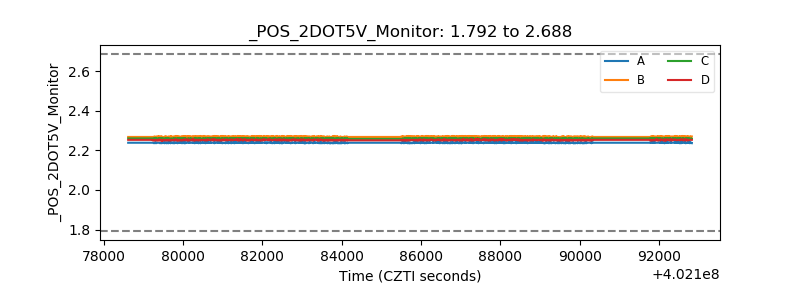 |
| +5 Volts monitor | 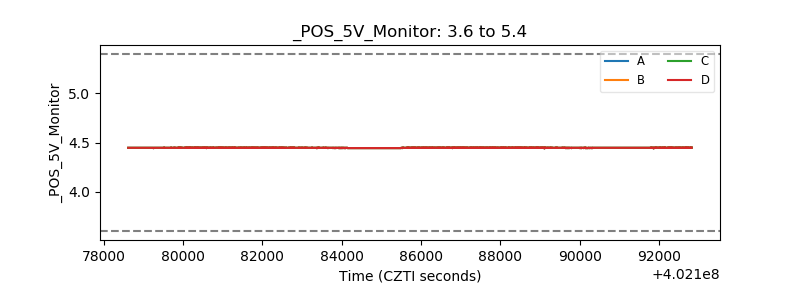 |
| _ROLL_ROT | 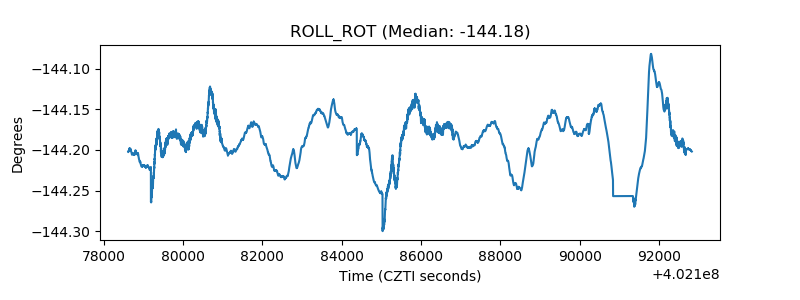 |
| _Roll_DEC | 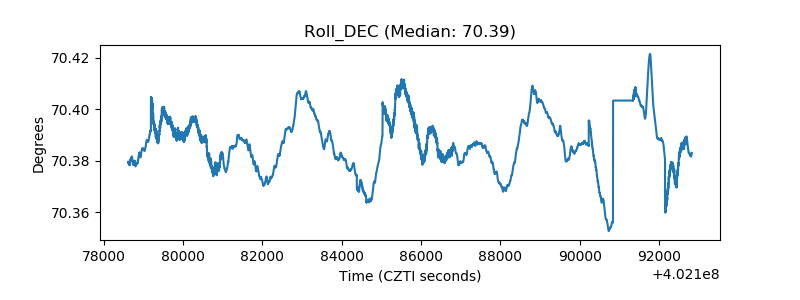 |
| _Roll_RA | 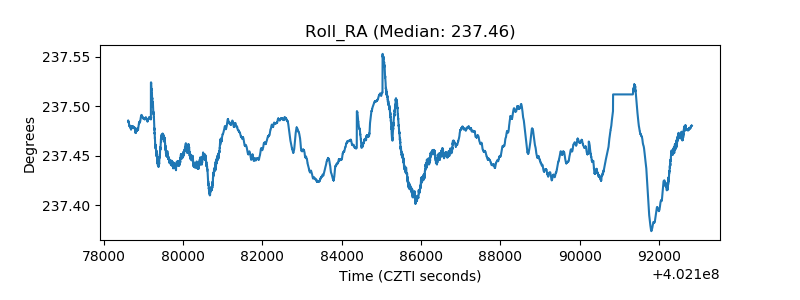 |
| Veto Counter | 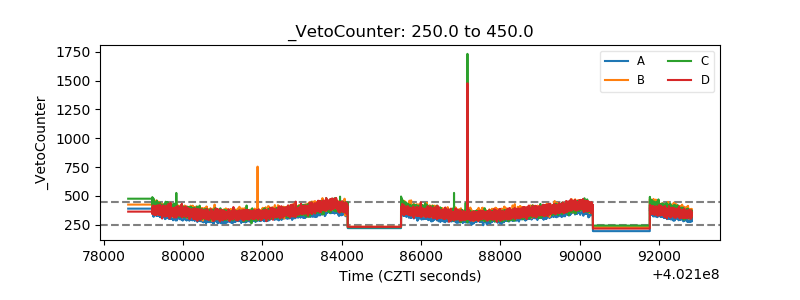 |