| Param | Original file | Final file |
|---|---|---|
| Filename | modeM0/AS1C07_001T12_9000005352_37877cztM0_level2.evt | modeM0/AS1C07_001T12_9000005352_37877cztM0_level2_quad_clean.evt |
| Size (bytes) | 430,335,360 | 69,805,440 |
| Size | 410.4 MB | 66.6 MB |
| Events in quadrant A | 2,884,162 | 437,425 |
| Events in quadrant B | 2,766,278 | 441,543 |
| Events in quadrant C | 2,821,012 | 431,452 |
| Events in quadrant D | 4,174,286 | 404,947 |
| Mode M9 | |||
|---|---|---|---|
| Quadrant | BADHDUFLAG | Total packets | Discarded packets |
| A | 0 | 30 | 0 |
| B | 0 | 30 | 0 |
| C | 0 | 30 | 0 |
| D | 0 | 30 | 0 |
| Mode M0 | |||
|---|---|---|---|
| Quadrant | BADHDUFLAG | Total packets | Discarded packets |
| A | 0 | 12206 | 3 |
| B | 0 | 12163 | 2 |
| C | 0 | 11991 | 2 |
| D | 0 | 16544 | 2 |
| Mode SS | |||
|---|---|---|---|
| Quadrant | BADHDUFLAG | Total packets | Discarded packets |
| A | 0 | 118 | 0 |
| B | 0 | 118 | 0 |
| C | 0 | 118 | 0 |
| D | 0 | 118 | 0 |
| Quadrant | Total seconds | Saturated seconds | Saturation percentage |
|---|---|---|---|
| A | 5693 | 9 | 0.158089% |
| B | 5693 | 31 | 0.544528% |
| C | 5693 | 21 | 0.368874% |
| D | 5693 | 442 | 7.763921% |
Noise dominated data is calculated using 1-second bins in cleaned event files. If a bin has >2000 counts, and if more than 50% of those come from <1% of pixels, then it is considered to be noise-dominated and hence unusable.
| Quadrant | # 1 sec bins | Bins with >0 counts | Bins with >2000 counts | High rate bins dominated by noise | Noise dominated (total time) | Noise dominated (detector-on time) | Marked lightcurve |
|---|---|---|---|---|---|---|---|
| A | 8681 | 5695 | 3 | 3 | 0.03% | 0.05% | 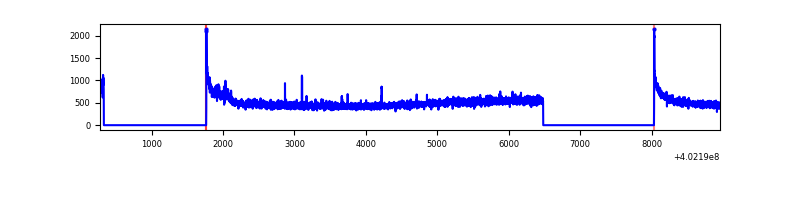 |
| B | 8681 | 5695 | 10 | 10 | 0.12% | 0.18% | 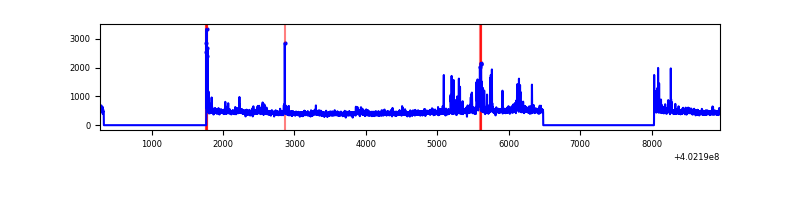 |
| C | 8681 | 5695 | 19 | 19 | 0.22% | 0.33% | 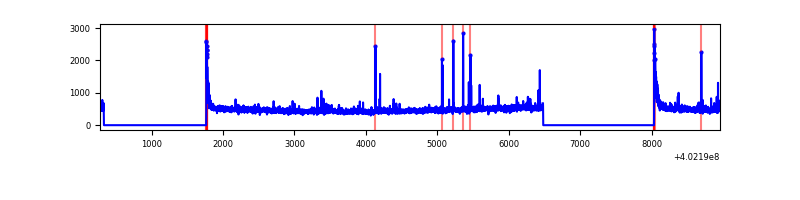 |
| D | 8681 | 5695 | 340 | 340 | 3.92% | 5.97% | 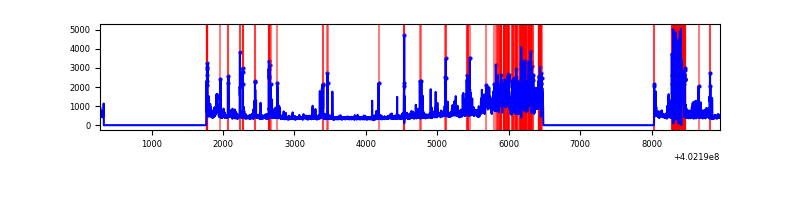 |
Top three noisy pixels from each quadrant. If the there are fewer than three noisy pixels in the level2.evt file, extra rows are filled as -1
| Pixel properties | Quadrant properties | ||||||
|---|---|---|---|---|---|---|---|
| Quadrant | DetID | PixID | Counts | Sigma | Mean | Median | Sigma |
| A | 10 | 83 | 355343 | 2774.49 | 630 | 618 | 127.9 |
| A | 15 | 222 | 54030 | 417.76 | 630 | 618 | 127.9 |
| A | 12 | 189 | 14612 | 109.45 | 630 | 618 | 127.9 |
| B | 5 | 172 | 188626 | 1548.06 | 627 | 610 | 121.5 |
| B | 0 | 189 | 43102 | 349.87 | 627 | 610 | 121.5 |
| B | 0 | 230 | 21320 | 170.52 | 627 | 610 | 121.5 |
| C | 15 | 214 | 236610 | 1656.27 | 611 | 616 | 142.5 |
| C | 0 | 10 | 108490 | 757.09 | 611 | 616 | 142.5 |
| C | 14 | 254 | 77061 | 536.51 | 611 | 616 | 142.5 |
| D | 1 | 52 | 587016 | 4115.2 | 586 | 570 | 142.5 |
| D | 12 | 235 | 536660 | 3761.84 | 586 | 570 | 142.5 |
| D | 2 | 250 | 406766 | 2850.35 | 586 | 570 | 142.5 |
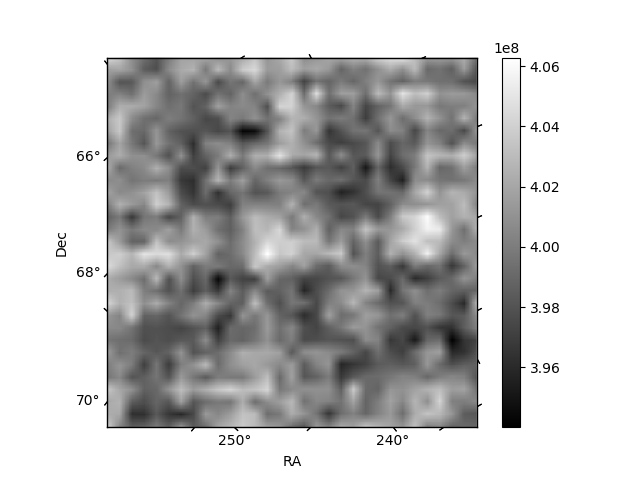
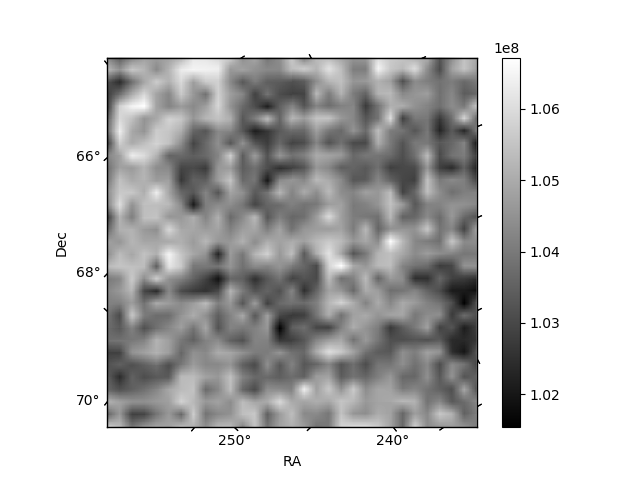
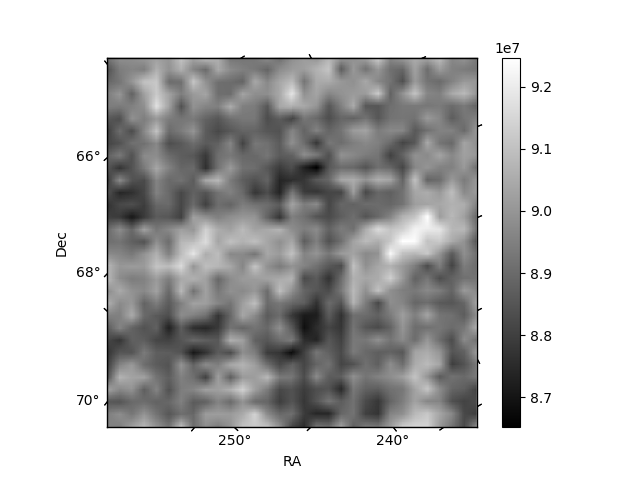
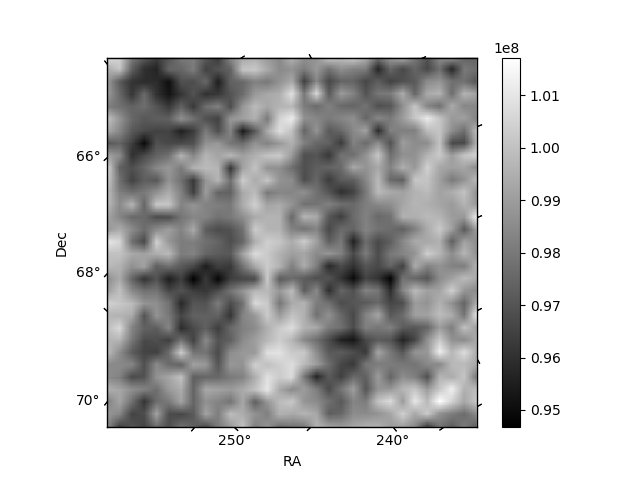
Histogram calculated using DETX and DETY for each event in the final _common_clean file
| Quadrant A | 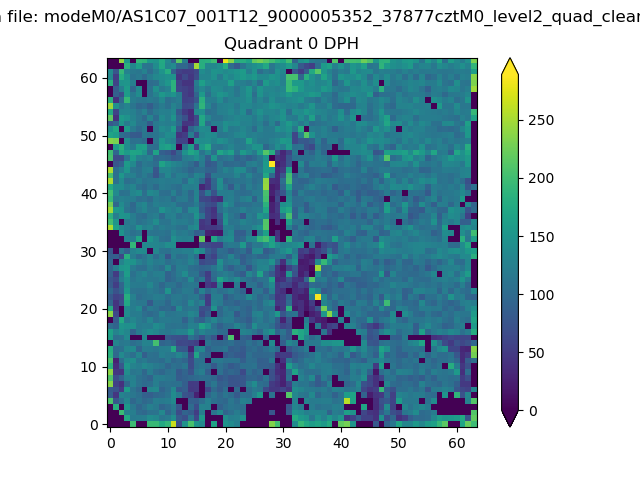 |
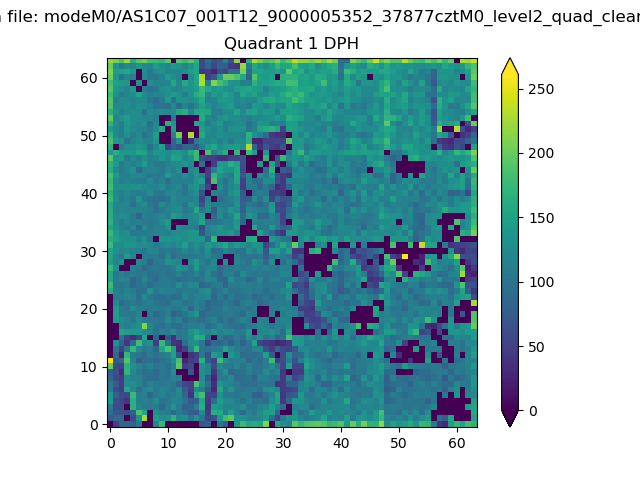 |
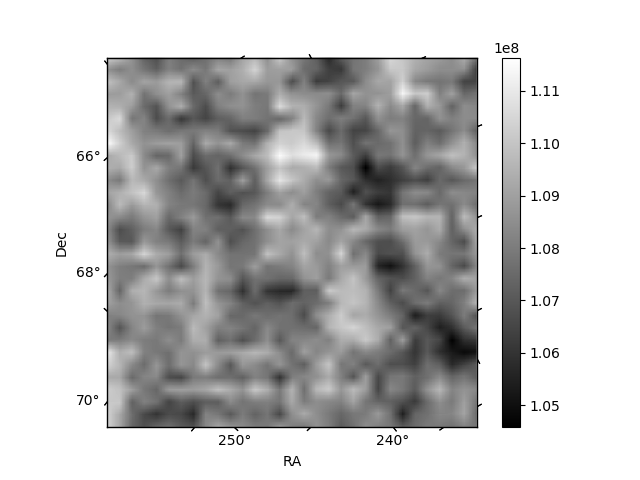
Quadrant B |
|---|---|---|---|
| Quadrant D | 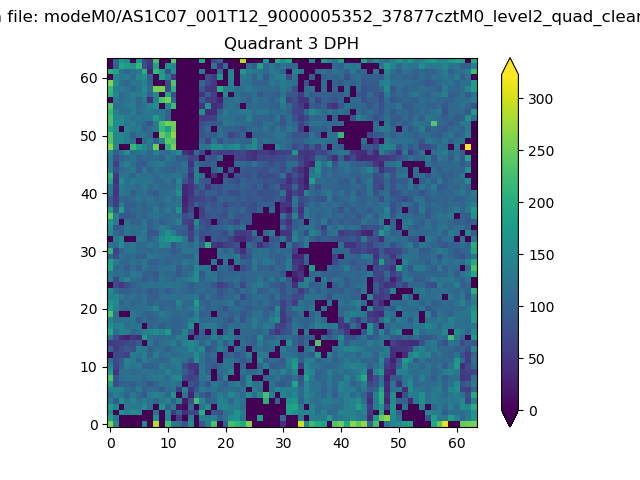 |
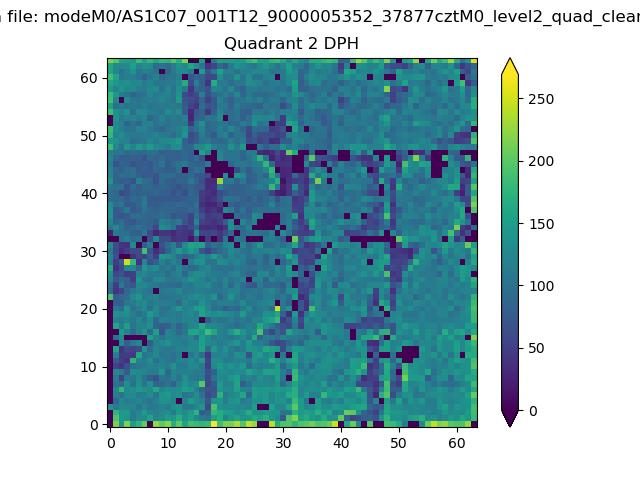 |
Quadrant C |
| Plot type | Count rate plots | Images |
|---|---|---|
| Comparison with Poisson distribution Blue bars denote a histogram of data divided into 1 sec bins. Red curve is a Poisson curve with rate = median count rate of data. |
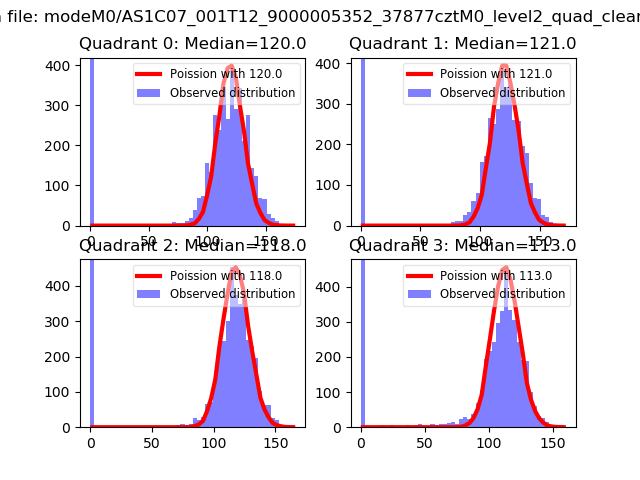 |
 |
| Quadrant-wise count rates Data is divided into 100 sec bins |
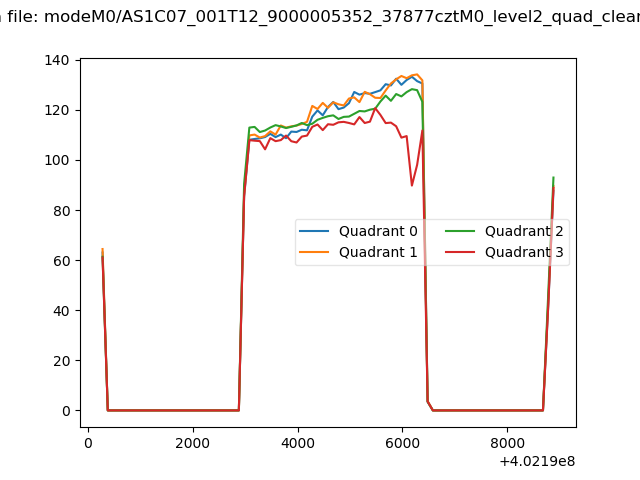 |
|
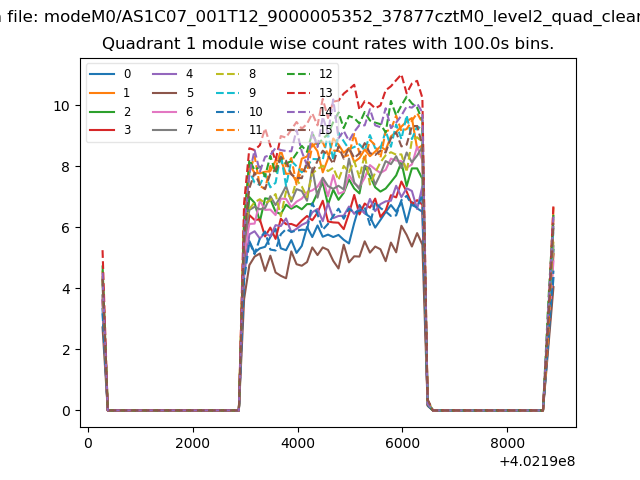
| Module-wise count rates for Quadrant A Data is divided into 100 sec bins |
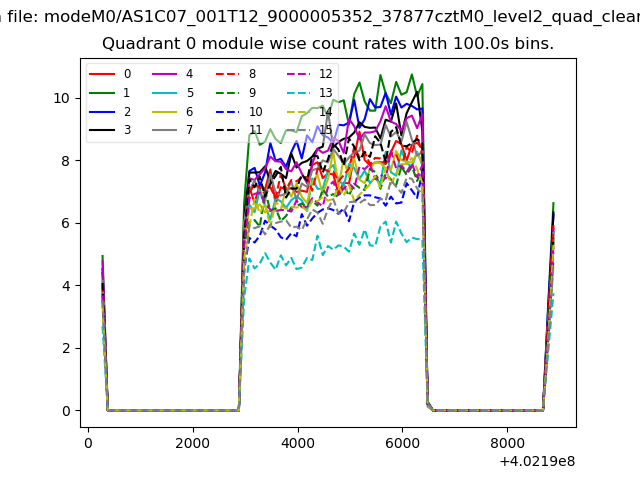 |
 |
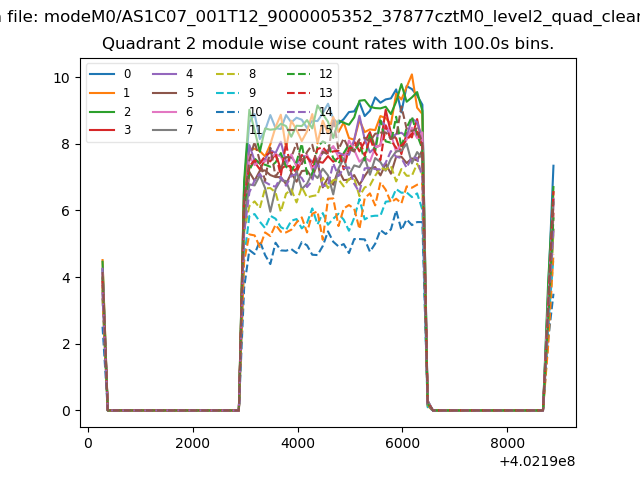
| Module-wise count rates for Quadrant B Data is divided into 100 sec bins |
 |
 |
| Module-wise count rates for Quadrant C Data is divided into 100 sec bins |
 |
 |
| Module-wise count rates for Quadrant D Data is divided into 100 sec bins |
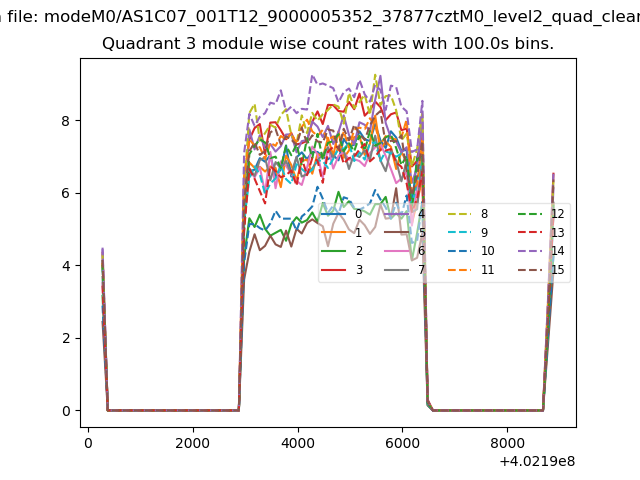 |
 |
| Parameter | Plot |
|---|---|
| CZT HV Monitor | 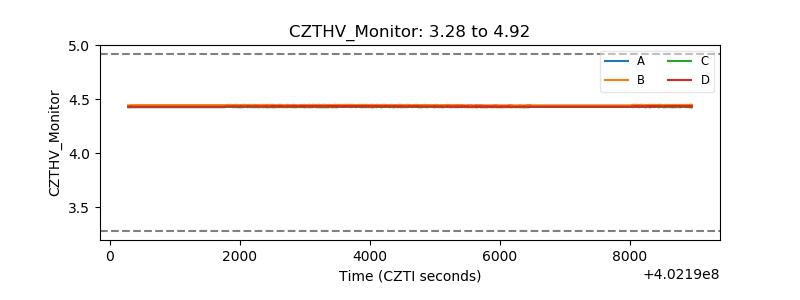 |
| D_VDD | 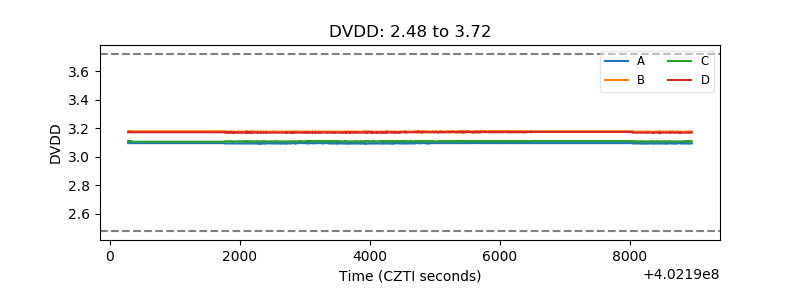 |
| Temperature 1 | 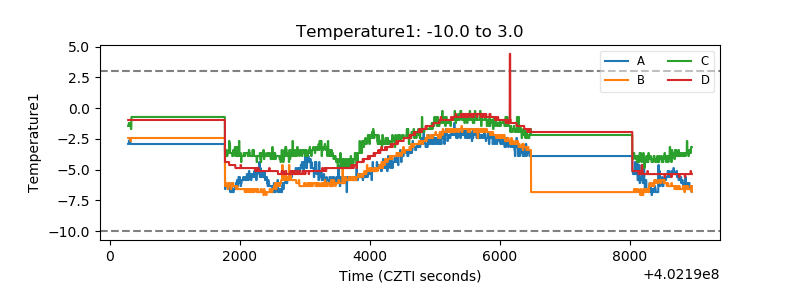 |
| Veto HV Monitor | 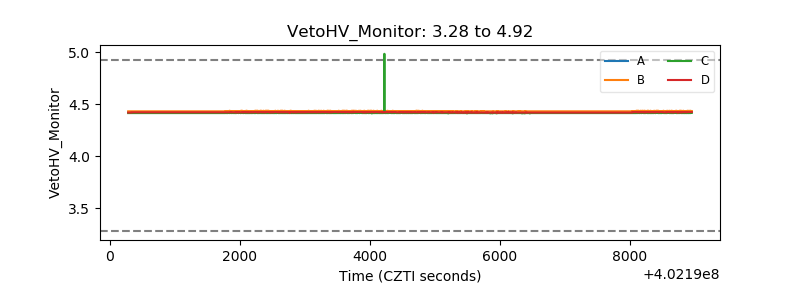 |
| Veto LLD | 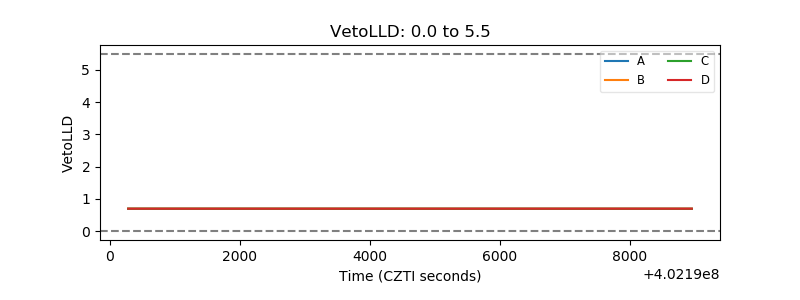 |
| Alpha Counter | 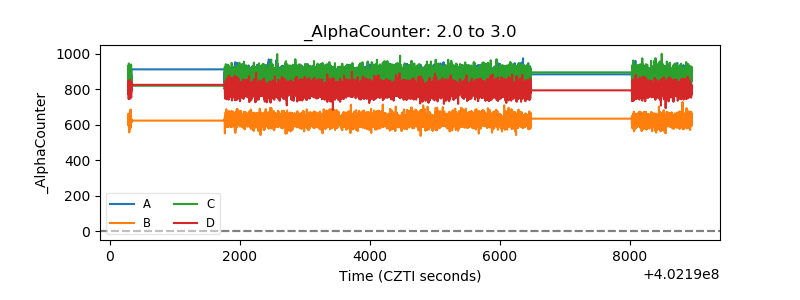 |
| _CPM_Rate | 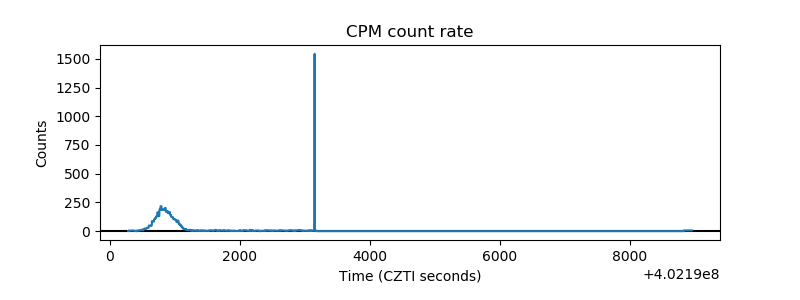 |
| CZT Counter | 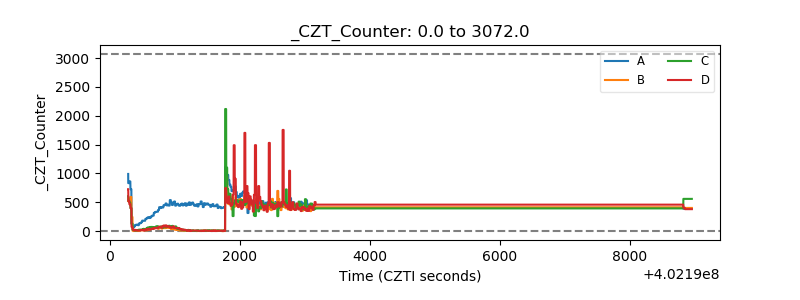 |
| +2.5 Volts monitor | 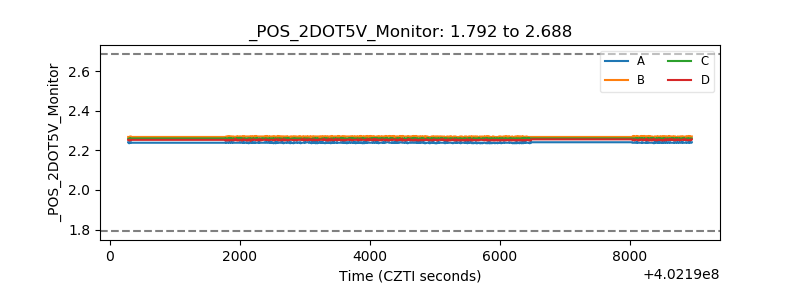 |
| +5 Volts monitor | 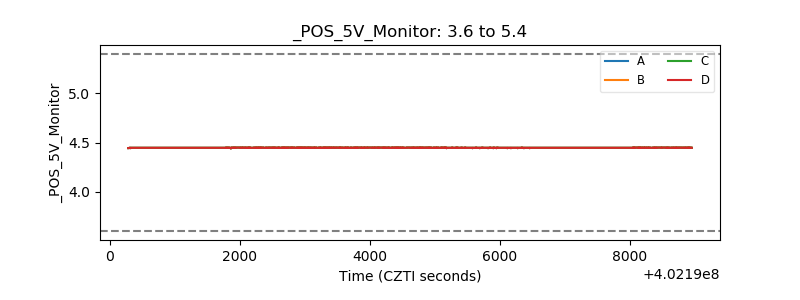 |
| _ROLL_ROT | 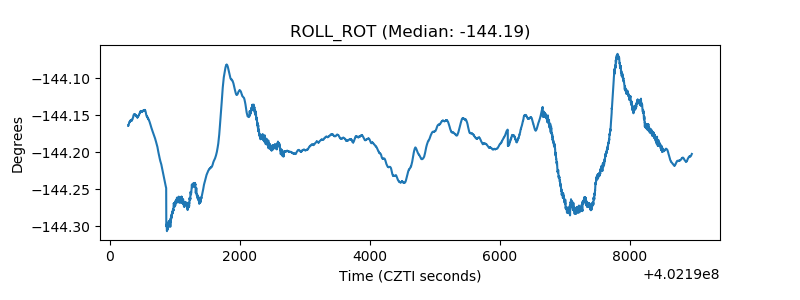 |
| _Roll_DEC | 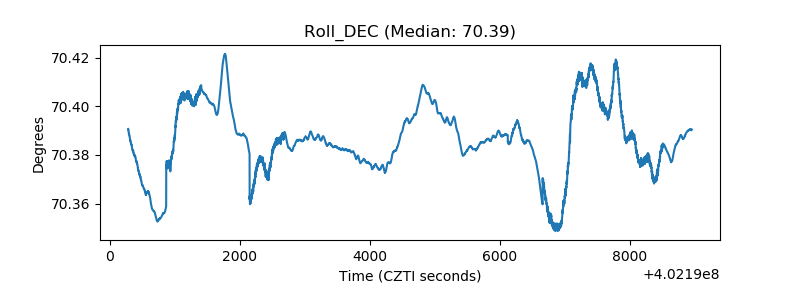 |
| _Roll_RA | 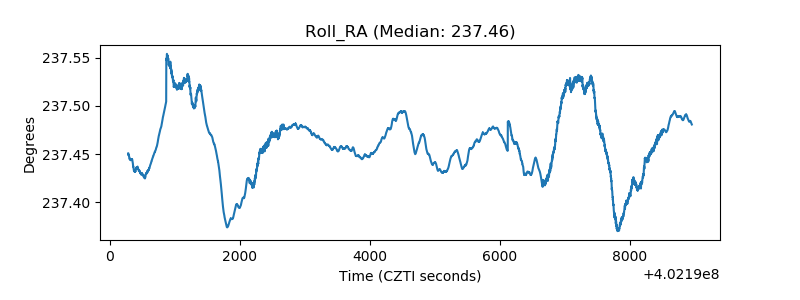 |
| Veto Counter | 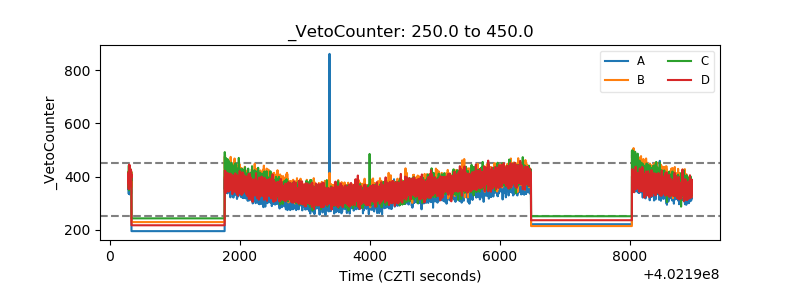 |