| Param | Original file | Final file |
|---|---|---|
| Filename | modeM0/AS1C07_001T12_9000005352_37878cztM0_level2.evt | modeM0/AS1C07_001T12_9000005352_37878cztM0_level2_quad_clean.evt |
| Size (bytes) | 489,723,840 | 80,683,200 |
| Size | 467.0 MB | 76.9 MB |
| Events in quadrant A | 2,841,117 | 535,230 |
| Events in quadrant B | 2,839,288 | 539,413 |
| Events in quadrant C | 2,920,890 | 527,731 |
| Events in quadrant D | 5,848,778 | 447,901 |
| Mode M9 | |||
|---|---|---|---|
| Quadrant | BADHDUFLAG | Total packets | Discarded packets |
| A | 0 | 33 | 0 |
| B | 0 | 33 | 0 |
| C | 0 | 33 | 0 |
| D | 0 | 33 | 0 |
| Mode M0 | |||
|---|---|---|---|
| Quadrant | BADHDUFLAG | Total packets | Discarded packets |
| A | 0 | 11951 | 3 |
| B | 0 | 12215 | 2 |
| C | 0 | 12274 | 2 |
| D | 0 | 21183 | 2 |
| Mode SS | |||
|---|---|---|---|
| Quadrant | BADHDUFLAG | Total packets | Discarded packets |
| A | 0 | 114 | 0 |
| B | 0 | 114 | 0 |
| C | 0 | 114 | 0 |
| D | 0 | 114 | 0 |
| Quadrant | Total seconds | Saturated seconds | Saturation percentage |
|---|---|---|---|
| A | 5622 | 14 | 0.249022% |
| B | 5622 | 75 | 1.334045% |
| C | 5622 | 53 | 0.942725% |
| D | 5622 | 1094 | 19.459267% |
Noise dominated data is calculated using 1-second bins in cleaned event files. If a bin has >2000 counts, and if more than 50% of those come from <1% of pixels, then it is considered to be noise-dominated and hence unusable.
| Quadrant | # 1 sec bins | Bins with >0 counts | Bins with >2000 counts | High rate bins dominated by noise | Noise dominated (total time) | Noise dominated (detector-on time) | Marked lightcurve |
|---|---|---|---|---|---|---|---|
| A | 8877 | 5624 | 3 | 3 | 0.03% | 0.05% | 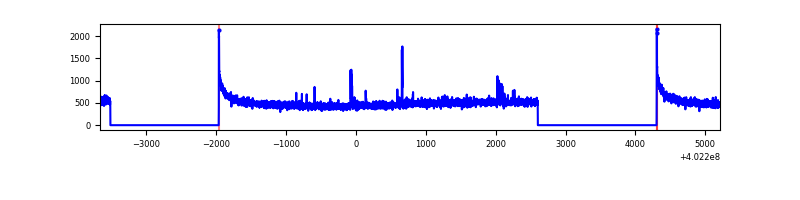 |
| B | 8877 | 5624 | 46 | 46 | 0.52% | 0.82% | 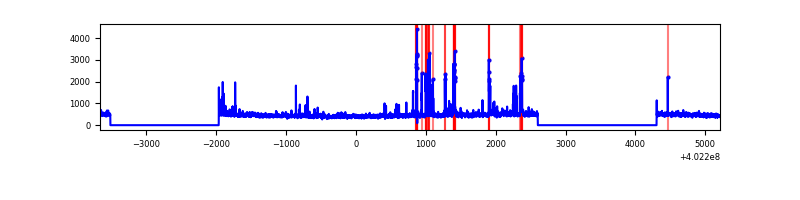 |
| C | 8877 | 5624 | 32 | 32 | 0.36% | 0.57% | 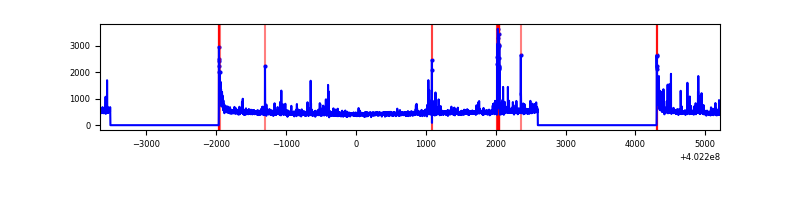 |
| D | 8877 | 5624 | 866 | 866 | 9.76% | 15.40% | 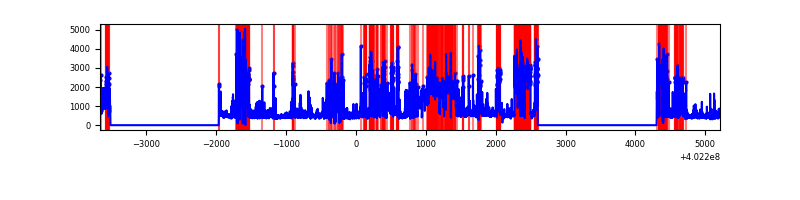 |
Top three noisy pixels from each quadrant. If the there are fewer than three noisy pixels in the level2.evt file, extra rows are filled as -1
| Pixel properties | Quadrant properties | ||||||
|---|---|---|---|---|---|---|---|
| Quadrant | DetID | PixID | Counts | Sigma | Mean | Median | Sigma |
| A | 10 | 83 | 358354 | 2842.52 | 627 | 614 | 125.9 |
| A | 12 | 16 | 17999 | 138.14 | 627 | 614 | 125.9 |
| A | 9 | 143 | 13940 | 105.89 | 627 | 614 | 125.9 |
| B | 5 | 172 | 293643 | 2484.96 | 621 | 605 | 117.9 |
| B | 0 | 189 | 29250 | 242.91 | 621 | 605 | 117.9 |
| B | 0 | 229 | 20069 | 165.05 | 621 | 605 | 117.9 |
| C | 15 | 214 | 235048 | 1665.53 | 603 | 605 | 140.8 |
| C | 14 | 254 | 192755 | 1365.07 | 603 | 605 | 140.8 |
| C | 0 | 10 | 106269 | 750.66 | 603 | 605 | 140.8 |
| D | 1 | 52 | 2631451 | 19860.74 | 535 | 520 | 132.5 |
| D | 12 | 235 | 210996 | 1588.87 | 535 | 520 | 132.5 |
| D | 1 | 47 | 209367 | 1576.57 | 535 | 520 | 132.5 |
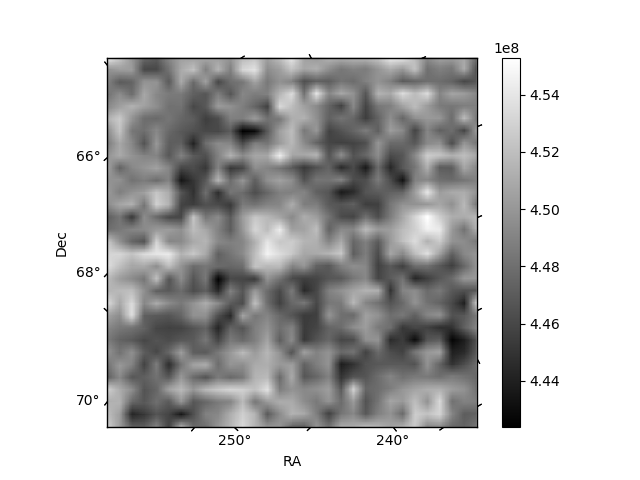
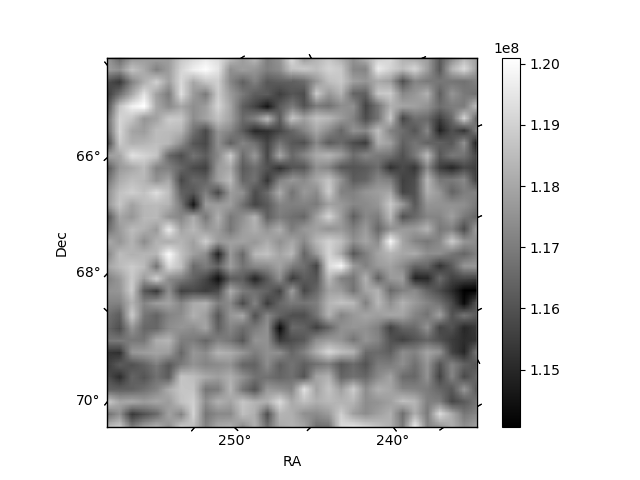
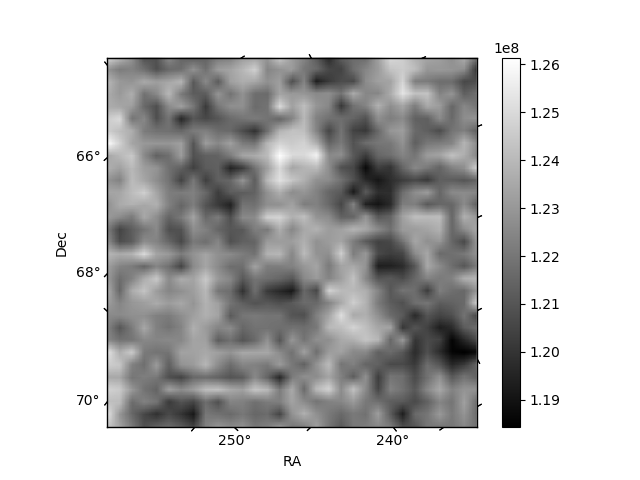
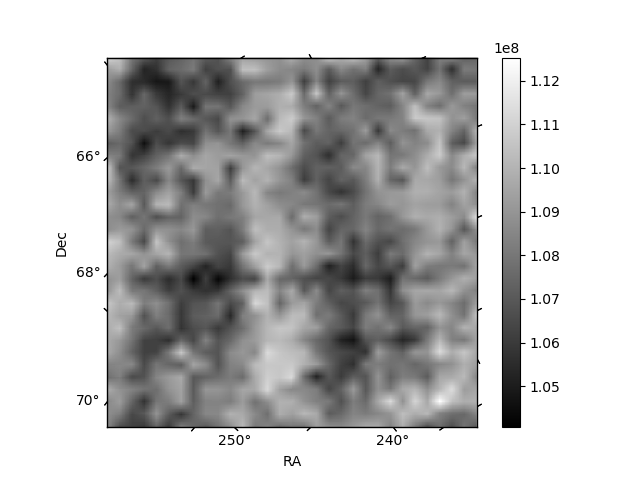
Histogram calculated using DETX and DETY for each event in the final _common_clean file
| Quadrant A | 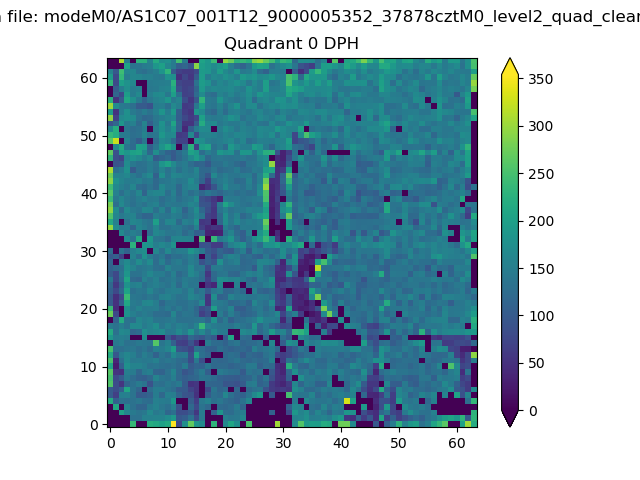 |
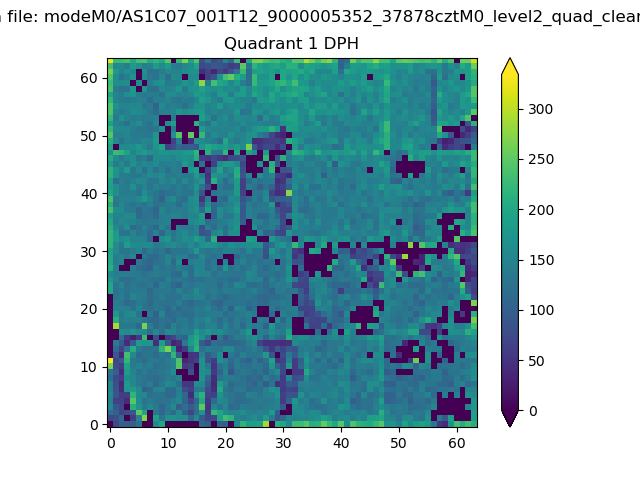 |
Quadrant B |
|---|---|---|---|
| Quadrant D | 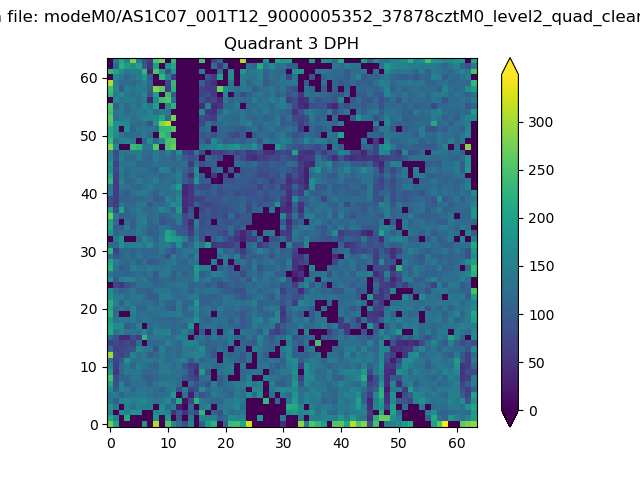 |
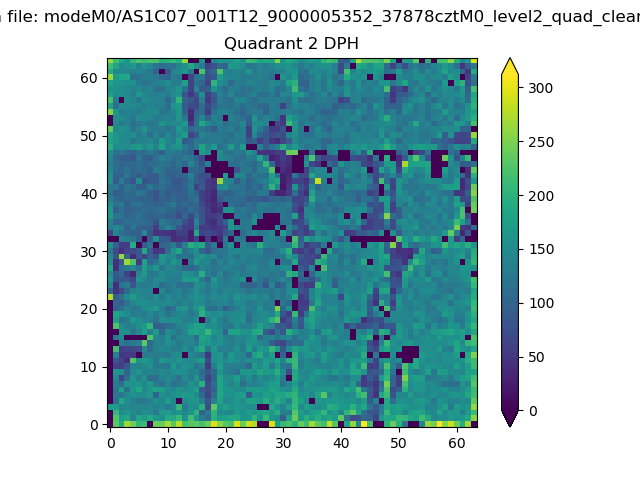 |
Quadrant C |
| Plot type | Count rate plots | Images |
|---|---|---|
| Comparison with Poisson distribution Blue bars denote a histogram of data divided into 1 sec bins. Red curve is a Poisson curve with rate = median count rate of data. |
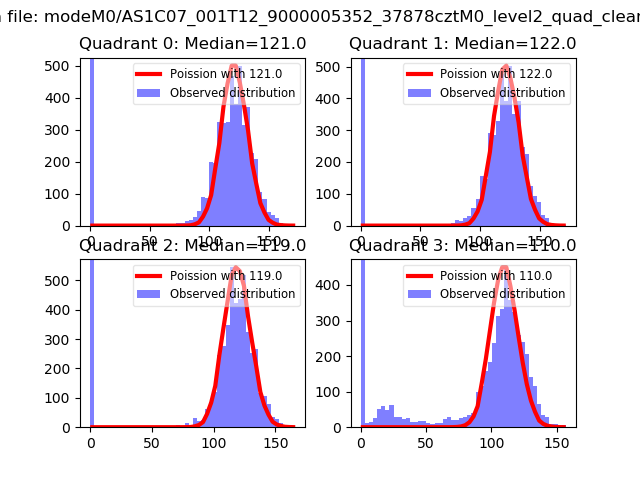 |
 |
| Quadrant-wise count rates Data is divided into 100 sec bins |
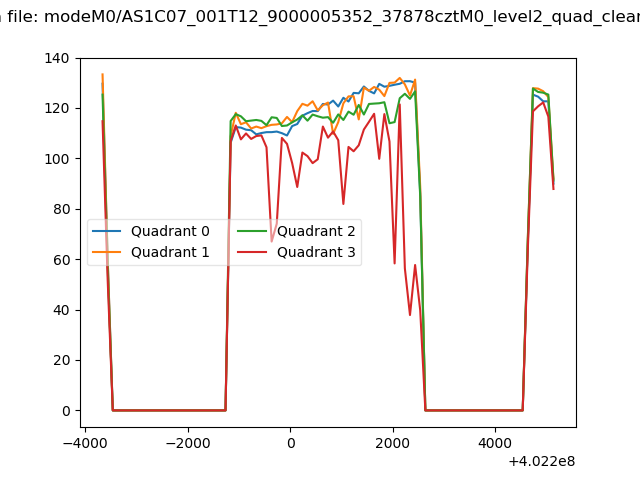 |
|
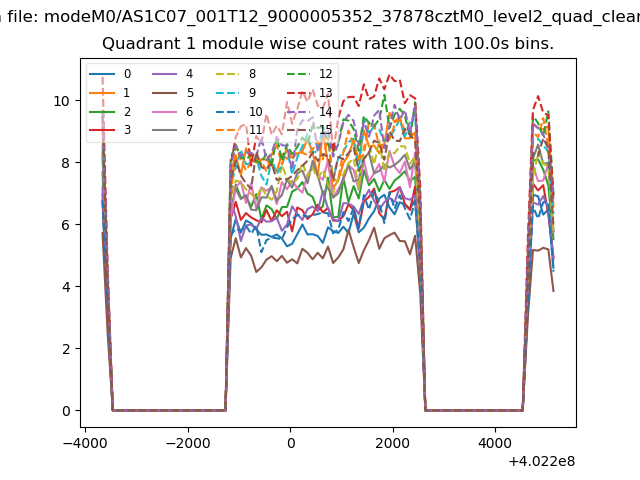
| Module-wise count rates for Quadrant A Data is divided into 100 sec bins |
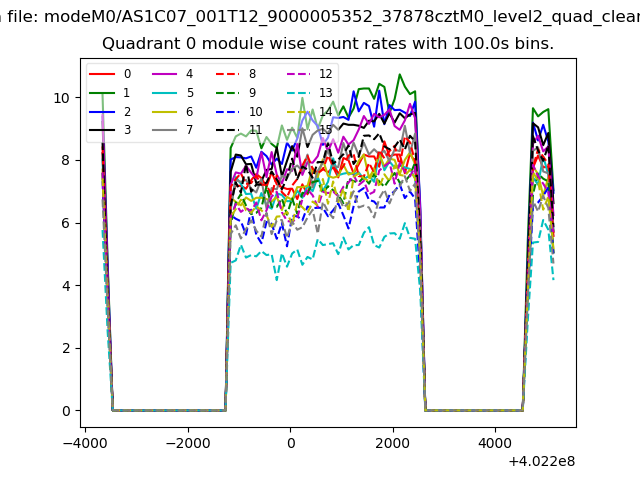 |
 |
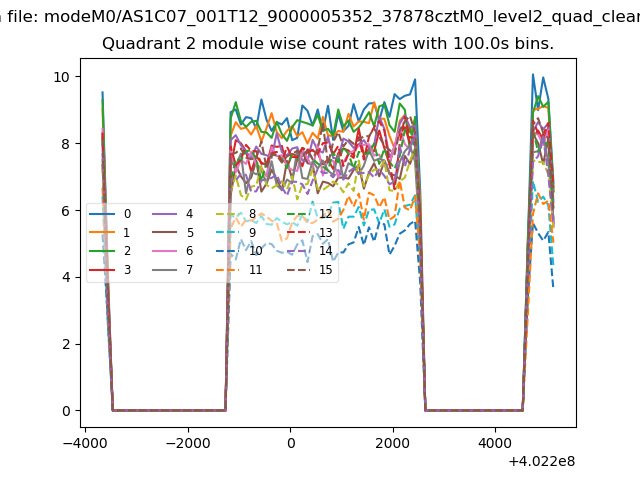
| Module-wise count rates for Quadrant B Data is divided into 100 sec bins |
 |
 |
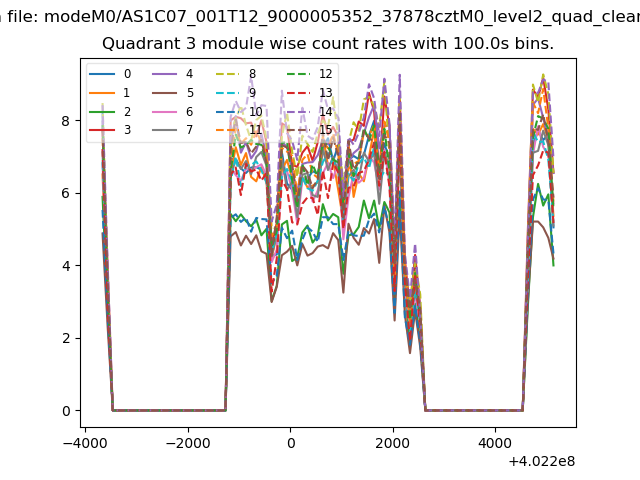
| Module-wise count rates for Quadrant C Data is divided into 100 sec bins |
 |
 |
| Module-wise count rates for Quadrant D Data is divided into 100 sec bins |
 |
 |
| Parameter | Plot |
|---|---|
| CZT HV Monitor | 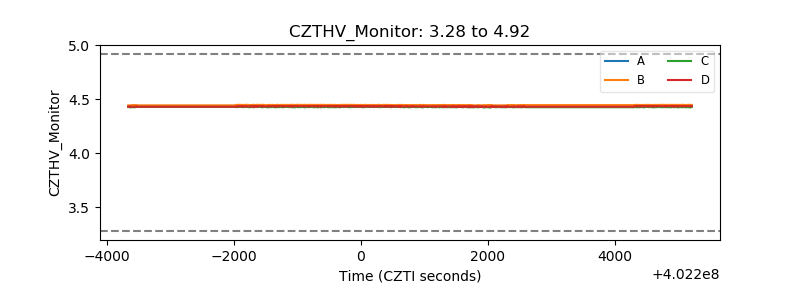 |
| D_VDD | 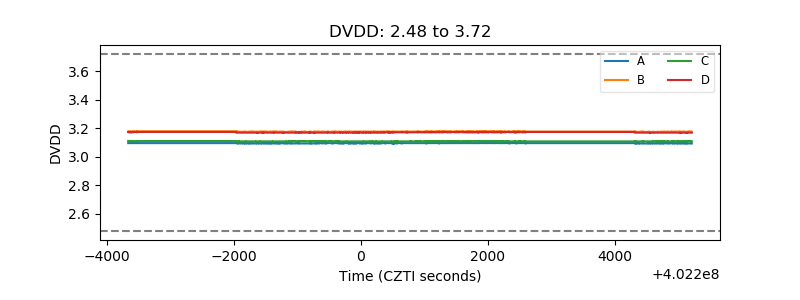 |
| Temperature 1 | 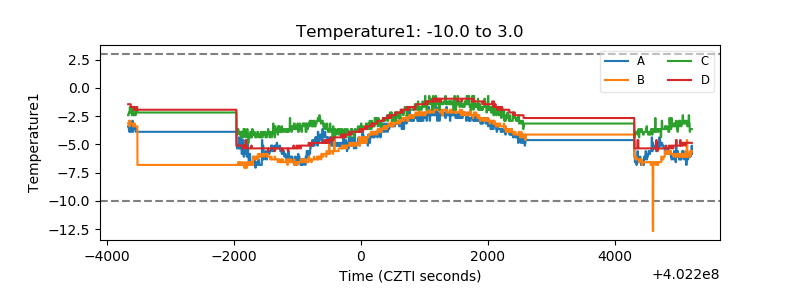 |
| Veto HV Monitor | 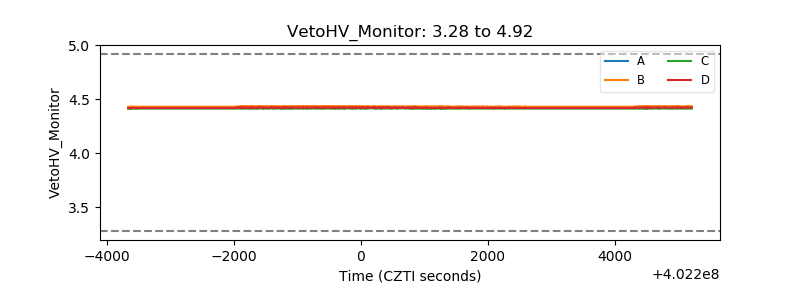 |
| Veto LLD | 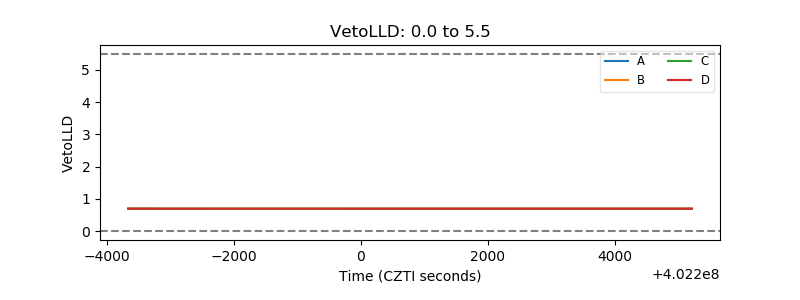 |
| Alpha Counter | 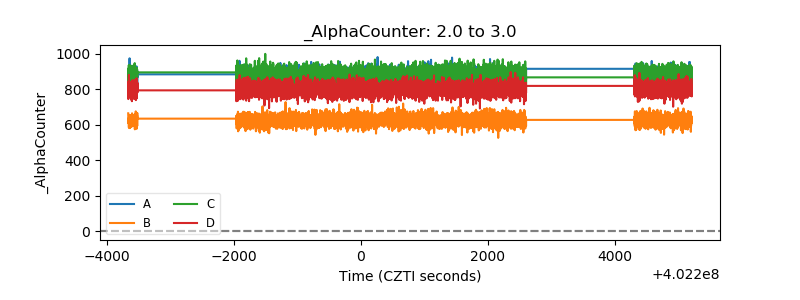 |
| _CPM_Rate | 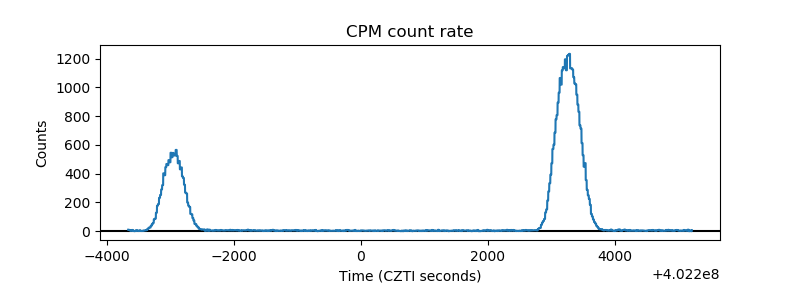 |
| CZT Counter | 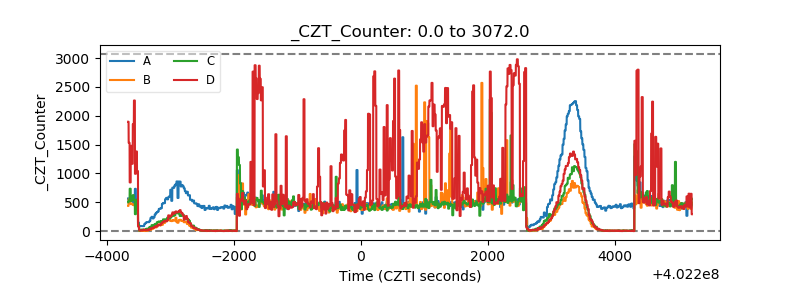 |
| +2.5 Volts monitor | 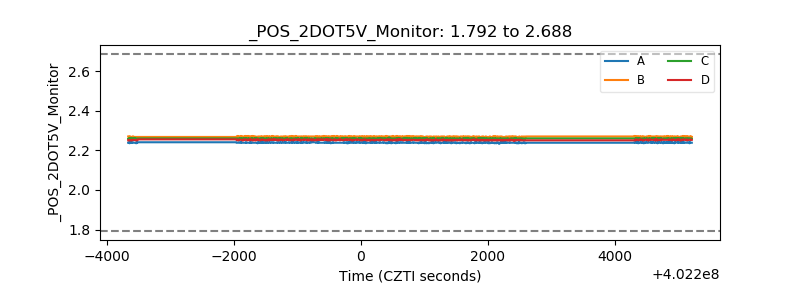 |
| +5 Volts monitor | 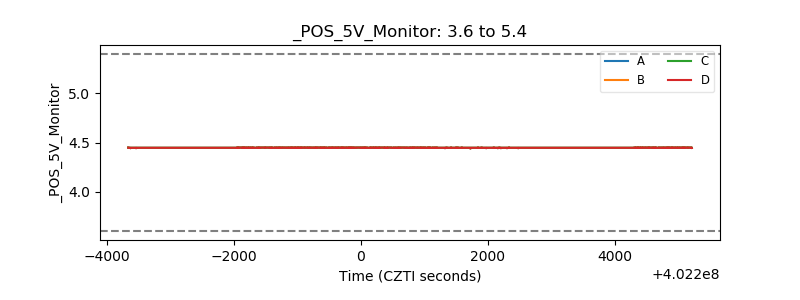 |
| _ROLL_ROT | 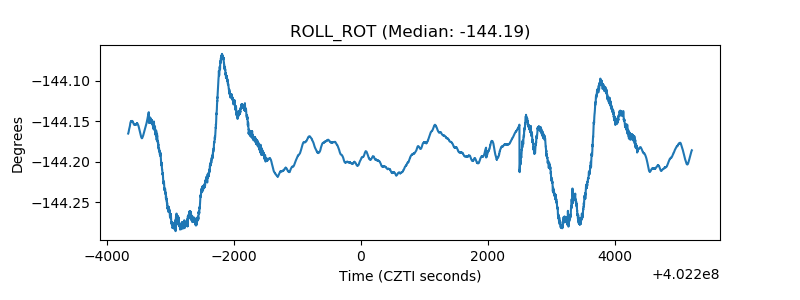 |
| _Roll_DEC | 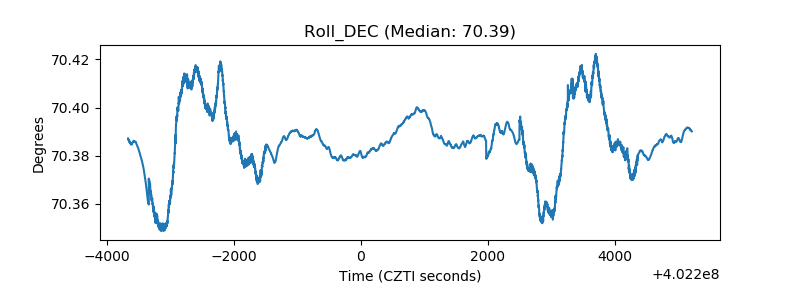 |
| _Roll_RA | 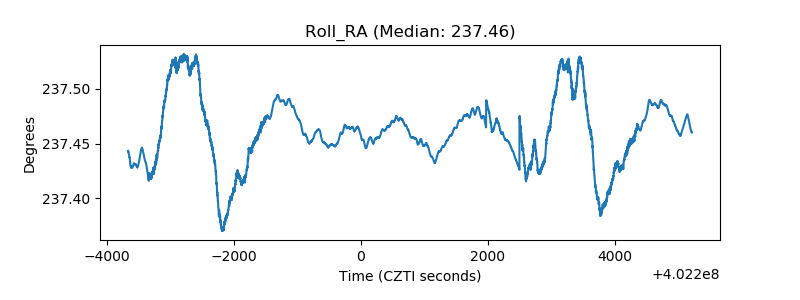 |
| Veto Counter | 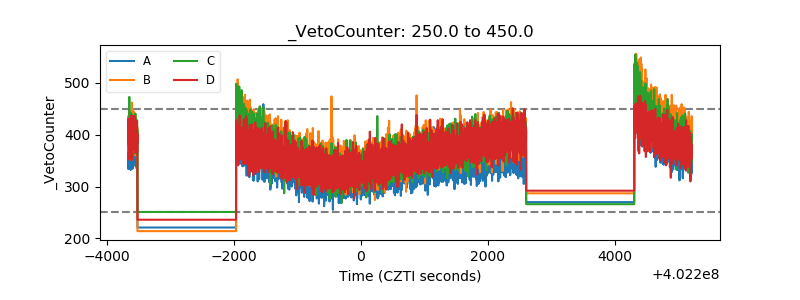 |