| Param | Original file | Final file |
|---|---|---|
| Filename | modeM0/AS1C07_001T12_9000005352_37880cztM0_level2.evt | modeM0/AS1C07_001T12_9000005352_37880cztM0_level2_quad_clean.evt |
| Size (bytes) | 400,835,520 | 92,355,840 |
| Size | 382.3 MB | 88.1 MB |
| Events in quadrant A | 2,694,069 | 618,592 |
| Events in quadrant B | 2,967,543 | 620,729 |
| Events in quadrant C | 2,635,105 | 608,415 |
| Events in quadrant D | 3,484,407 | 580,213 |
| Mode M9 | |||
|---|---|---|---|
| Quadrant | BADHDUFLAG | Total packets | Discarded packets |
| A | 0 | 23 | 0 |
| B | 0 | 23 | 0 |
| C | 0 | 23 | 0 |
| D | 0 | 24 | 0 |
| Mode M0 | |||
|---|---|---|---|
| Quadrant | BADHDUFLAG | Total packets | Discarded packets |
| A | 0 | 11252 | 3 |
| B | 0 | 12307 | 2 |
| C | 0 | 11135 | 2 |
| D | 0 | 13925 | 2 |
| Mode SS | |||
|---|---|---|---|
| Quadrant | BADHDUFLAG | Total packets | Discarded packets |
| A | 0 | 108 | 0 |
| B | 0 | 108 | 0 |
| C | 0 | 108 | 0 |
| D | 0 | 108 | 0 |
| Quadrant | Total seconds | Saturated seconds | Saturation percentage |
|---|---|---|---|
| A | 5267 | 15 | 0.284792% |
| B | 5267 | 110 | 2.088475% |
| C | 5267 | 16 | 0.303778% |
| D | 5267 | 163 | 3.094741% |
Noise dominated data is calculated using 1-second bins in cleaned event files. If a bin has >2000 counts, and if more than 50% of those come from <1% of pixels, then it is considered to be noise-dominated and hence unusable.
| Quadrant | # 1 sec bins | Bins with >0 counts | Bins with >2000 counts | High rate bins dominated by noise | Noise dominated (total time) | Noise dominated (detector-on time) | Marked lightcurve |
|---|---|---|---|---|---|---|---|
| A | 7059 | 5268 | 6 | 6 | 0.08% | 0.11% | 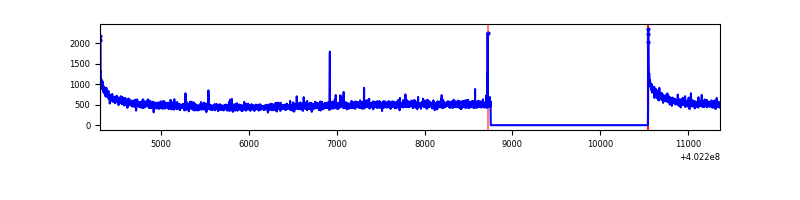 |
| B | 7059 | 5268 | 76 | 76 | 1.08% | 1.44% | 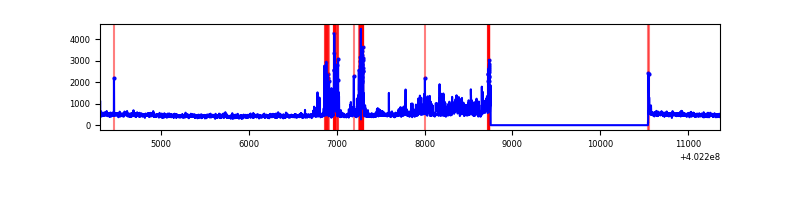 |
| C | 7059 | 5268 | 10 | 10 | 0.14% | 0.19% | 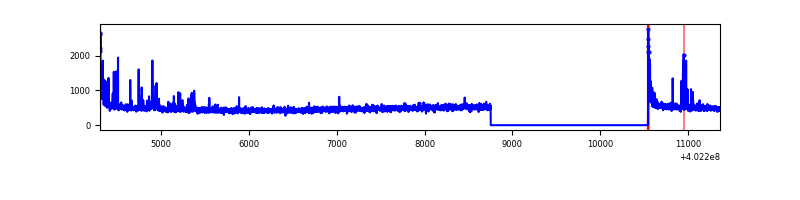 |
| D | 7059 | 5268 | 143 | 143 | 2.03% | 2.71% | 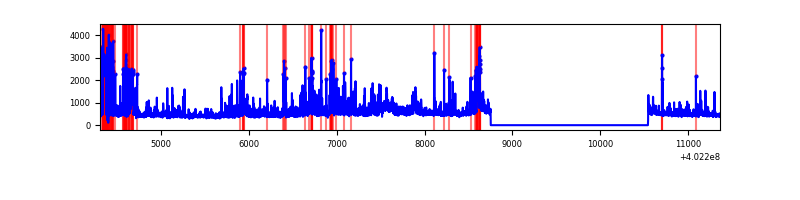 |
Top three noisy pixels from each quadrant. If the there are fewer than three noisy pixels in the level2.evt file, extra rows are filled as -1
| Pixel properties | Quadrant properties | ||||||
|---|---|---|---|---|---|---|---|
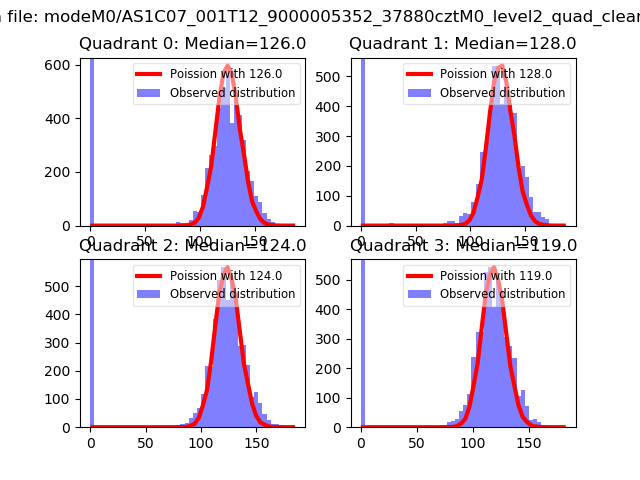
| Quadrant | DetID | PixID | Counts | Sigma | Mean | Median | Sigma |
| A | 10 | 83 | 338263 | 2777.75 | 600 | 587 | 121.6 |
| A | 12 | 189 | 8234 | 62.9 | 600 | 587 | 121.6 |
| A | 13 | 6 | 7044 | 53.12 | 600 | 587 | 121.6 |
| B | 5 | 172 | 312545 | 2808.5 | 589 | 574 | 111.1 |
| B | 0 | 213 | 261845 | 2352.08 | 589 | 574 | 111.1 |
| B | 0 | 230 | 24832 | 218.38 | 589 | 574 | 111.1 |
| C | 15 | 214 | 221478 | 1649.89 | 575 | 578 | 133.9 |
| C | 0 | 10 | 89707 | 665.7 | 575 | 578 | 133.9 |
| C | 14 | 254 | 62766 | 464.48 | 575 | 578 | 133.9 |
| D | 1 | 52 | 679225 | 4906.64 | 571 | 554 | 138.3 |
| D | 12 | 235 | 136170 | 980.47 | 571 | 554 | 138.3 |
| D | 1 | 47 | 113305 | 815.16 | 571 | 554 | 138.3 |
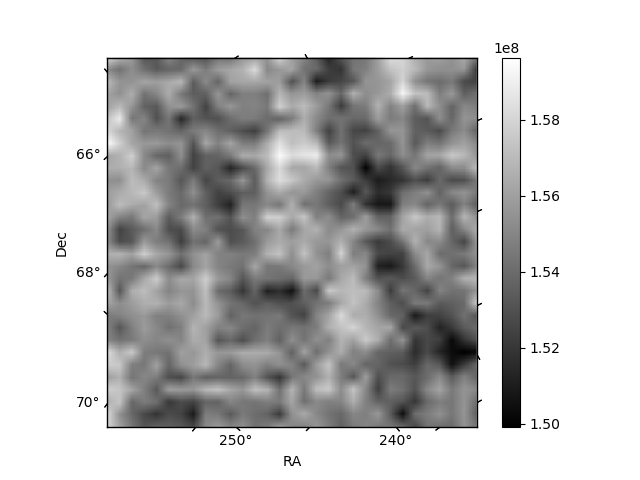
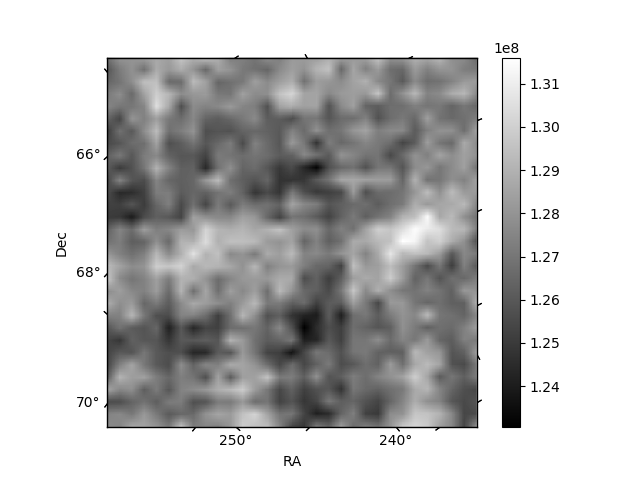
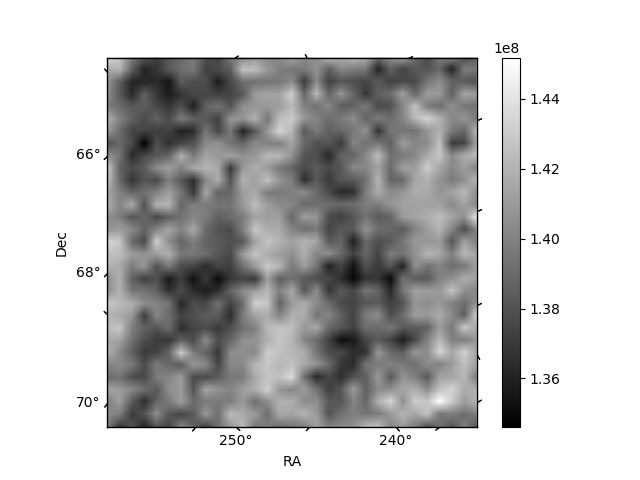
Histogram calculated using DETX and DETY for each event in the final _common_clean file
| Quadrant A | 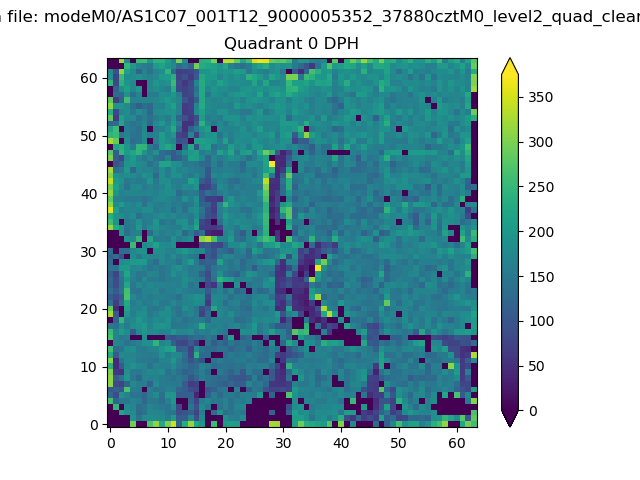 |
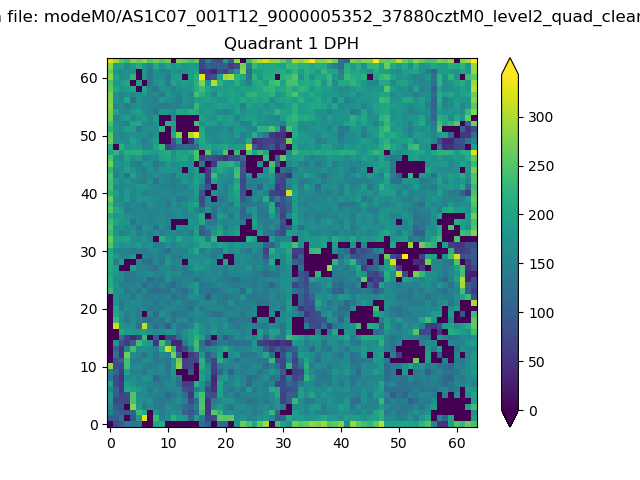 |
Quadrant B |
|---|---|---|---|
| Quadrant D | 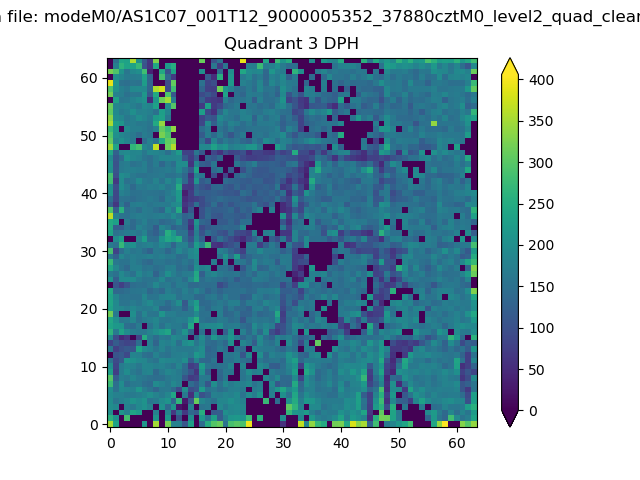 |
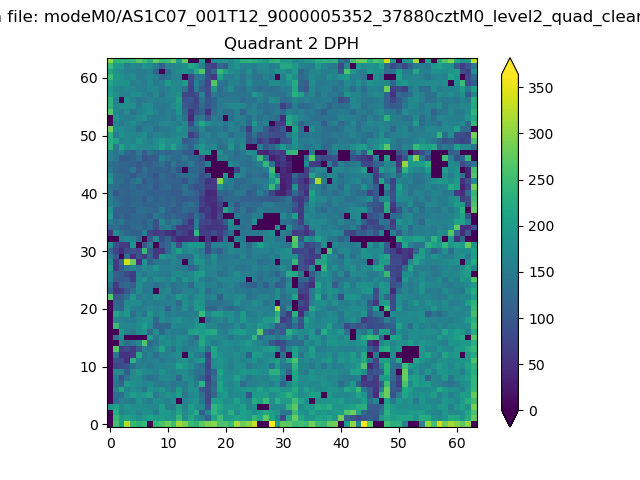 |
Quadrant C |
| Plot type | Count rate plots | Images |
|---|---|---|
| Comparison with Poisson distribution Blue bars denote a histogram of data divided into 1 sec bins. Red curve is a Poisson curve with rate = median count rate of data. |
 |
 |
| Quadrant-wise count rates Data is divided into 100 sec bins |
 |
|
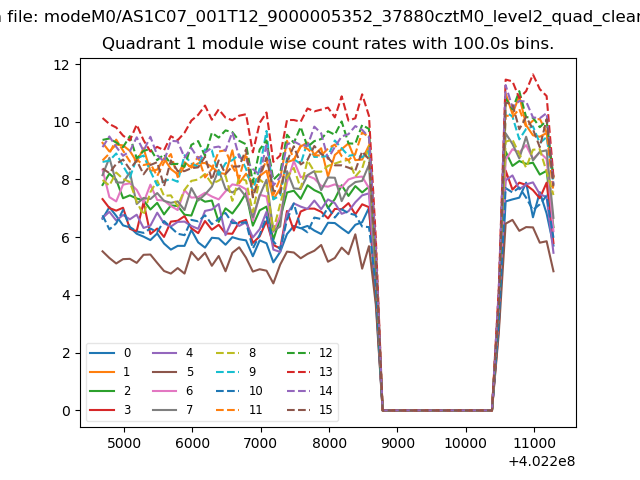
| Module-wise count rates for Quadrant A Data is divided into 100 sec bins |
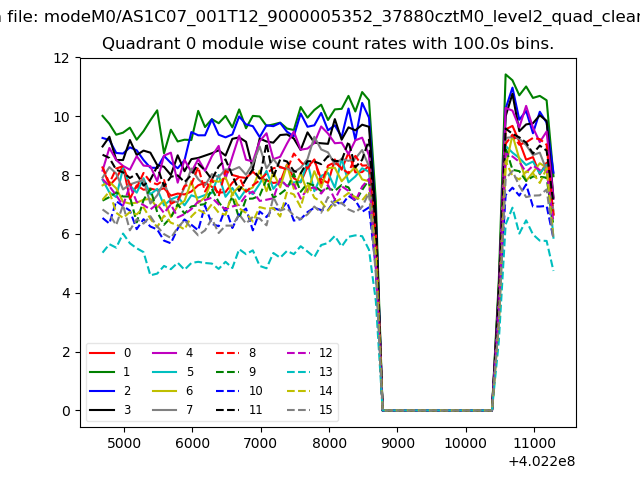 |
 |
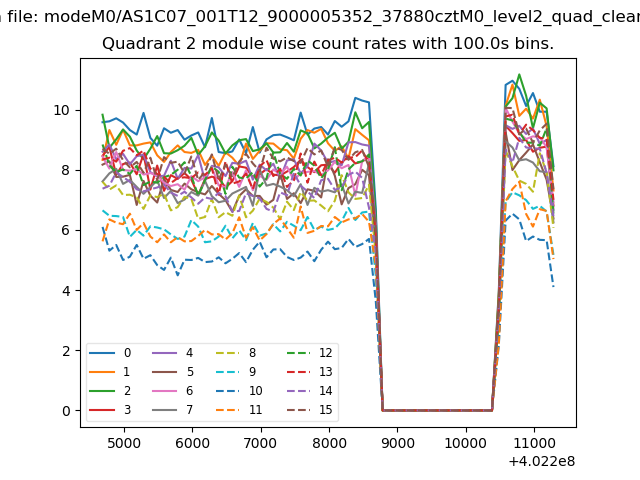
| Module-wise count rates for Quadrant B Data is divided into 100 sec bins |
 |
 |
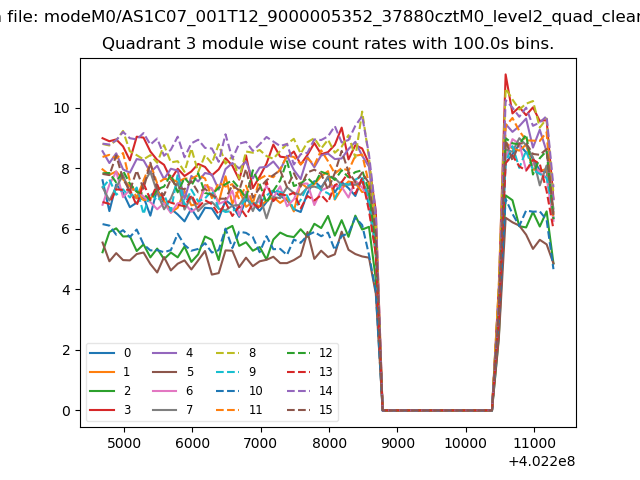
| Module-wise count rates for Quadrant C Data is divided into 100 sec bins |
 |
 |
| Module-wise count rates for Quadrant D Data is divided into 100 sec bins |
 |
 |
| Parameter | Plot |
|---|---|
| CZT HV Monitor | 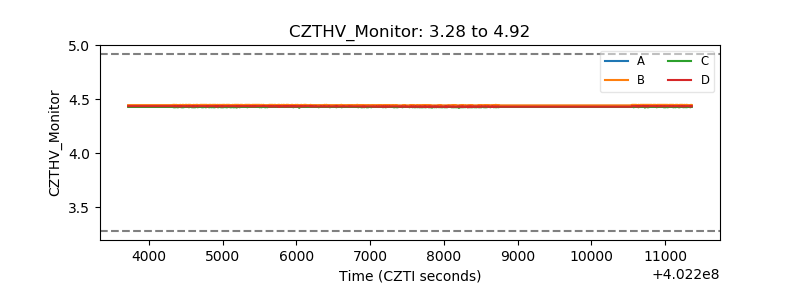 |
| D_VDD | 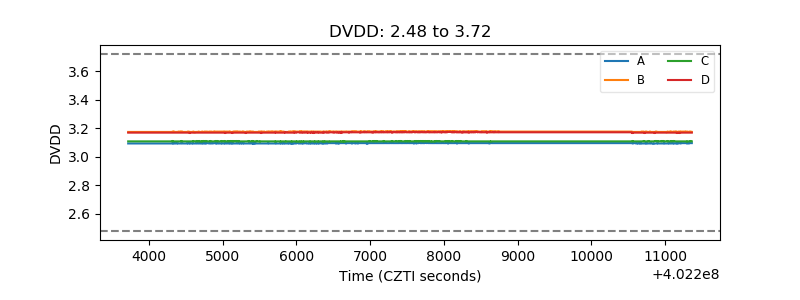 |
| Temperature 1 | 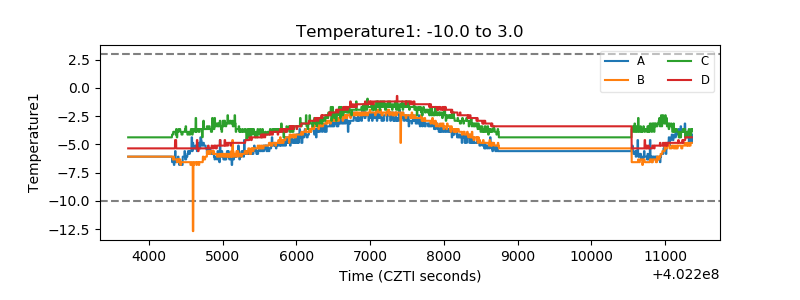 |
| Veto HV Monitor | 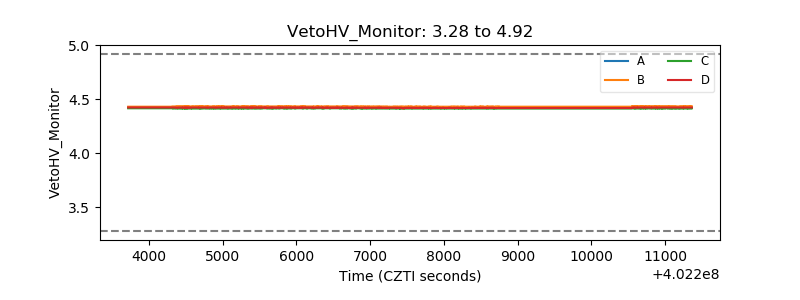 |
| Veto LLD | 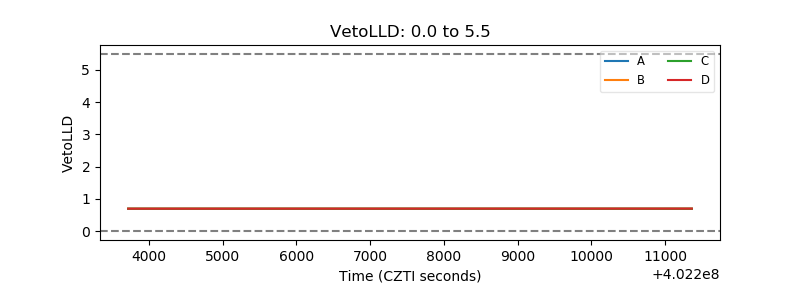 |
| Alpha Counter | 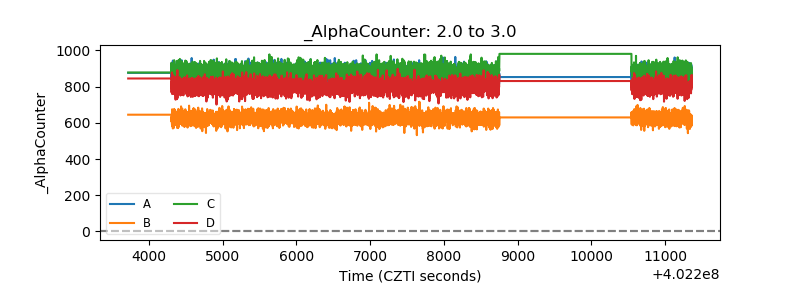 |
| _CPM_Rate |  |
| CZT Counter | 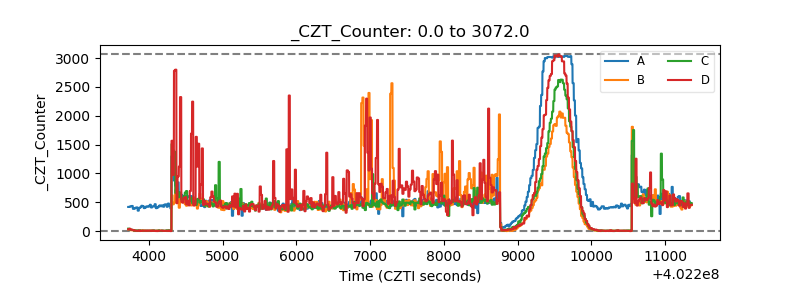 |
| +2.5 Volts monitor | 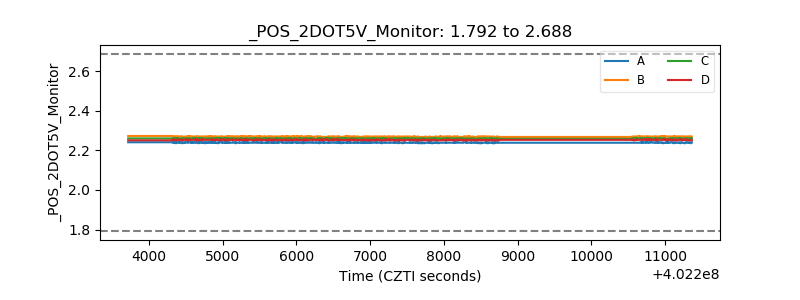 |
| +5 Volts monitor | 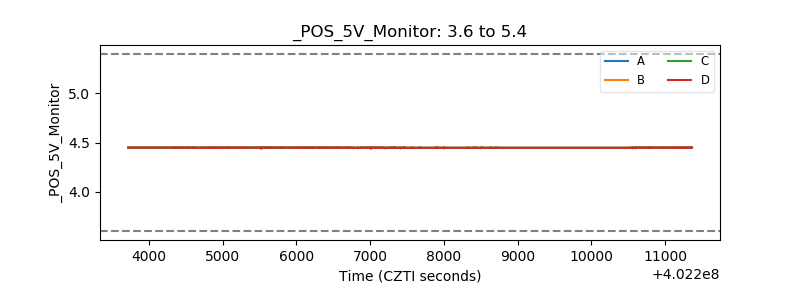 |
| _ROLL_ROT | 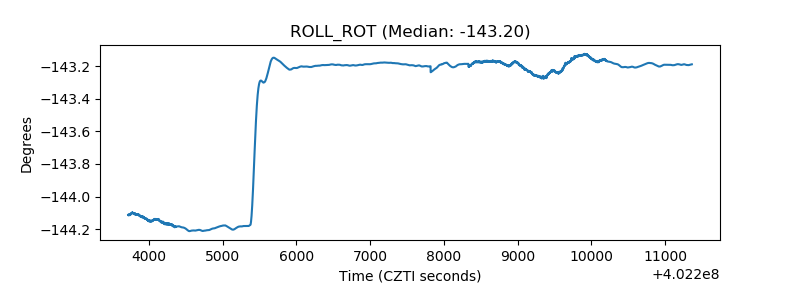 |
| _Roll_DEC | 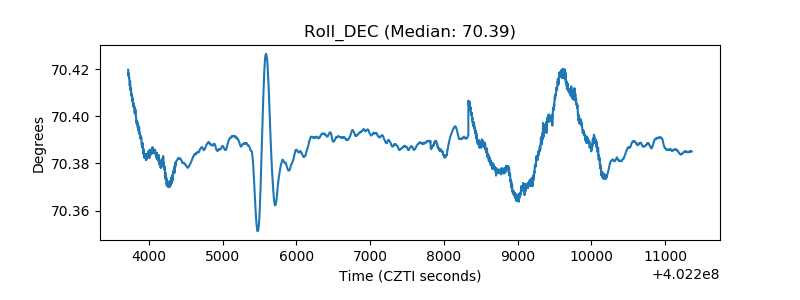 |
| _Roll_RA | 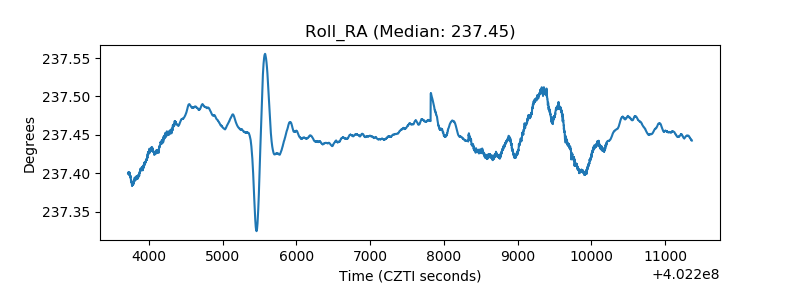 |
| Veto Counter | 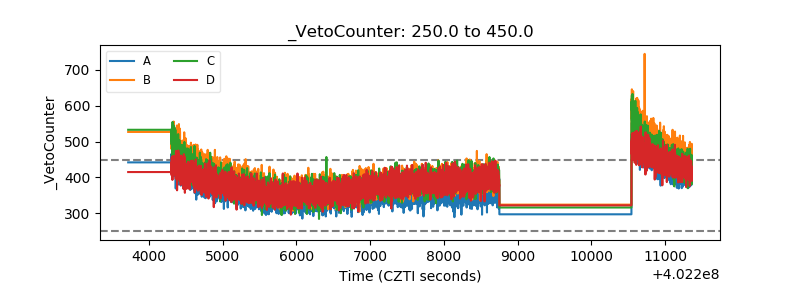 |