| Param | Original file | Final file |
|---|---|---|
| Filename | modeM0/AS1C07_001T12_9000005352_37881cztM0_level2.evt | modeM0/AS1C07_001T12_9000005352_37881cztM0_level2_quad_clean.evt |
| Size (bytes) | 374,016,960 | 99,786,240 |
| Size | 356.7 MB | 95.2 MB |
| Events in quadrant A | 2,652,049 | 684,321 |
| Events in quadrant B | 2,680,805 | 691,400 |
| Events in quadrant C | 2,557,845 | 658,545 |
| Events in quadrant D | 3,092,247 | 633,306 |
| Mode M9 | |||
|---|---|---|---|
| Quadrant | BADHDUFLAG | Total packets | Discarded packets |
| A | 0 | 19 | 0 |
| B | 0 | 19 | 0 |
| C | 0 | 19 | 0 |
| D | 0 | 19 | 0 |
| Mode M0 | |||
|---|---|---|---|
| Quadrant | BADHDUFLAG | Total packets | Discarded packets |
| A | 0 | 10853 | 3 |
| B | 0 | 11200 | 2 |
| C | 0 | 10617 | 2 |
| D | 0 | 12448 | 2 |
| Mode SS | |||
|---|---|---|---|
| Quadrant | BADHDUFLAG | Total packets | Discarded packets |
| A | 0 | 104 | 0 |
| B | 0 | 104 | 0 |
| C | 0 | 104 | 0 |
| D | 0 | 104 | 0 |
| Quadrant | Total seconds | Saturated seconds | Saturation percentage |
|---|---|---|---|
| A | 5056 | 6 | 0.118671% |
| B | 5056 | 68 | 1.344937% |
| C | 5056 | 16 | 0.316456% |
| D | 5056 | 74 | 1.463608% |
Noise dominated data is calculated using 1-second bins in cleaned event files. If a bin has >2000 counts, and if more than 50% of those come from <1% of pixels, then it is considered to be noise-dominated and hence unusable.
| Quadrant | # 1 sec bins | Bins with >0 counts | Bins with >2000 counts | High rate bins dominated by noise | Noise dominated (total time) | Noise dominated (detector-on time) | Marked lightcurve |
|---|---|---|---|---|---|---|---|
| A | 6999 | 5057 | 2 | 2 | 0.03% | 0.04% | 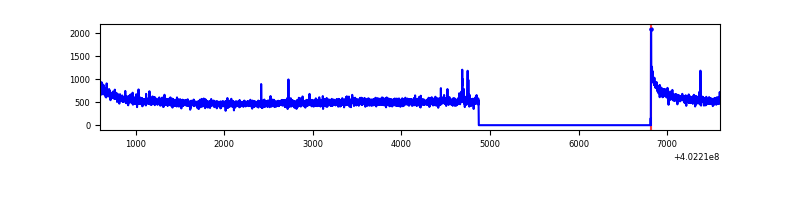 |
| B | 6999 | 5057 | 41 | 41 | 0.59% | 0.81% | 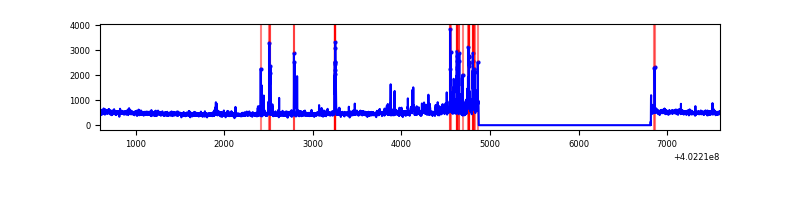 |
| C | 6999 | 5056 | 10 | 10 | 0.14% | 0.20% | 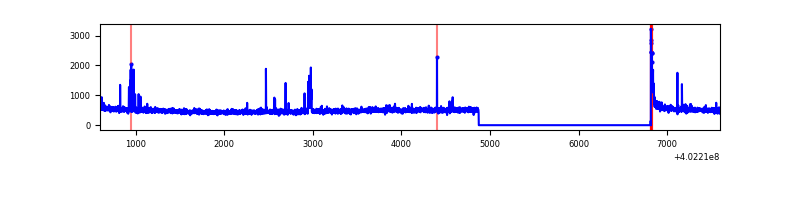 |
| D | 6999 | 5056 | 53 | 53 | 0.76% | 1.05% |  |
Top three noisy pixels from each quadrant. If the there are fewer than three noisy pixels in the level2.evt file, extra rows are filled as -1
| Pixel properties | Quadrant properties | ||||||
|---|---|---|---|---|---|---|---|
| Quadrant | DetID | PixID | Counts | Sigma | Mean | Median | Sigma |
| A | 10 | 83 | 313528 | 2619.9 | 597 | 588 | 119.4 |
| A | 9 | 143 | 15332 | 123.44 | 597 | 588 | 119.4 |
| A | 12 | 189 | 8540 | 66.57 | 597 | 588 | 119.4 |
| B | 5 | 172 | 232346 | 2110.12 | 586 | 573 | 109.8 |
| B | 0 | 213 | 110744 | 1003.03 | 586 | 573 | 109.8 |
| B | 12 | 111 | 13310 | 115.96 | 586 | 573 | 109.8 |
| C | 15 | 214 | 214539 | 1649.81 | 565 | 568 | 129.7 |
| C | 0 | 10 | 63814 | 487.66 | 565 | 568 | 129.7 |
| C | 12 | 249 | 40409 | 307.19 | 565 | 568 | 129.7 |
| D | 1 | 52 | 234693 | 1700.67 | 571 | 555 | 137.7 |
| D | 1 | 47 | 168684 | 1221.21 | 571 | 555 | 137.7 |
| D | 2 | 250 | 131283 | 949.55 | 571 | 555 | 137.7 |
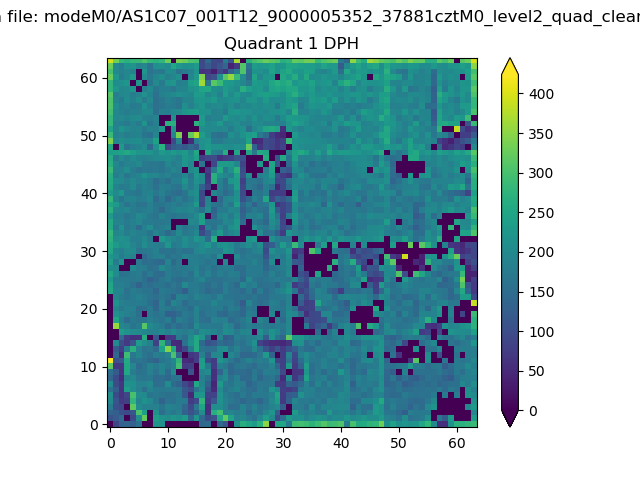
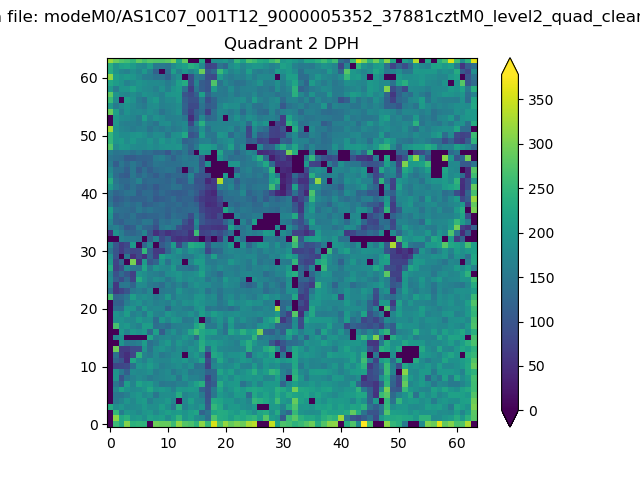
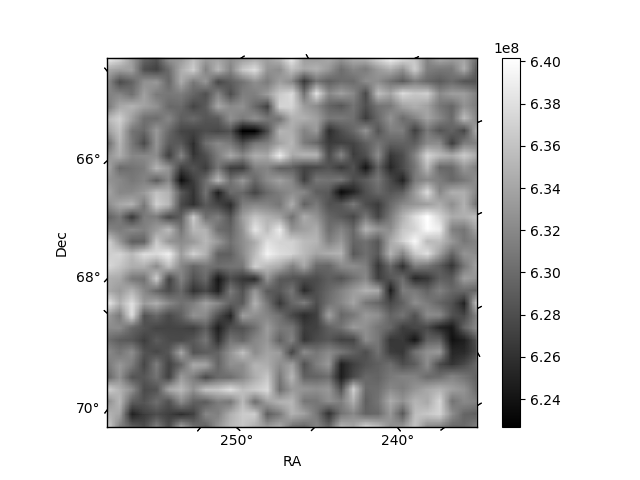
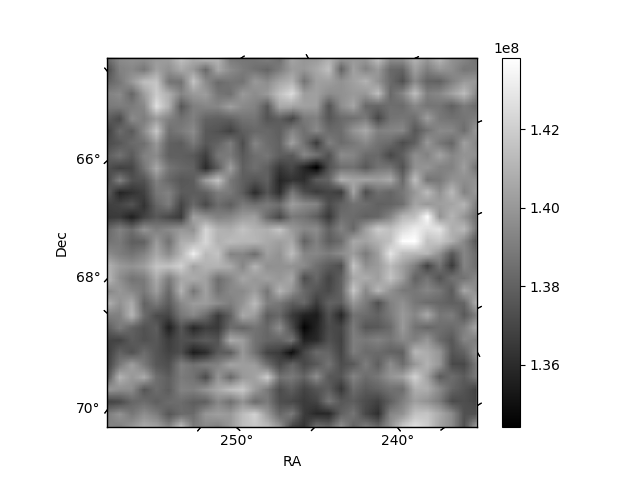
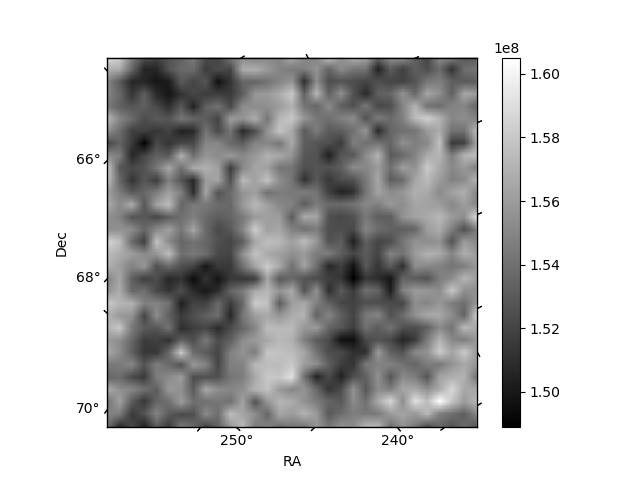
Histogram calculated using DETX and DETY for each event in the final _common_clean file
| Quadrant A | 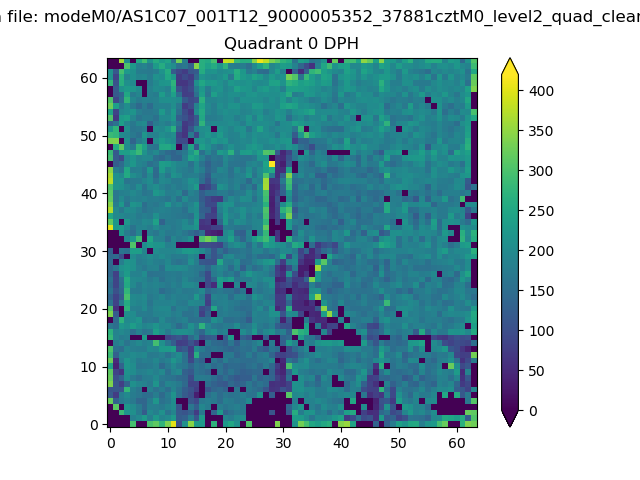 |
 |
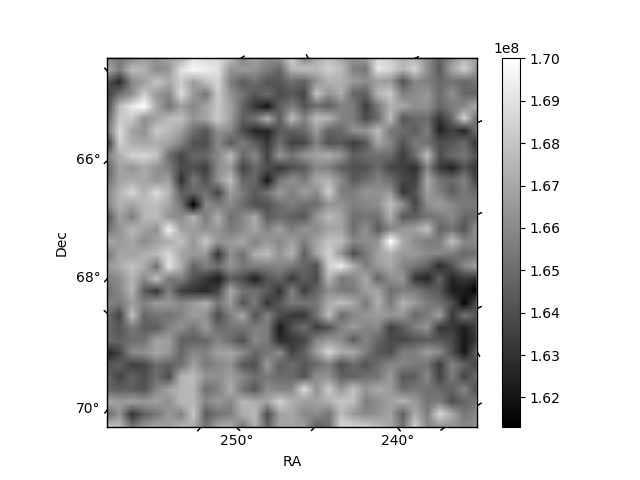
Quadrant B |
|---|---|---|---|
| Quadrant D | 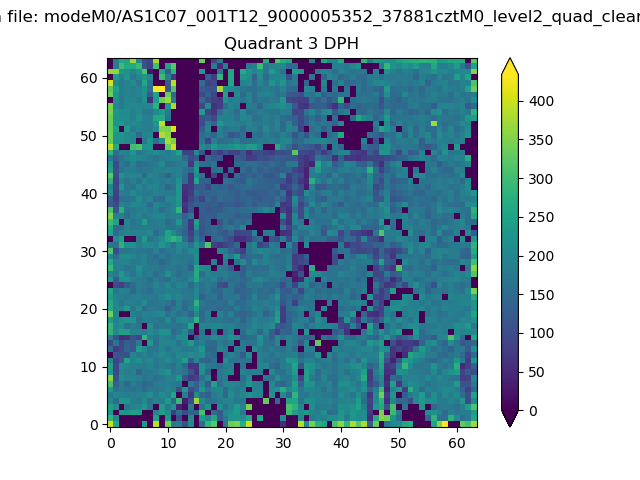 |
 |
Quadrant C |
| Plot type | Count rate plots | Images |
|---|---|---|
| Comparison with Poisson distribution Blue bars denote a histogram of data divided into 1 sec bins. Red curve is a Poisson curve with rate = median count rate of data. |
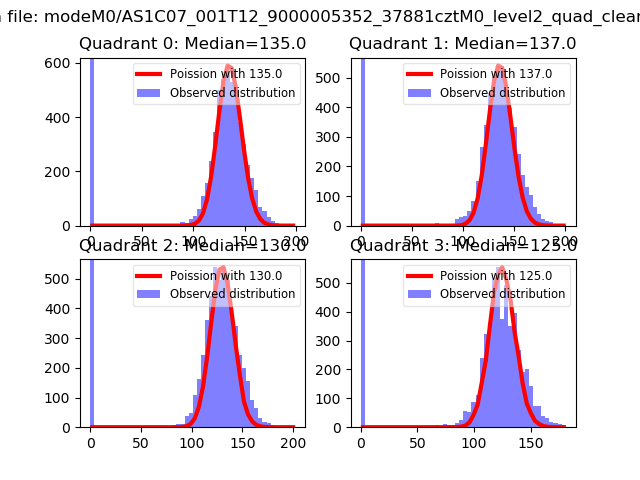 |
 |
| Quadrant-wise count rates Data is divided into 100 sec bins |
 |
|
| Module-wise count rates for Quadrant A Data is divided into 100 sec bins |
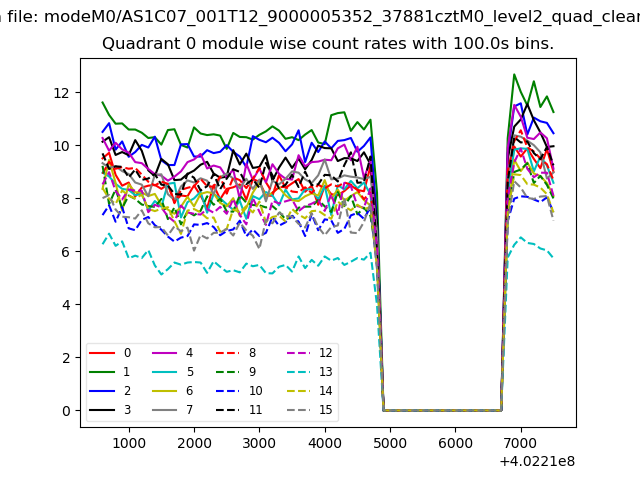 |
 |
| Module-wise count rates for Quadrant B Data is divided into 100 sec bins |
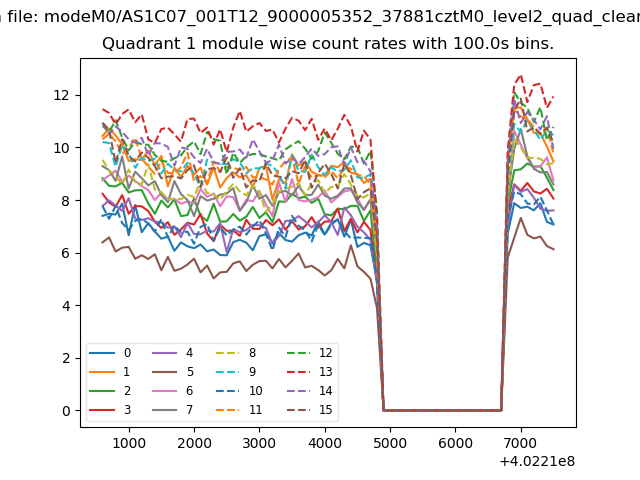 |
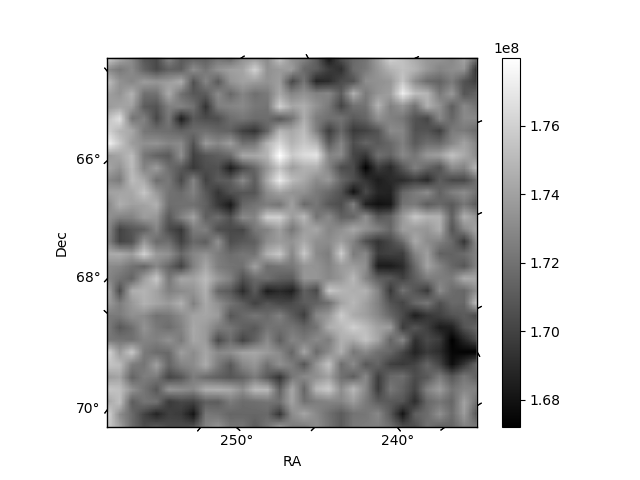 |
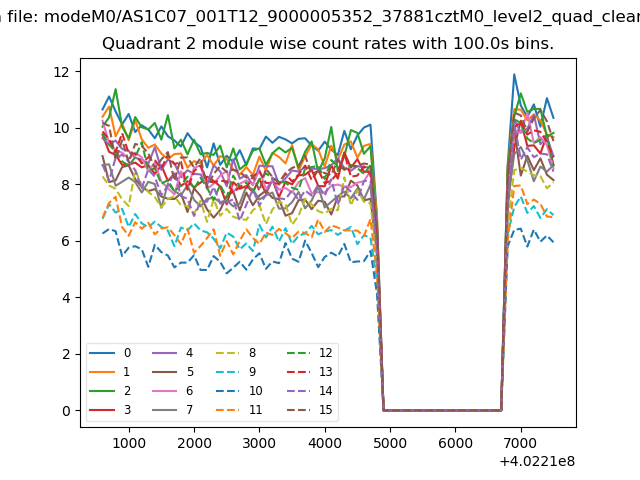
| Module-wise count rates for Quadrant C Data is divided into 100 sec bins |
 |
 |
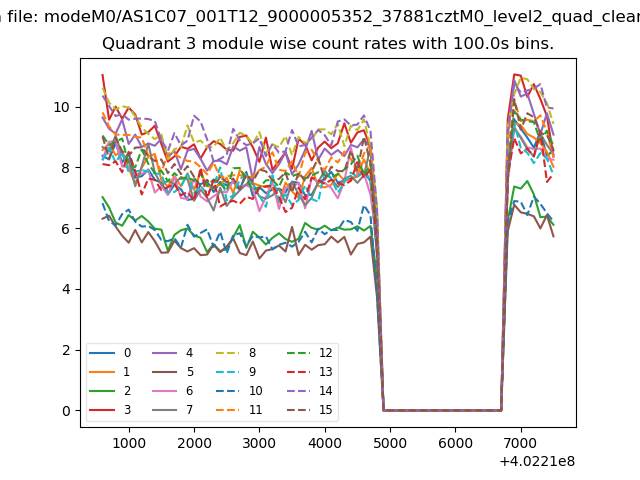
| Module-wise count rates for Quadrant D Data is divided into 100 sec bins |
 |
 |
| Parameter | Plot |
|---|---|
| CZT HV Monitor | 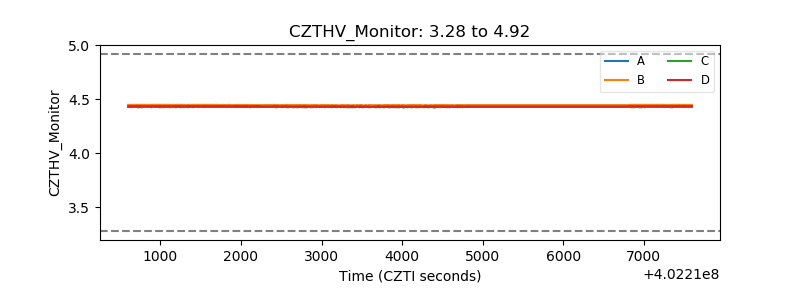 |
| D_VDD | 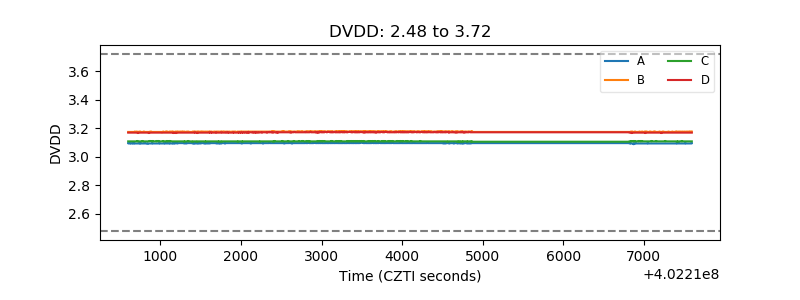 |
| Temperature 1 | 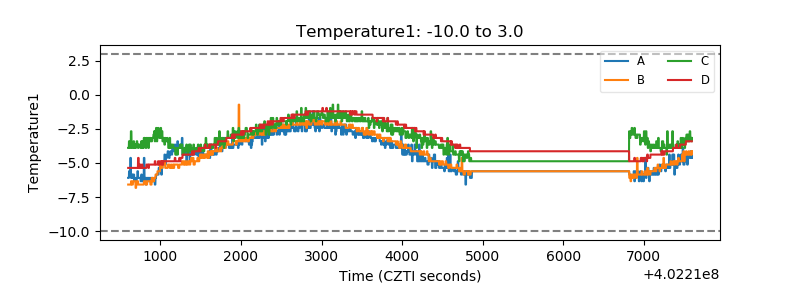 |
| Veto HV Monitor | 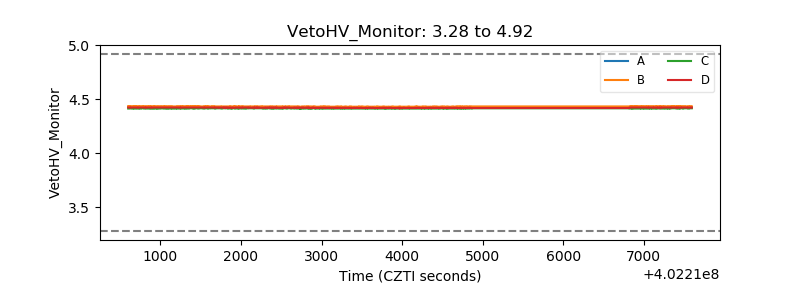 |
| Veto LLD | 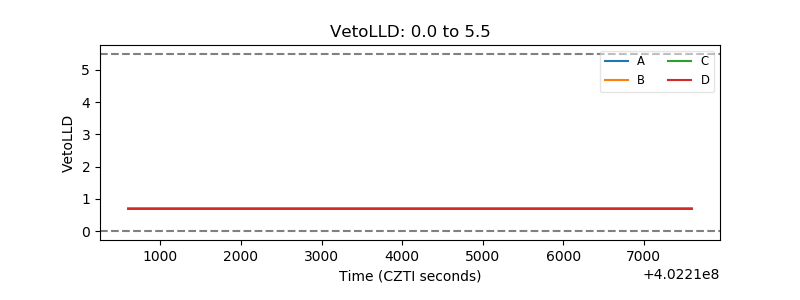 |
| Alpha Counter | 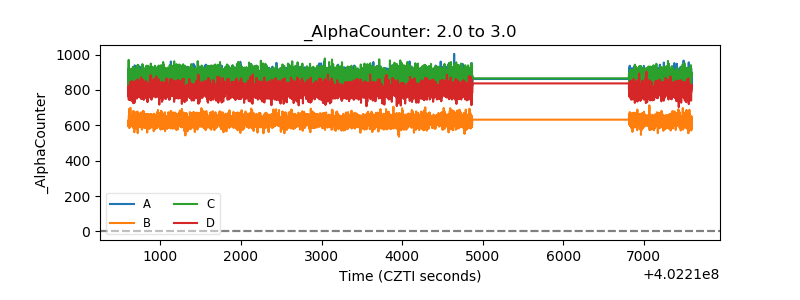 |
| _CPM_Rate | 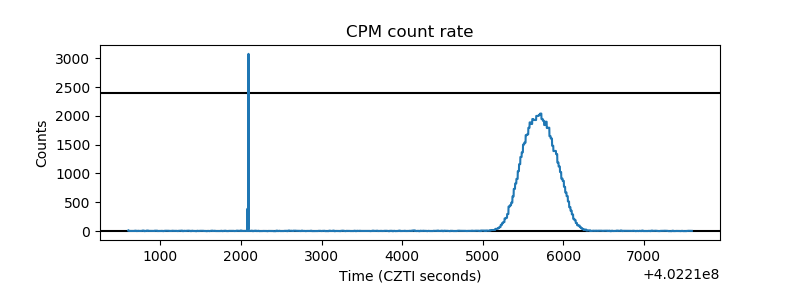 |
| CZT Counter | 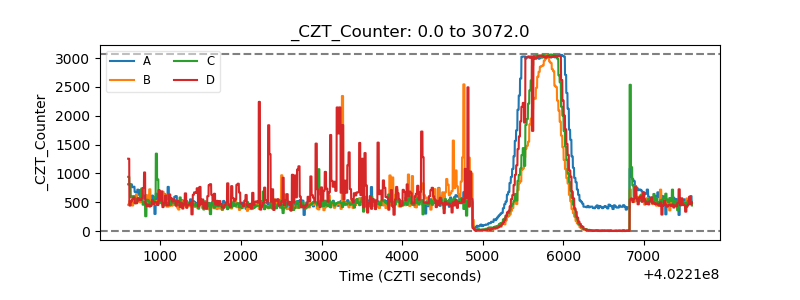 |
| +2.5 Volts monitor | 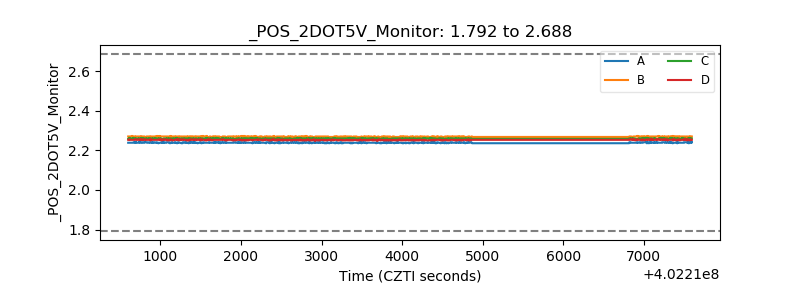 |
| +5 Volts monitor | 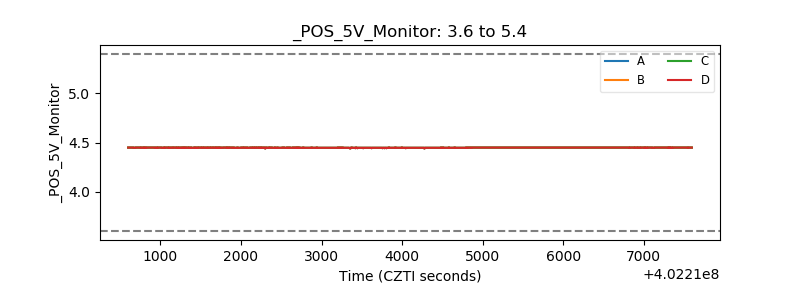 |
| _ROLL_ROT | 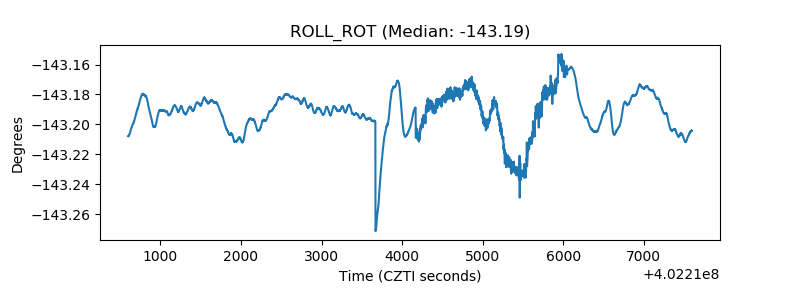 |
| _Roll_DEC | 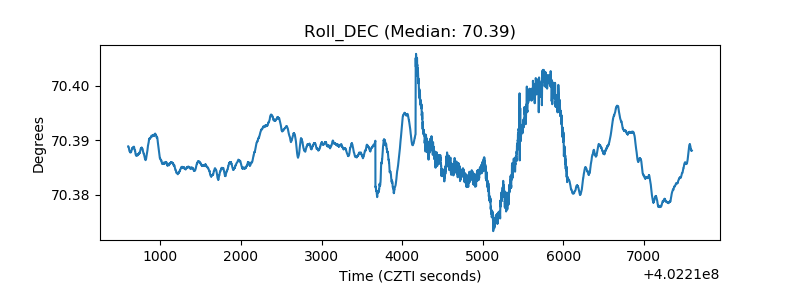 |
| _Roll_RA | 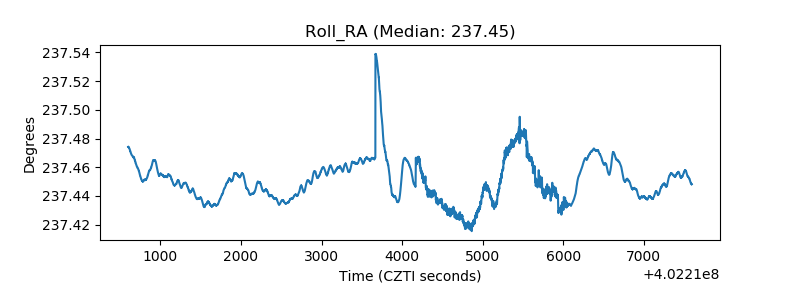 |
| Veto Counter | 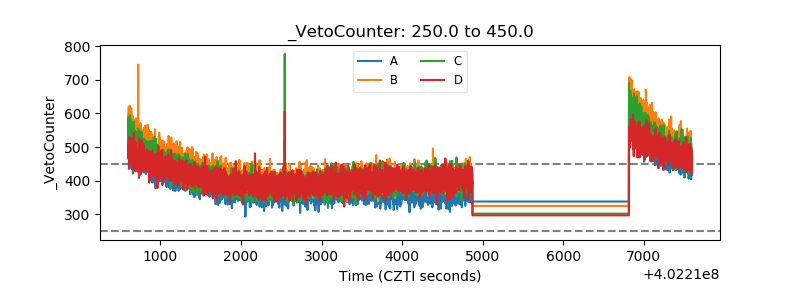 |