| Param | Original file | Final file |
|---|---|---|
| Filename | modeM0/AS1C07_001T12_9000005352_37883cztM0_level2.evt | modeM0/AS1C07_001T12_9000005352_37883cztM0_level2_quad_clean.evt |
| Size (bytes) | 383,978,880 | 92,093,760 |
| Size | 366.2 MB | 87.8 MB |
| Events in quadrant A | 2,711,942 | 637,401 |
| Events in quadrant B | 2,734,710 | 635,545 |
| Events in quadrant C | 2,635,005 | 595,285 |
| Events in quadrant D | 3,214,776 | 577,991 |
| Mode M9 | |||
|---|---|---|---|
| Quadrant | BADHDUFLAG | Total packets | Discarded packets |
| A | 0 | 28 | 0 |
| B | 0 | 28 | 0 |
| C | 0 | 28 | 0 |
| D | 0 | 29 | 0 |
| Mode M0 | |||
|---|---|---|---|
| Quadrant | BADHDUFLAG | Total packets | Discarded packets |
| A | 0 | 10903 | 3 |
| B | 0 | 11059 | 2 |
| C | 0 | 10630 | 2 |
| D | 0 | 12679 | 2 |
| Mode SS | |||
|---|---|---|---|
| Quadrant | BADHDUFLAG | Total packets | Discarded packets |
| A | 0 | 100 | 0 |
| B | 0 | 100 | 0 |
| C | 0 | 100 | 0 |
| D | 0 | 100 | 0 |
| Quadrant | Total seconds | Saturated seconds | Saturation percentage |
|---|---|---|---|
| A | 4886 | 15 | 0.307000% |
| B | 4886 | 87 | 1.780598% |
| C | 4886 | 65 | 1.330332% |
| D | 4886 | 179 | 3.663528% |
Noise dominated data is calculated using 1-second bins in cleaned event files. If a bin has >2000 counts, and if more than 50% of those come from <1% of pixels, then it is considered to be noise-dominated and hence unusable.
| Quadrant | # 1 sec bins | Bins with >0 counts | Bins with >2000 counts | High rate bins dominated by noise | Noise dominated (total time) | Noise dominated (detector-on time) | Marked lightcurve |
|---|---|---|---|---|---|---|---|
| A | 7009 | 4887 | 7 | 7 | 0.10% | 0.14% | 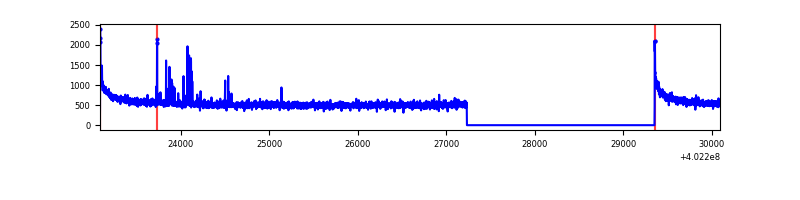 |
| B | 7009 | 4887 | 59 | 59 | 0.84% | 1.21% | 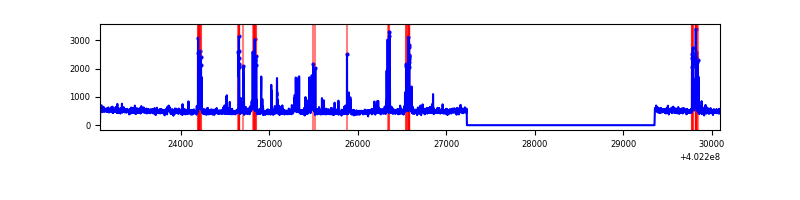 |
| C | 7009 | 4887 | 56 | 56 | 0.80% | 1.15% | 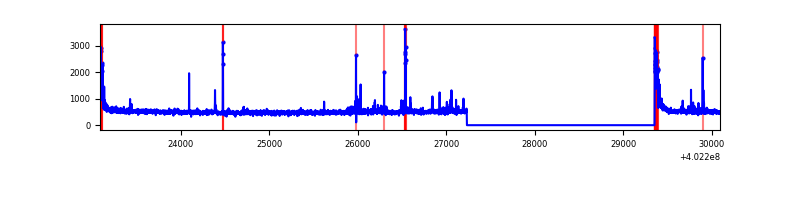 |
| D | 7009 | 4887 | 169 | 169 | 2.41% | 3.46% | 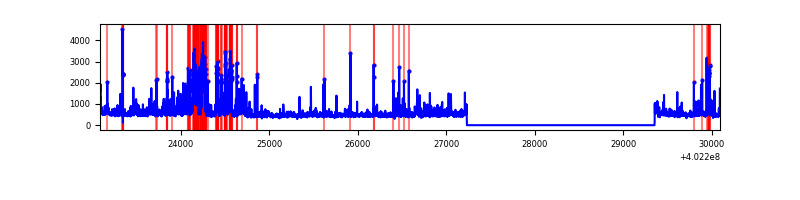 |
Top three noisy pixels from each quadrant. If the there are fewer than three noisy pixels in the level2.evt file, extra rows are filled as -1
| Pixel properties | Quadrant properties | ||||||
|---|---|---|---|---|---|---|---|
| Quadrant | DetID | PixID | Counts | Sigma | Mean | Median | Sigma |
| A | 10 | 83 | 340442 | 2888.36 | 595 | 586 | 117.7 |
| A | 12 | 227 | 26044 | 216.36 | 595 | 586 | 117.7 |
| A | 13 | 248 | 25782 | 214.13 | 595 | 586 | 117.7 |
| B | 5 | 172 | 397305 | 3675.43 | 578 | 568 | 107.9 |
| B | 0 | 229 | 18979 | 170.56 | 578 | 568 | 107.9 |
| B | 0 | 230 | 18892 | 169.76 | 578 | 568 | 107.9 |
| C | 15 | 214 | 208690 | 1633.76 | 555 | 559 | 127.4 |
| C | 0 | 10 | 158172 | 1237.21 | 555 | 559 | 127.4 |
| C | 14 | 254 | 87680 | 683.87 | 555 | 559 | 127.4 |
| D | 12 | 227 | 534959 | 3911.53 | 565 | 550 | 136.6 |
| D | 2 | 249 | 117893 | 858.88 | 565 | 550 | 136.6 |
| D | 1 | 52 | 99164 | 721.79 | 565 | 550 | 136.6 |
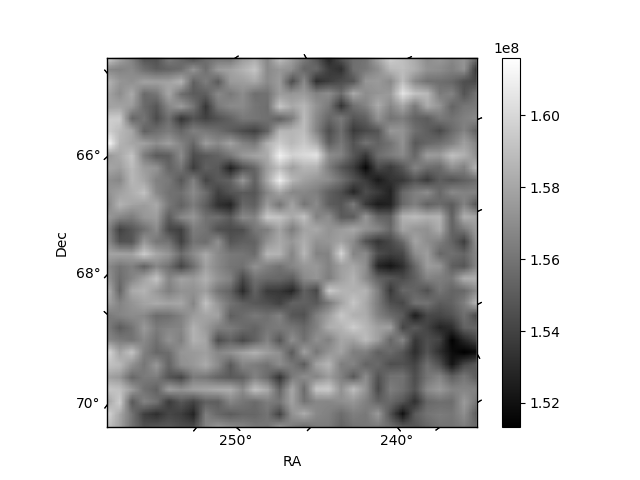
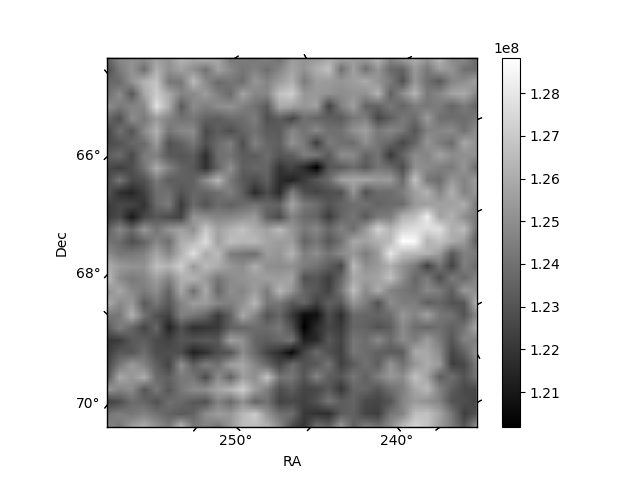
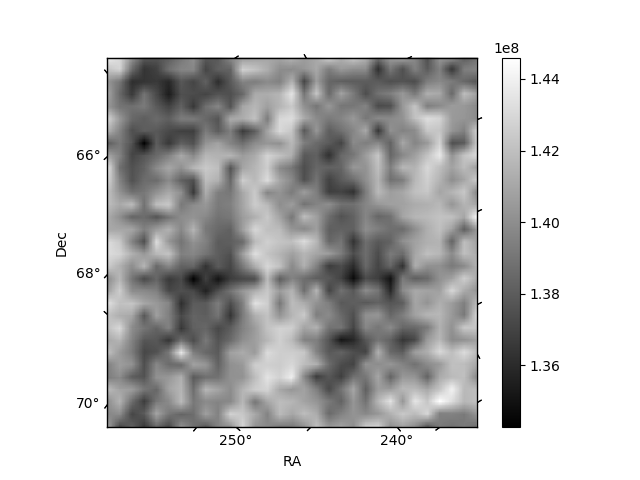
Histogram calculated using DETX and DETY for each event in the final _common_clean file
| Quadrant A | 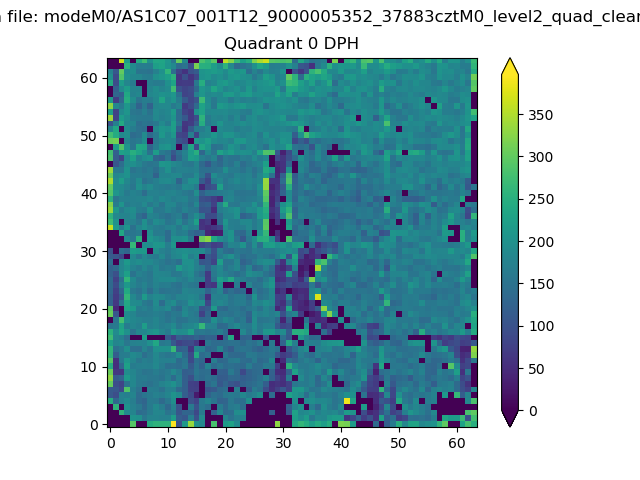 |
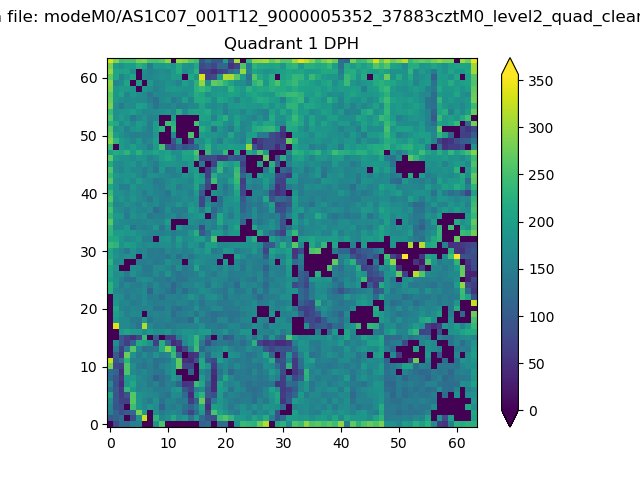 |
Quadrant B |
|---|---|---|---|
| Quadrant D | 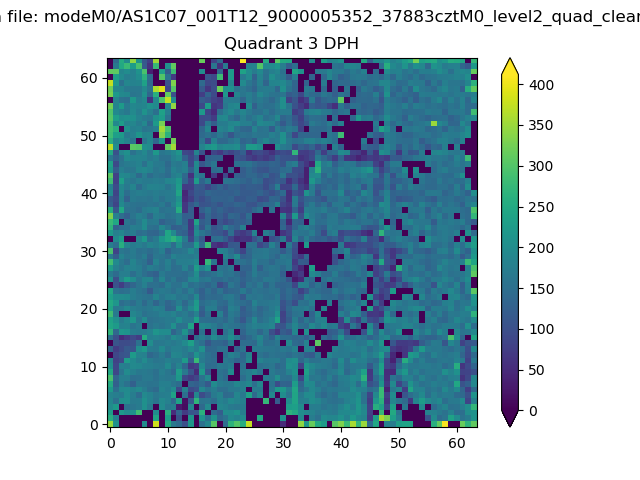 |
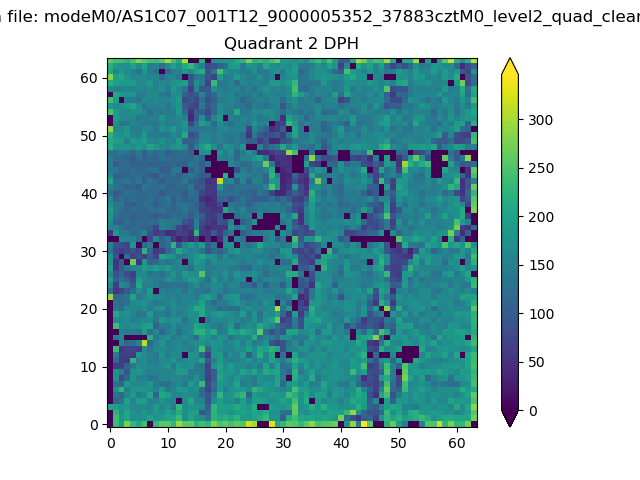 |
Quadrant C |
| Plot type | Count rate plots | Images |
|---|---|---|
| Comparison with Poisson distribution Blue bars denote a histogram of data divided into 1 sec bins. Red curve is a Poisson curve with rate = median count rate of data. |
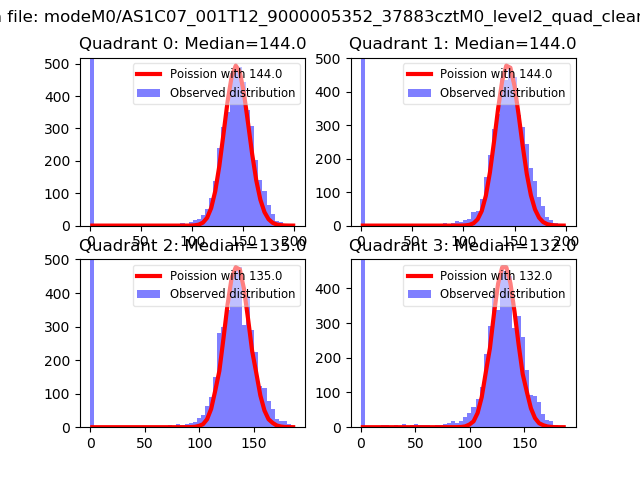 |
 |
| Quadrant-wise count rates Data is divided into 100 sec bins |
 |
|
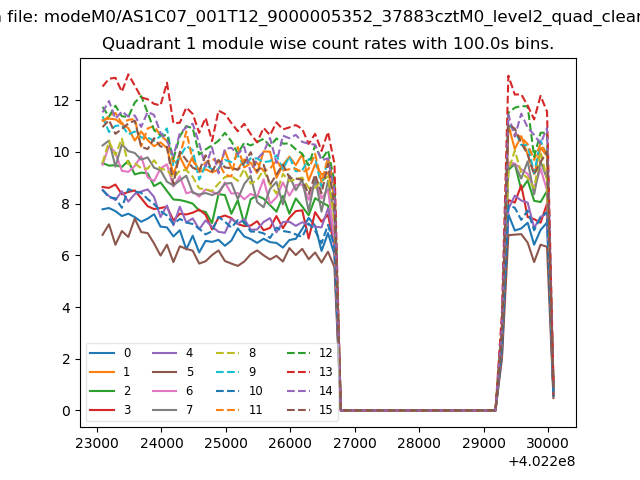
| Module-wise count rates for Quadrant A Data is divided into 100 sec bins |
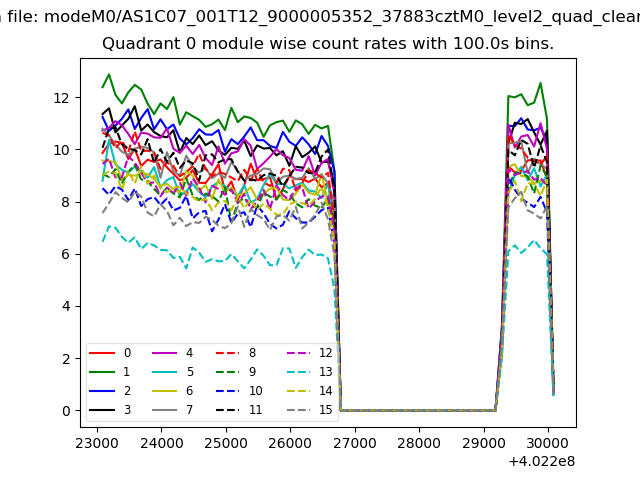 |
 |
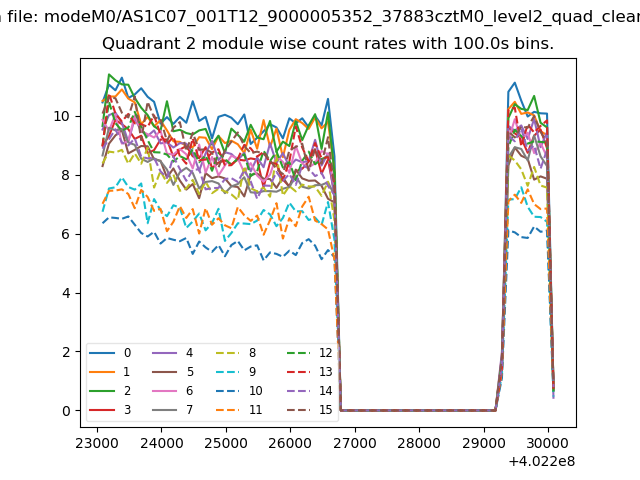
| Module-wise count rates for Quadrant B Data is divided into 100 sec bins |
 |
 |
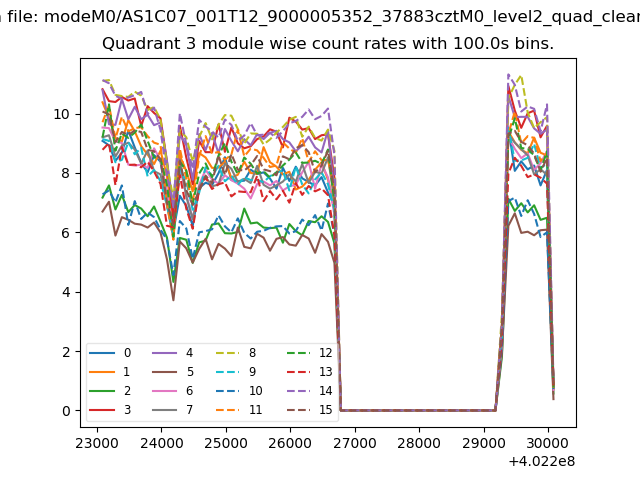
| Module-wise count rates for Quadrant C Data is divided into 100 sec bins |
 |
 |
| Module-wise count rates for Quadrant D Data is divided into 100 sec bins |
 |
 |
| Parameter | Plot |
|---|---|
| CZT HV Monitor | 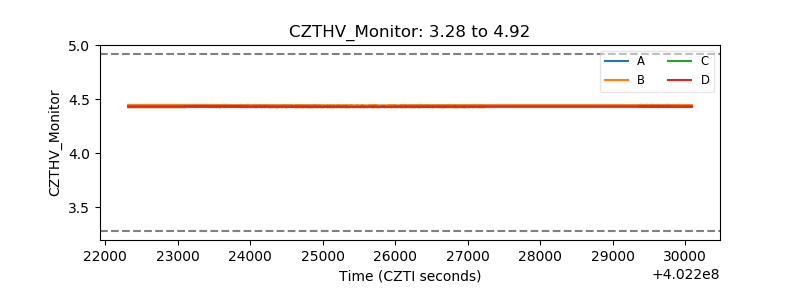 |
| D_VDD | 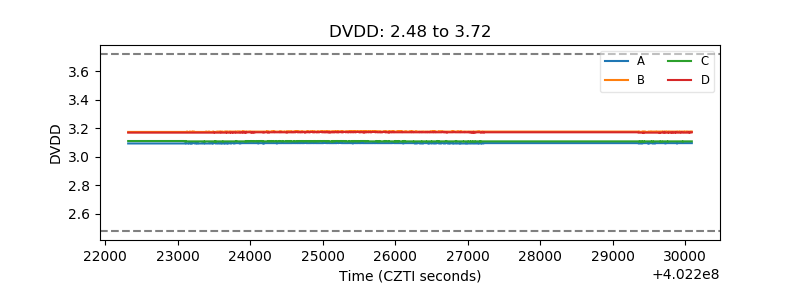 |
| Temperature 1 | 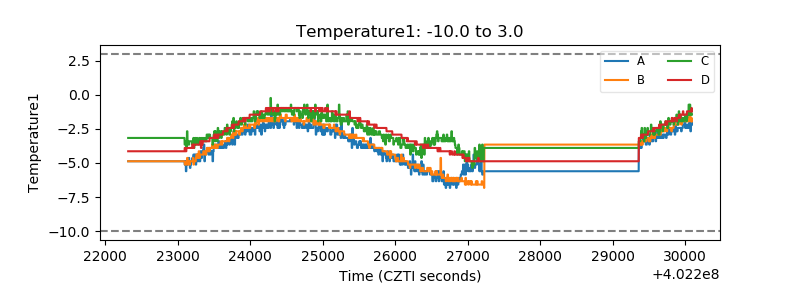 |
| Veto HV Monitor | 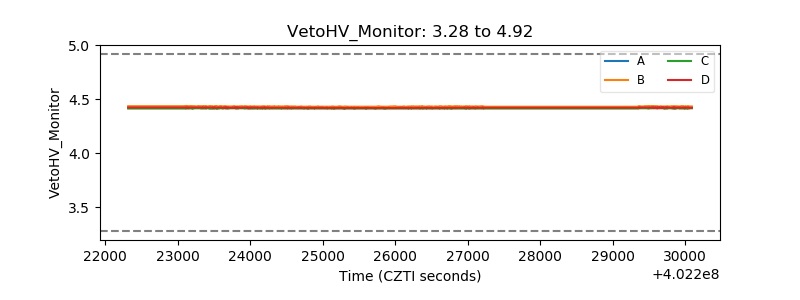 |
| Veto LLD | 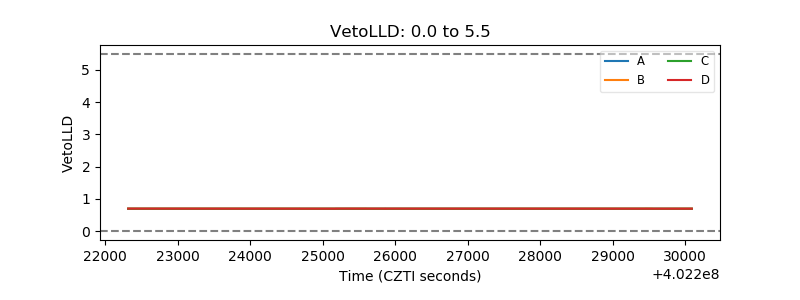 |
| Alpha Counter | 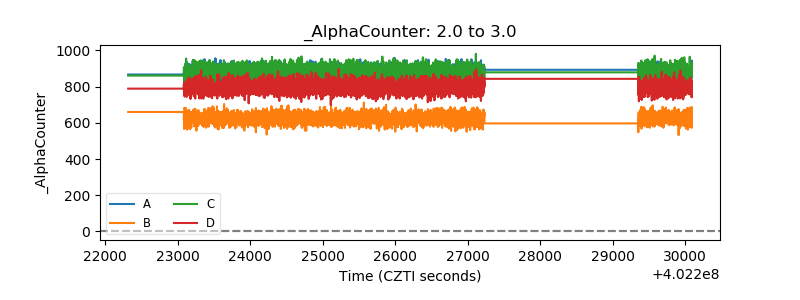 |
| _CPM_Rate | 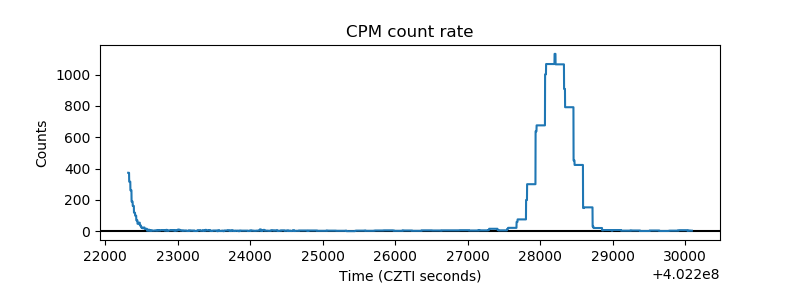 |
| CZT Counter | 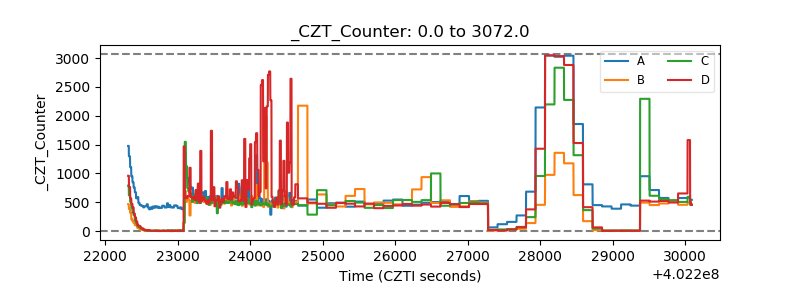 |
| +2.5 Volts monitor | 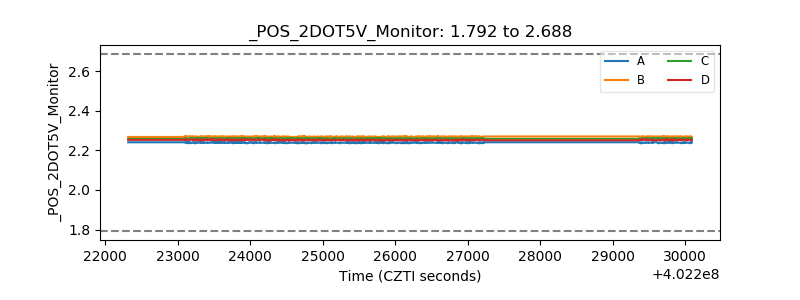 |
| +5 Volts monitor | 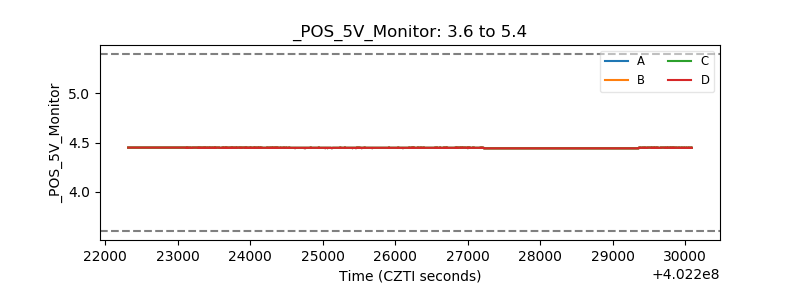 |
| _ROLL_ROT | 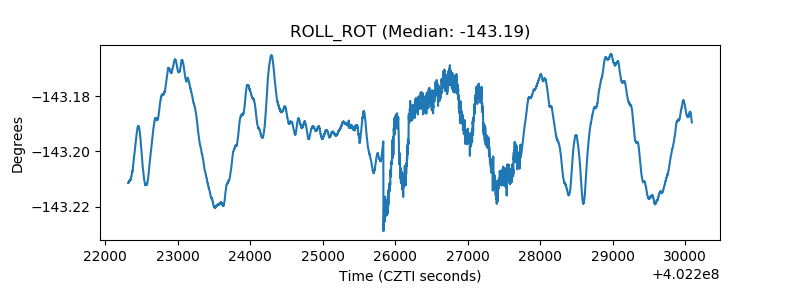 |
| _Roll_DEC | 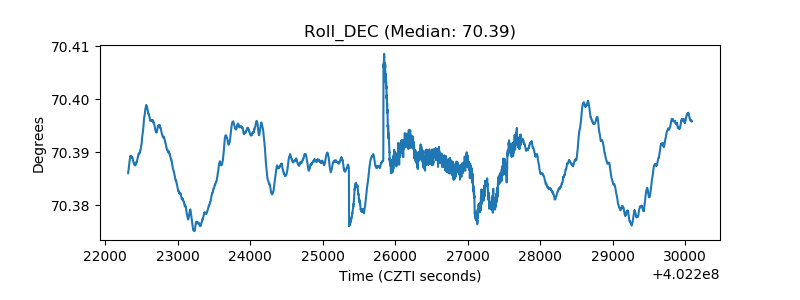 |
| _Roll_RA | 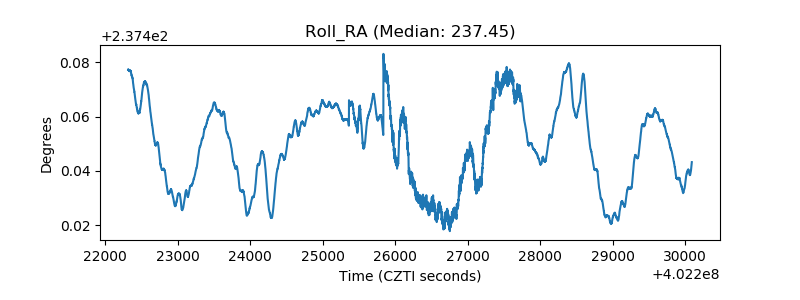 |
| Veto Counter | 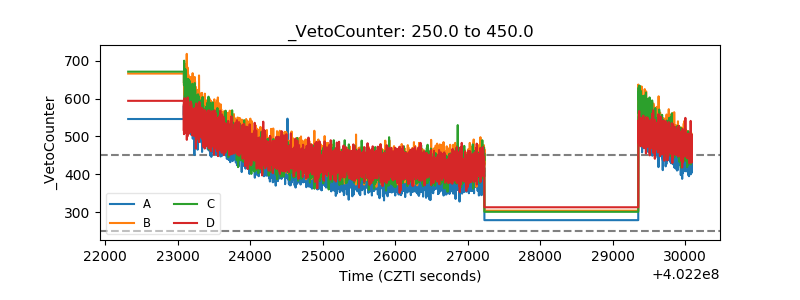 |