| Param | Original file | Final file |
|---|---|---|
| Filename | modeM0/AS1C07_001T12_9000005352_37884cztM0_level2.evt | modeM0/AS1C07_001T12_9000005352_37884cztM0_level2_quad_clean.evt |
| Size (bytes) | 377,245,440 | 82,416,960 |
| Size | 359.8 MB | 78.6 MB |
| Events in quadrant A | 2,625,181 | 560,775 |
| Events in quadrant B | 2,815,108 | 552,306 |
| Events in quadrant C | 2,627,575 | 524,001 |
| Events in quadrant D | 3,022,170 | 513,536 |
| Mode M9 | |||
|---|---|---|---|
| Quadrant | BADHDUFLAG | Total packets | Discarded packets |
| A | 0 | 30 | 0 |
| B | 0 | 30 | 0 |
| C | 0 | 30 | 0 |
| D | 0 | 31 | 0 |
| Mode M0 | |||
|---|---|---|---|
| Quadrant | BADHDUFLAG | Total packets | Discarded packets |
| A | 0 | 10686 | 3 |
| B | 0 | 11423 | 2 |
| C | 0 | 10722 | 2 |
| D | 0 | 12176 | 2 |
| Mode SS | |||
|---|---|---|---|
| Quadrant | BADHDUFLAG | Total packets | Discarded packets |
| A | 0 | 98 | 0 |
| B | 0 | 98 | 0 |
| C | 0 | 98 | 0 |
| D | 0 | 98 | 0 |
| Quadrant | Total seconds | Saturated seconds | Saturation percentage |
|---|---|---|---|
| A | 4929 | 12 | 0.243457% |
| B | 4929 | 137 | 2.779468% |
| C | 4929 | 55 | 1.115845% |
| D | 4929 | 105 | 2.130250% |
Noise dominated data is calculated using 1-second bins in cleaned event files. If a bin has >2000 counts, and if more than 50% of those come from <1% of pixels, then it is considered to be noise-dominated and hence unusable.
| Quadrant | # 1 sec bins | Bins with >0 counts | Bins with >2000 counts | High rate bins dominated by noise | Noise dominated (total time) | Noise dominated (detector-on time) | Marked lightcurve |
|---|---|---|---|---|---|---|---|
| A | 7052 | 4930 | 5 | 5 | 0.07% | 0.10% | 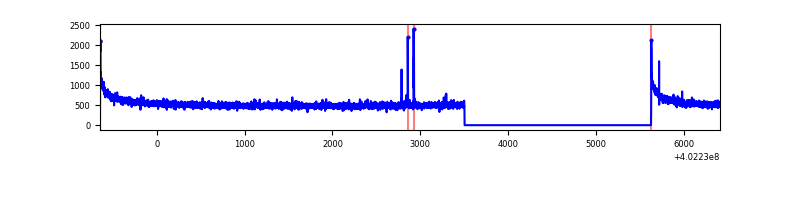 |
| B | 7052 | 4930 | 113 | 113 | 1.60% | 2.29% | 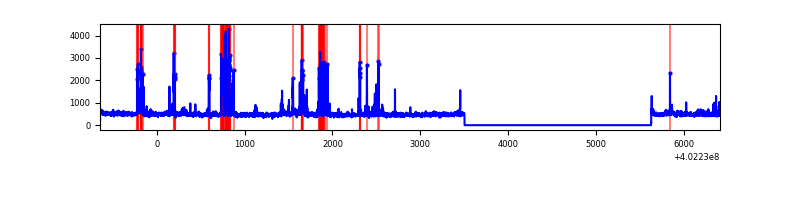 |
| C | 7052 | 4930 | 51 | 51 | 0.72% | 1.03% | 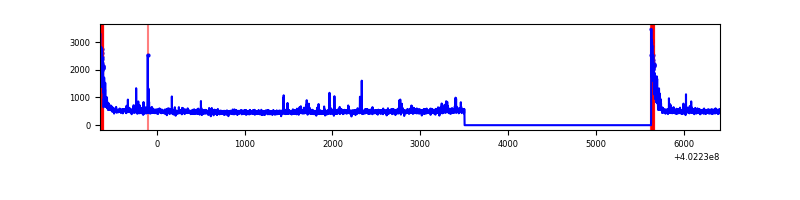 |
| D | 7052 | 4930 | 85 | 85 | 1.21% | 1.72% | 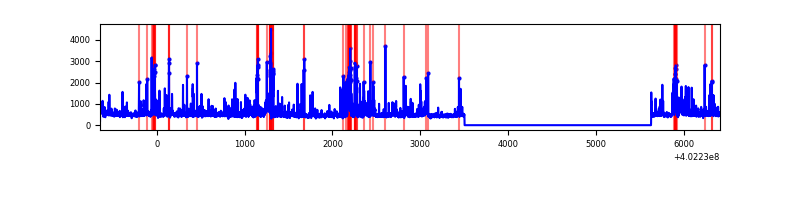 |
Top three noisy pixels from each quadrant. If the there are fewer than three noisy pixels in the level2.evt file, extra rows are filled as -1
| Pixel properties | Quadrant properties | ||||||
|---|---|---|---|---|---|---|---|
| Quadrant | DetID | PixID | Counts | Sigma | Mean | Median | Sigma |
| A | 10 | 83 | 345008 | 2988.1 | 579 | 569 | 115.3 |
| A | 12 | 227 | 18232 | 153.23 | 579 | 569 | 115.3 |
| A | 12 | 189 | 10182 | 83.4 | 579 | 569 | 115.3 |
| B | 5 | 172 | 474382 | 4468.69 | 562 | 548 | 106.0 |
| B | 0 | 213 | 27375 | 253.0 | 562 | 548 | 106.0 |
| B | 0 | 183 | 23414 | 215.65 | 562 | 548 | 106.0 |
| C | 15 | 214 | 209033 | 1658.5 | 549 | 553 | 125.7 |
| C | 0 | 10 | 206937 | 1641.82 | 549 | 553 | 125.7 |
| C | 14 | 254 | 60229 | 474.73 | 549 | 553 | 125.7 |
| D | 2 | 249 | 186175 | 1368.16 | 558 | 543 | 135.7 |
| D | 10 | 199 | 177915 | 1307.28 | 558 | 543 | 135.7 |
| D | 12 | 233 | 139112 | 1021.29 | 558 | 543 | 135.7 |
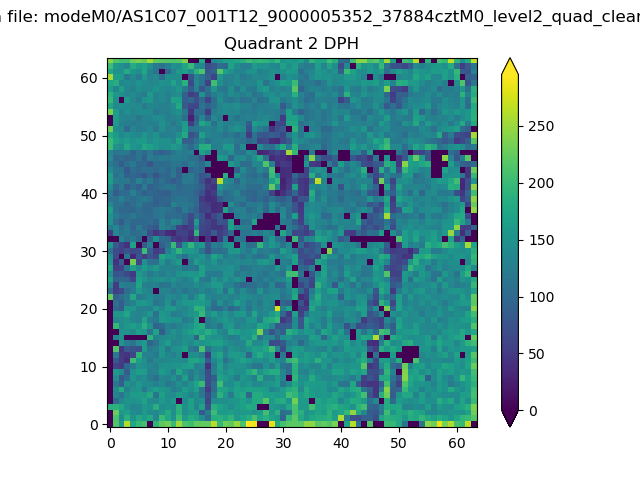
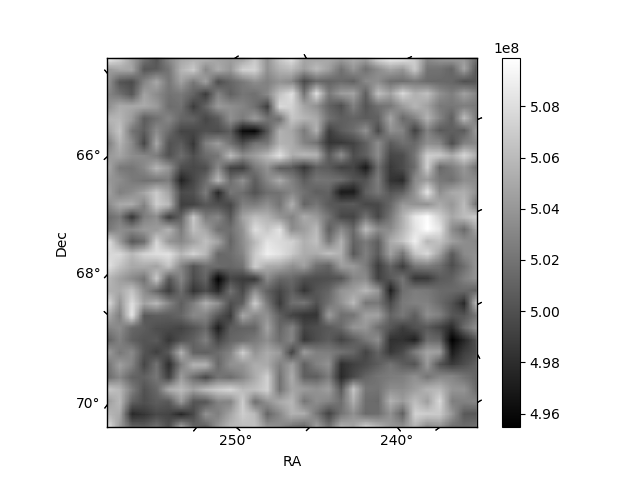
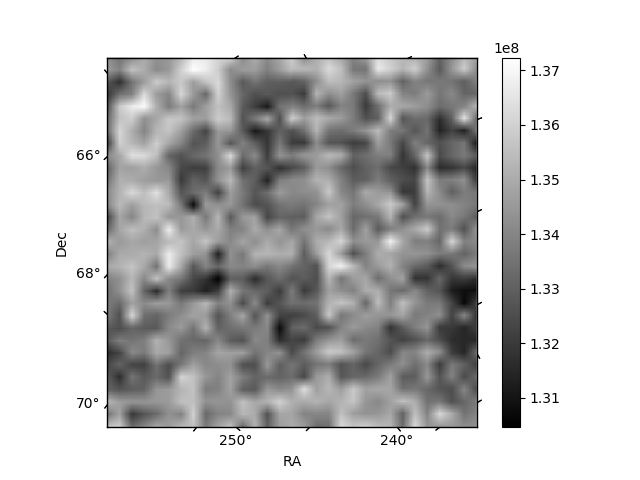
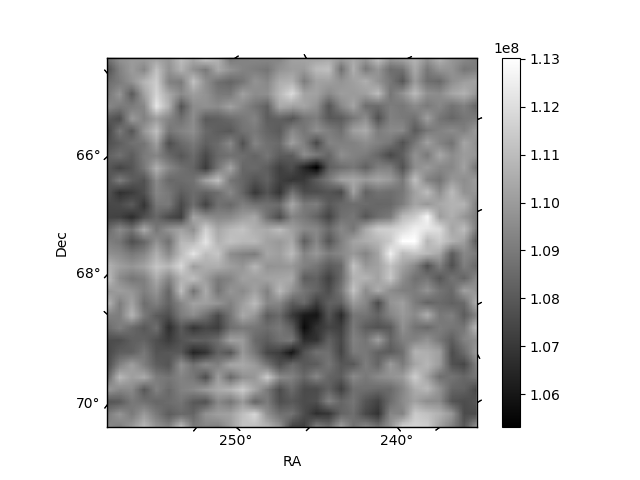
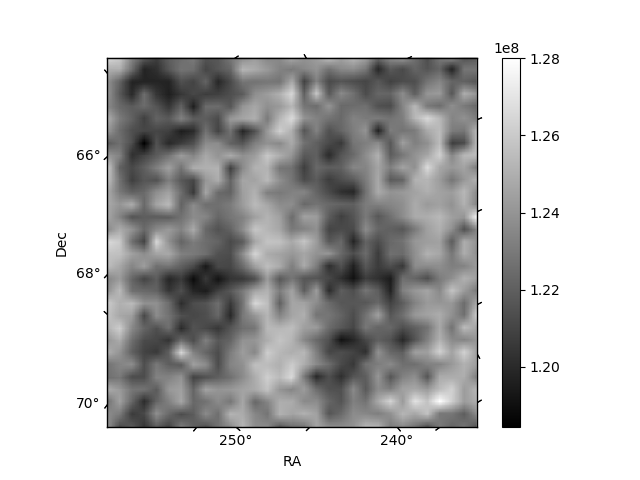
Histogram calculated using DETX and DETY for each event in the final _common_clean file
| Quadrant A | 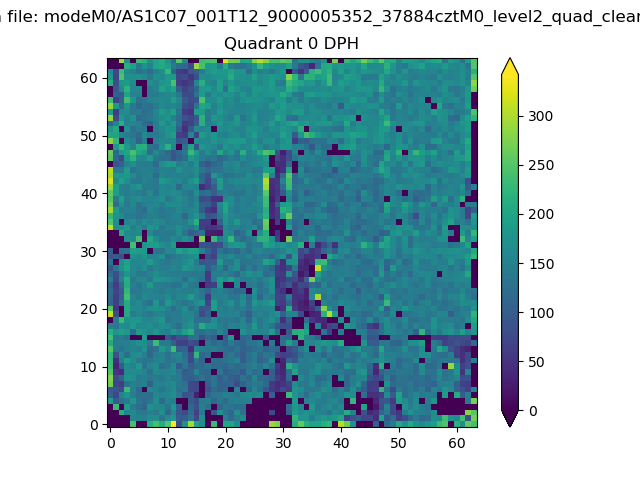 |
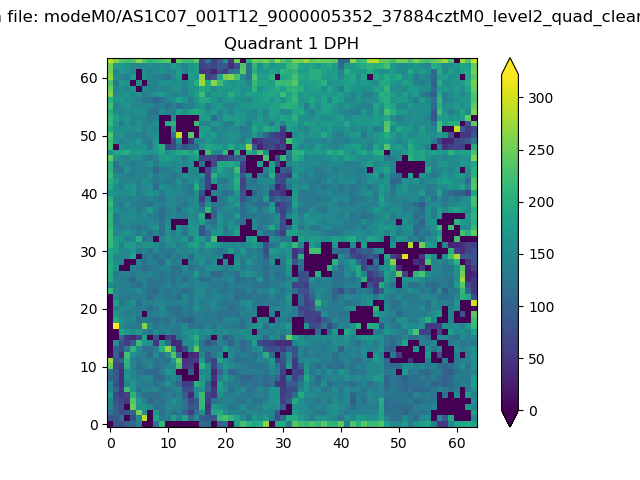 |
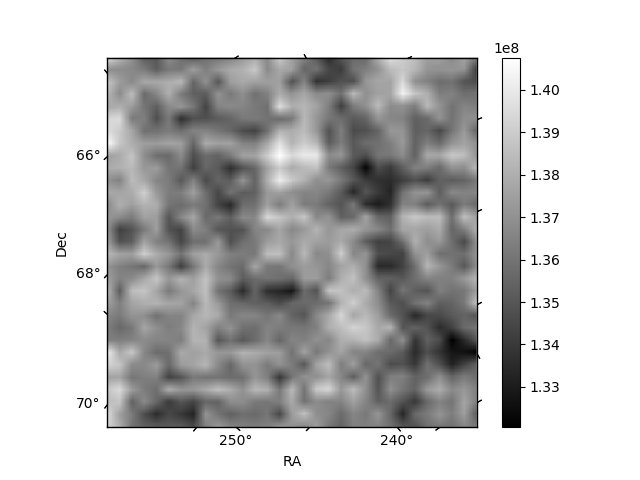
Quadrant B |
|---|---|---|---|
| Quadrant D | 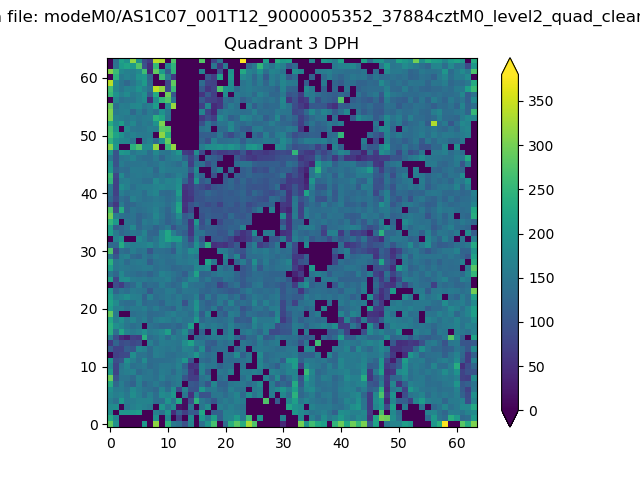 |
 |
Quadrant C |
| Plot type | Count rate plots | Images |
|---|---|---|
| Comparison with Poisson distribution Blue bars denote a histogram of data divided into 1 sec bins. Red curve is a Poisson curve with rate = median count rate of data. |
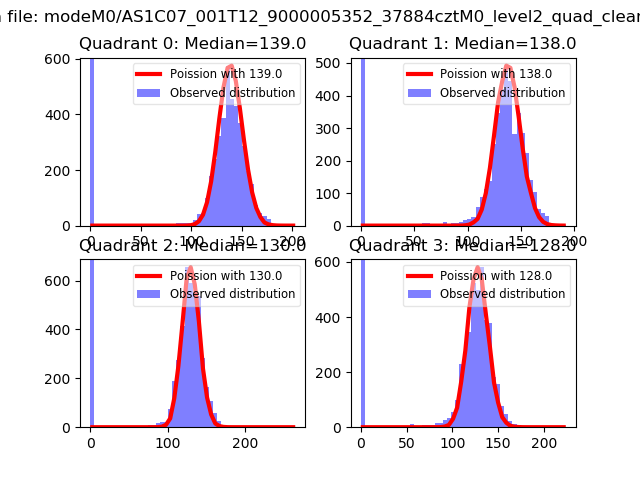 |
 |
| Quadrant-wise count rates Data is divided into 100 sec bins |
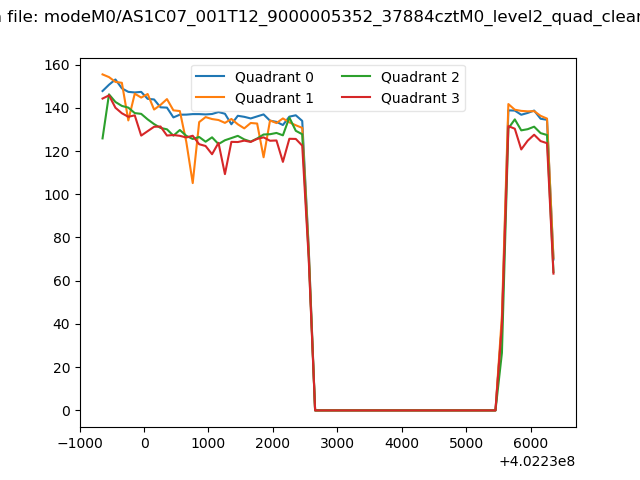 |
|
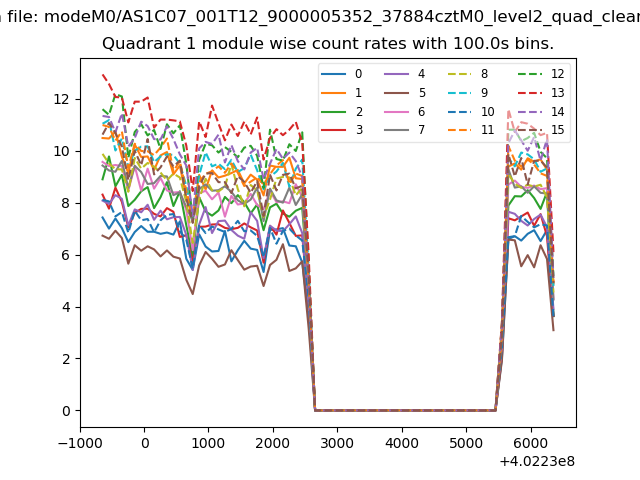
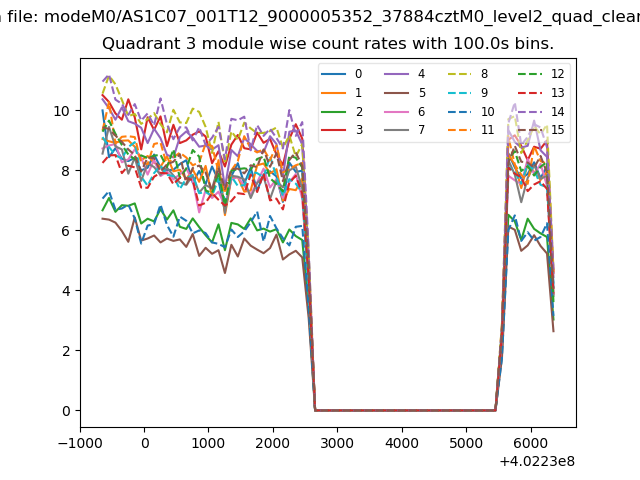
| Module-wise count rates for Quadrant A Data is divided into 100 sec bins |
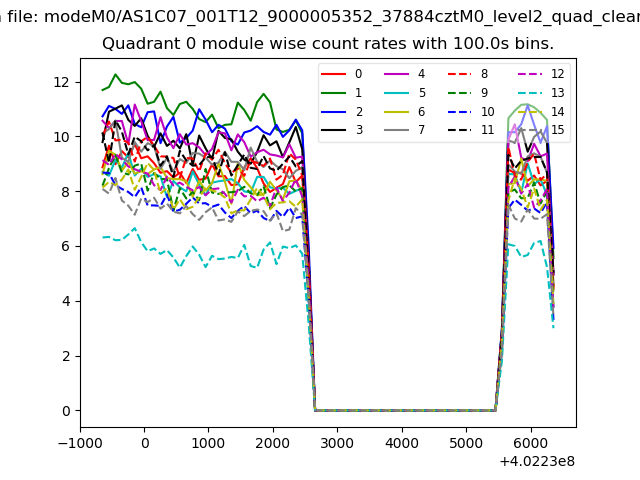 |
 |
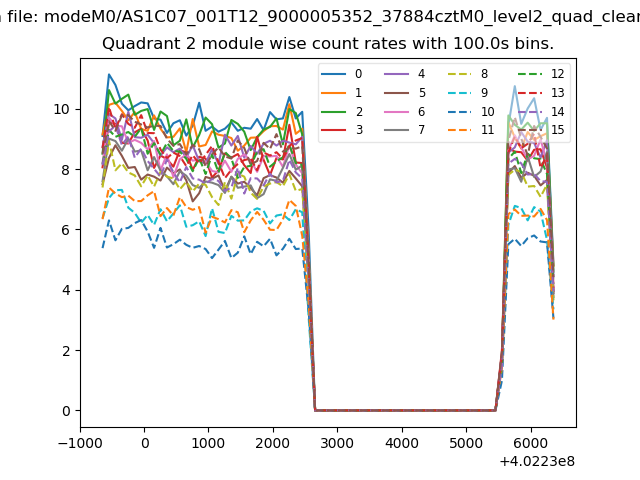
| Module-wise count rates for Quadrant B Data is divided into 100 sec bins |
 |
 |
| Module-wise count rates for Quadrant C Data is divided into 100 sec bins |
 |
 |
| Module-wise count rates for Quadrant D Data is divided into 100 sec bins |
 |
 |
| Parameter | Plot |
|---|---|
| CZT HV Monitor | 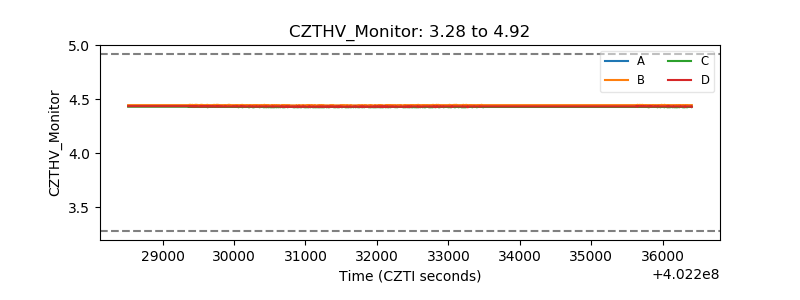 |
| D_VDD | 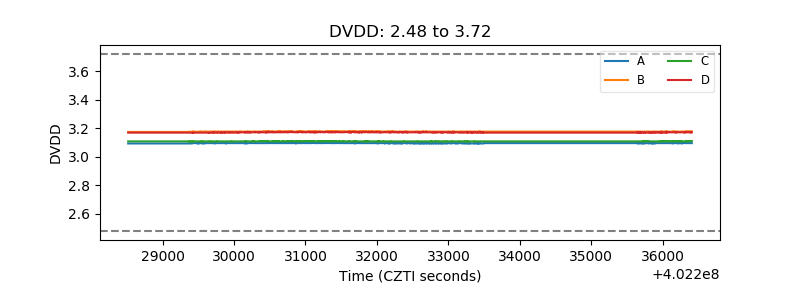 |
| Temperature 1 | 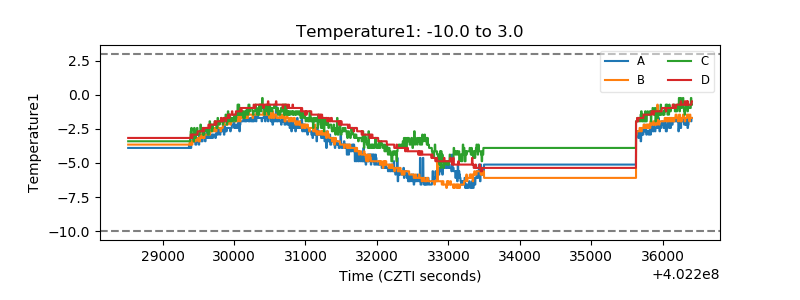 |
| Veto HV Monitor | 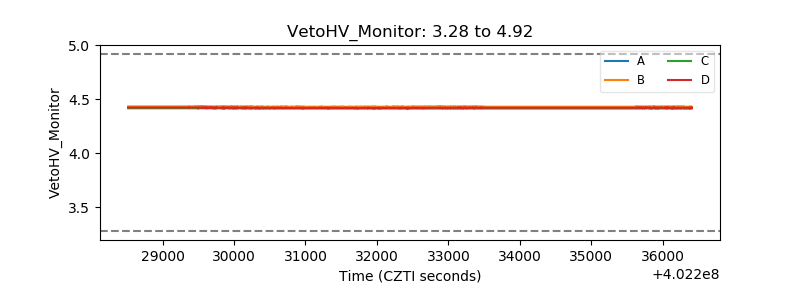 |
| Veto LLD | 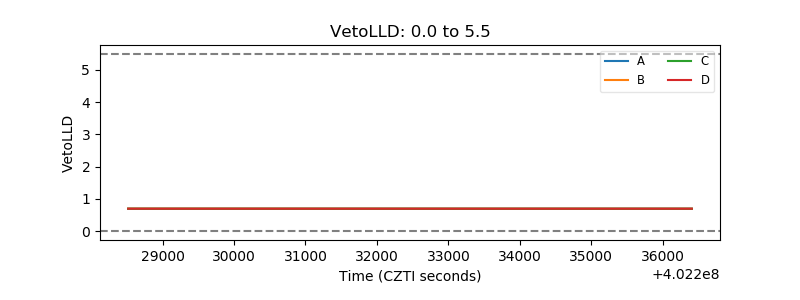 |
| Alpha Counter | 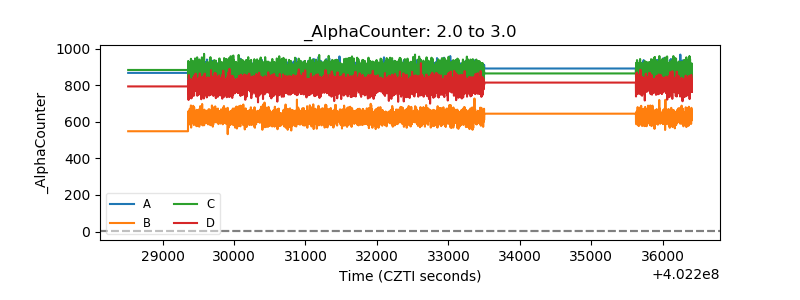 |
| _CPM_Rate | 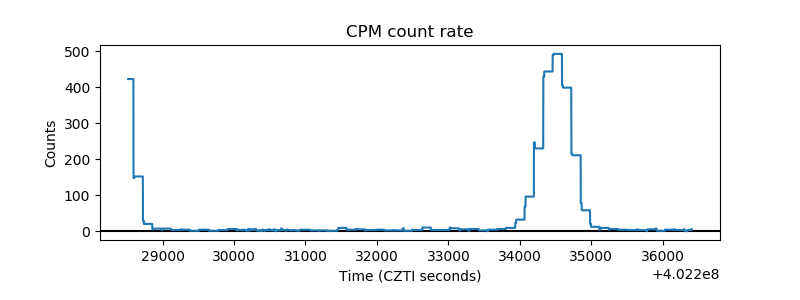 |
| CZT Counter | 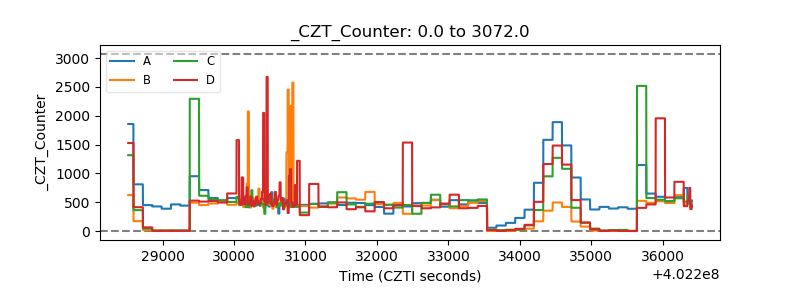 |
| +2.5 Volts monitor |  |
| +5 Volts monitor | 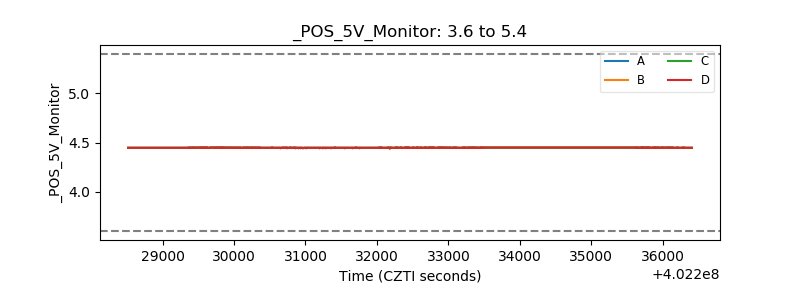 |
| _ROLL_ROT | 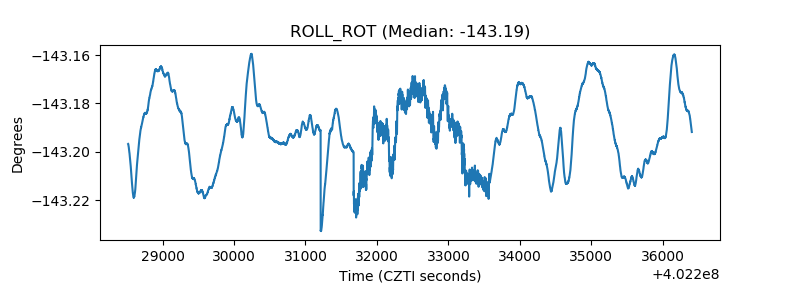 |
| _Roll_DEC | 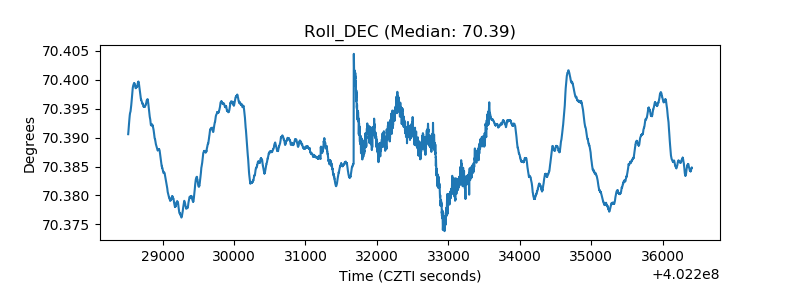 |
| _Roll_RA | 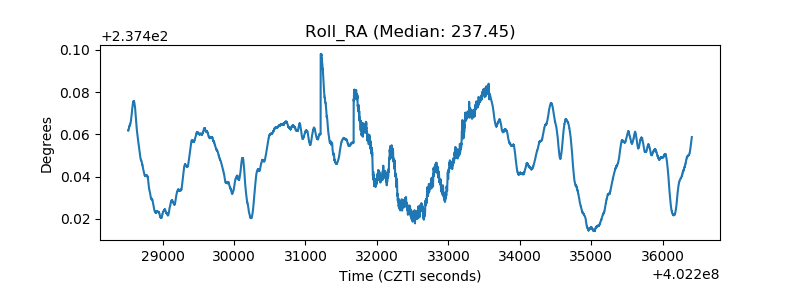 |
| Veto Counter | 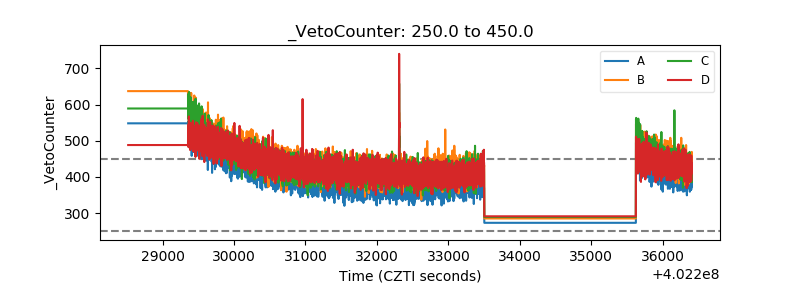 |