| Param | Original file | Final file |
|---|---|---|
| Filename | modeM0/AS1C07_001T12_9000005352_37885cztM0_level2.evt | modeM0/AS1C07_001T12_9000005352_37885cztM0_level2_quad_clean.evt |
| Size (bytes) | 406,008,000 | 69,523,200 |
| Size | 387.2 MB | 66.3 MB |
| Events in quadrant A | 2,721,988 | 464,023 |
| Events in quadrant B | 3,029,108 | 446,356 |
| Events in quadrant C | 2,716,986 | 427,007 |
| Events in quadrant D | 3,468,081 | 397,323 |
| Mode M9 | |||
|---|---|---|---|
| Quadrant | BADHDUFLAG | Total packets | Discarded packets |
| A | 0 | 20 | 0 |
| B | 0 | 20 | 0 |
| C | 0 | 20 | 0 |
| D | 0 | 20 | 0 |
| Mode M0 | |||
|---|---|---|---|
| Quadrant | BADHDUFLAG | Total packets | Discarded packets |
| A | 0 | 11337 | 3 |
| B | 0 | 12498 | 2 |
| C | 0 | 11299 | 2 |
| D | 0 | 13847 | 2 |
| Mode SS | |||
|---|---|---|---|
| Quadrant | BADHDUFLAG | Total packets | Discarded packets |
| A | 0 | 108 | 0 |
| B | 0 | 108 | 0 |
| C | 0 | 108 | 0 |
| D | 0 | 108 | 0 |
| Quadrant | Total seconds | Saturated seconds | Saturation percentage |
|---|---|---|---|
| A | 5290 | 14 | 0.264650% |
| B | 5290 | 205 | 3.875236% |
| C | 5290 | 28 | 0.529301% |
| D | 5290 | 187 | 3.534972% |
Noise dominated data is calculated using 1-second bins in cleaned event files. If a bin has >2000 counts, and if more than 50% of those come from <1% of pixels, then it is considered to be noise-dominated and hence unusable.
| Quadrant | # 1 sec bins | Bins with >0 counts | Bins with >2000 counts | High rate bins dominated by noise | Noise dominated (total time) | Noise dominated (detector-on time) | Marked lightcurve |
|---|---|---|---|---|---|---|---|
| A | 7294 | 5291 | 4 | 4 | 0.05% | 0.08% | 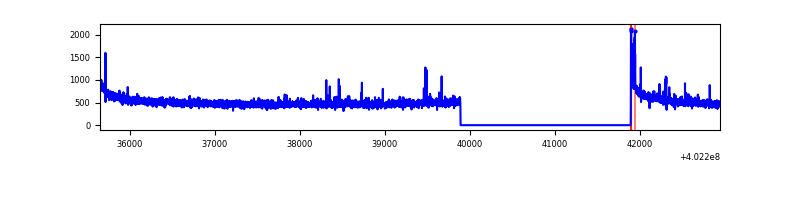 |
| B | 7294 | 5291 | 169 | 169 | 2.32% | 3.19% | 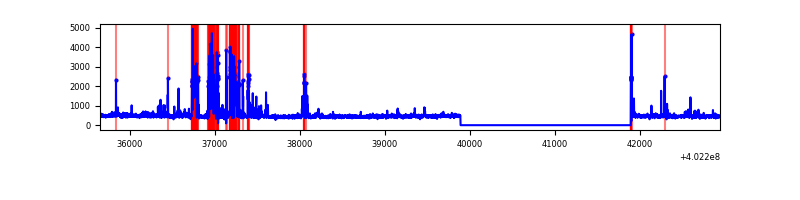 |
| C | 7294 | 5291 | 24 | 24 | 0.33% | 0.45% | 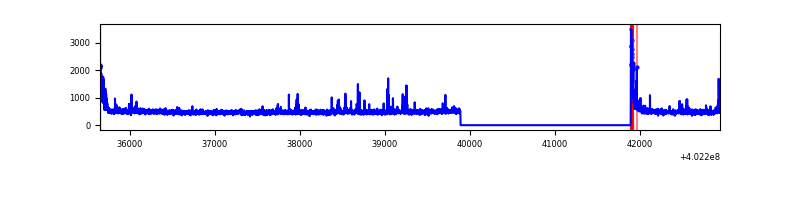 |
| D | 7294 | 5291 | 162 | 162 | 2.22% | 3.06% | 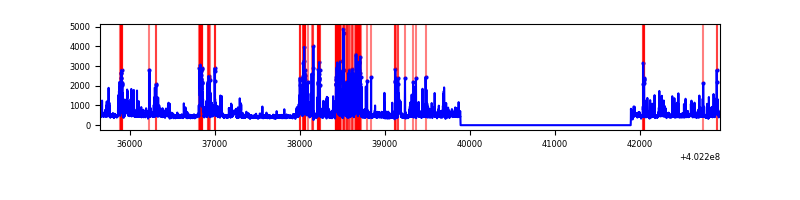 |
Top three noisy pixels from each quadrant. If the there are fewer than three noisy pixels in the level2.evt file, extra rows are filled as -1
| Pixel properties | Quadrant properties | ||||||
|---|---|---|---|---|---|---|---|
| Quadrant | DetID | PixID | Counts | Sigma | Mean | Median | Sigma |
| A | 10 | 83 | 341640 | 2874.52 | 596 | 587 | 118.6 |
| A | 12 | 227 | 30774 | 254.43 | 596 | 587 | 118.6 |
| A | 13 | 248 | 17274 | 140.64 | 596 | 587 | 118.6 |
| B | 5 | 172 | 645767 | 5937.72 | 579 | 565 | 108.7 |
| B | 0 | 183 | 25859 | 232.78 | 579 | 565 | 108.7 |
| B | 0 | 213 | 19495 | 174.21 | 579 | 565 | 108.7 |
| C | 15 | 214 | 226066 | 1695.02 | 575 | 577 | 133.0 |
| C | 0 | 10 | 148247 | 1110.05 | 575 | 577 | 133.0 |
| C | 14 | 254 | 84447 | 630.46 | 575 | 577 | 133.0 |
| D | 12 | 233 | 545520 | 3867.29 | 574 | 559 | 140.9 |
| D | 2 | 249 | 165719 | 1172.05 | 574 | 559 | 140.9 |
| D | 2 | 250 | 146998 | 1039.2 | 574 | 559 | 140.9 |
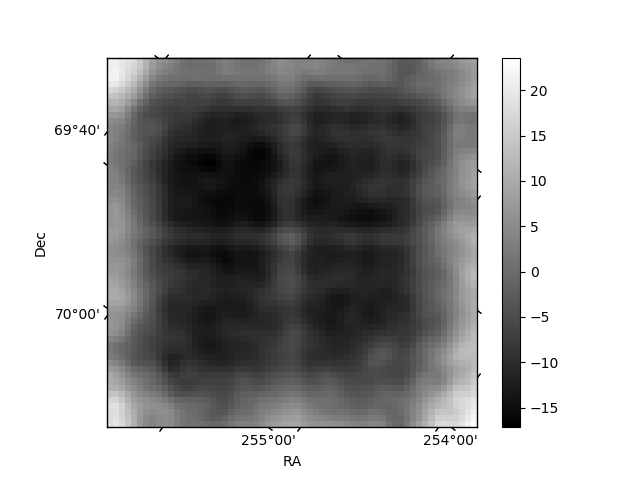
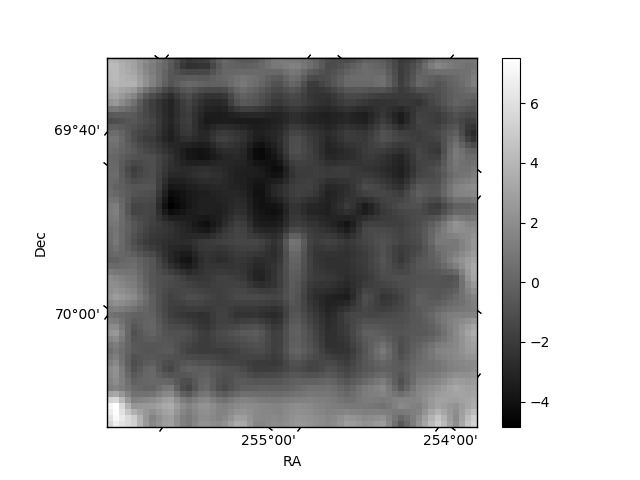
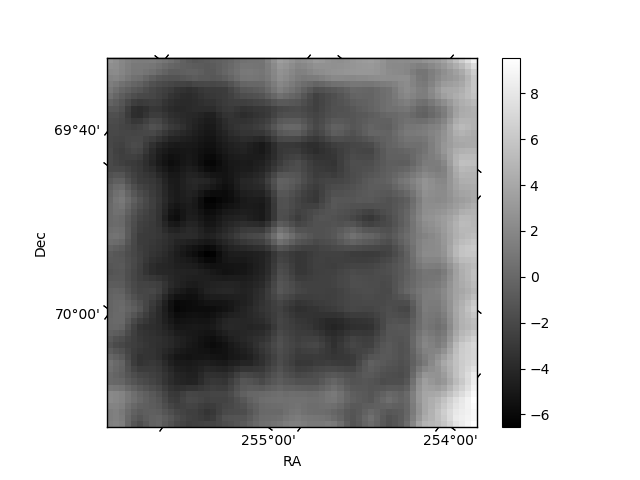
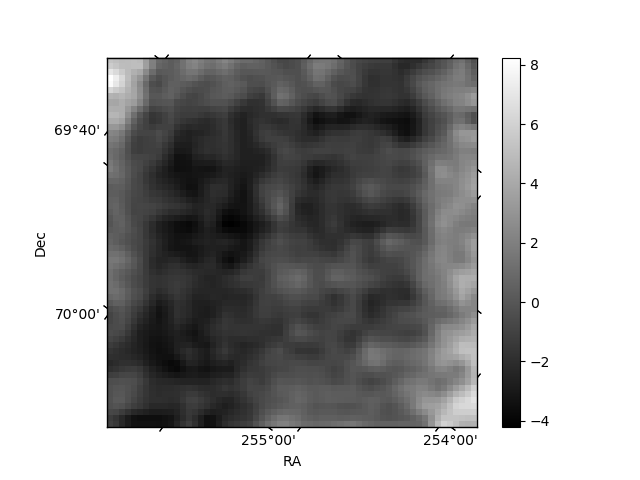
Histogram calculated using DETX and DETY for each event in the final _common_clean file
| Quadrant A | 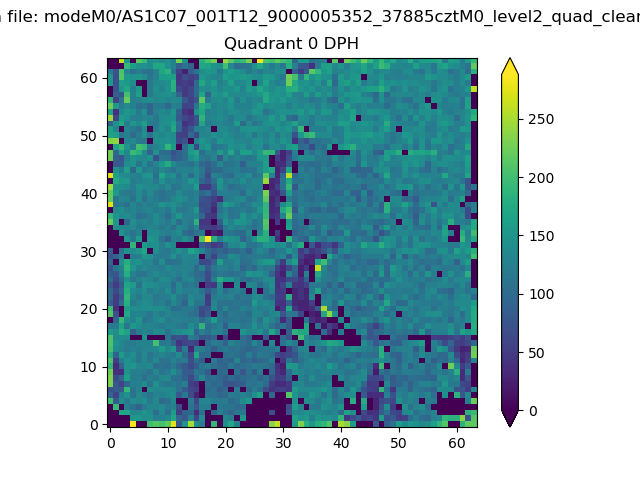 |
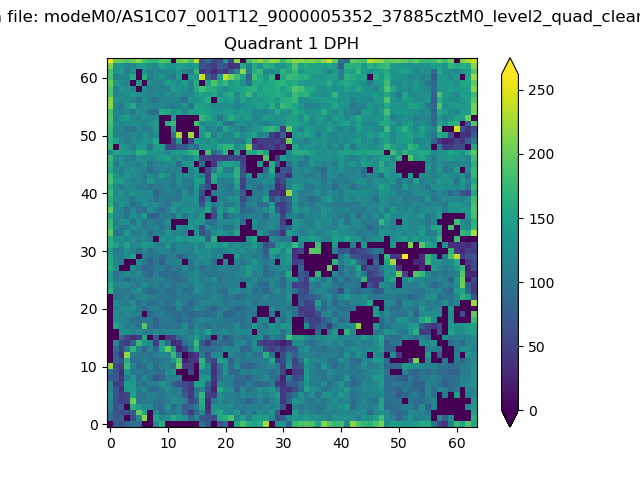 |
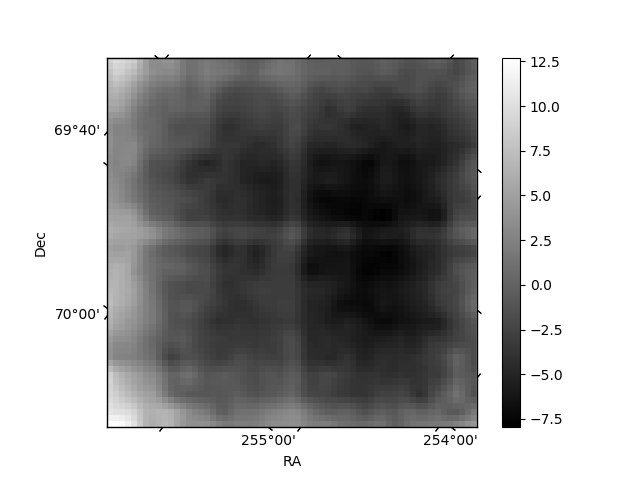
Quadrant B |
|---|---|---|---|
| Quadrant D | 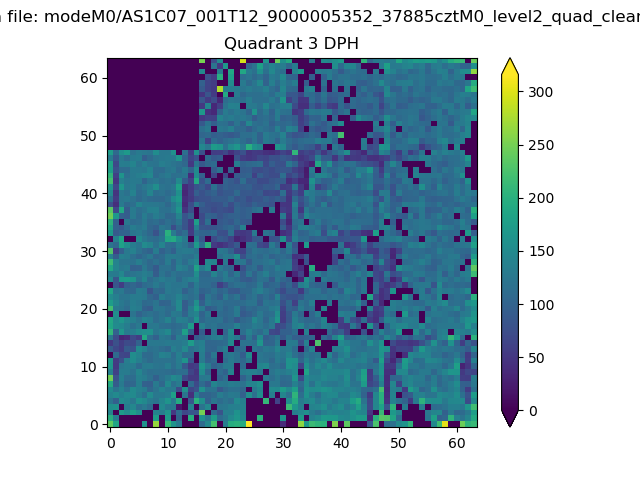 |
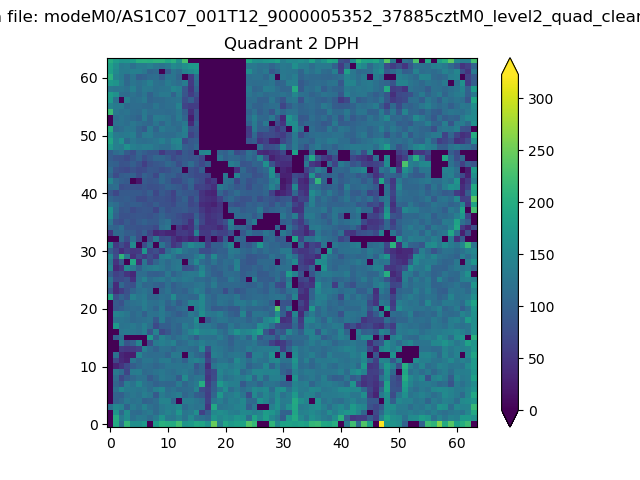 |
Quadrant C |
| Plot type | Count rate plots | Images |
|---|---|---|
| Comparison with Poisson distribution Blue bars denote a histogram of data divided into 1 sec bins. Red curve is a Poisson curve with rate = median count rate of data. |
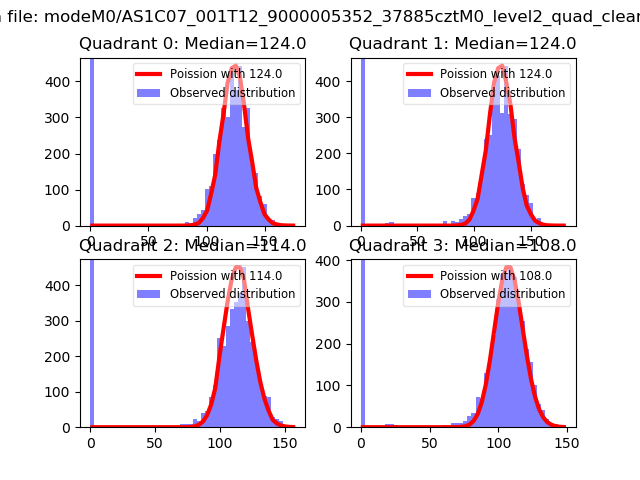 |
 |
| Quadrant-wise count rates Data is divided into 100 sec bins |
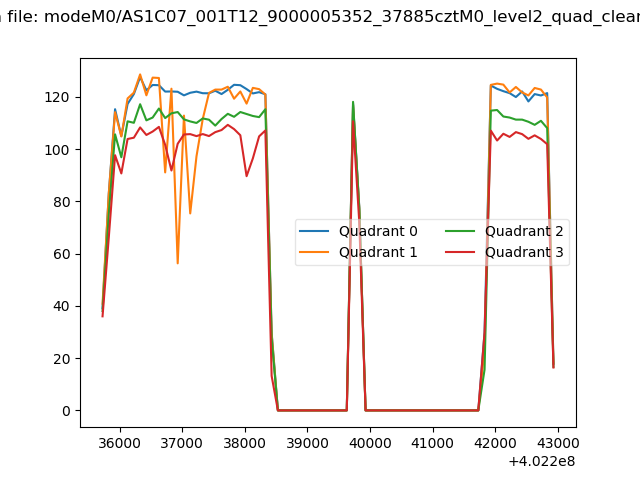 |
|
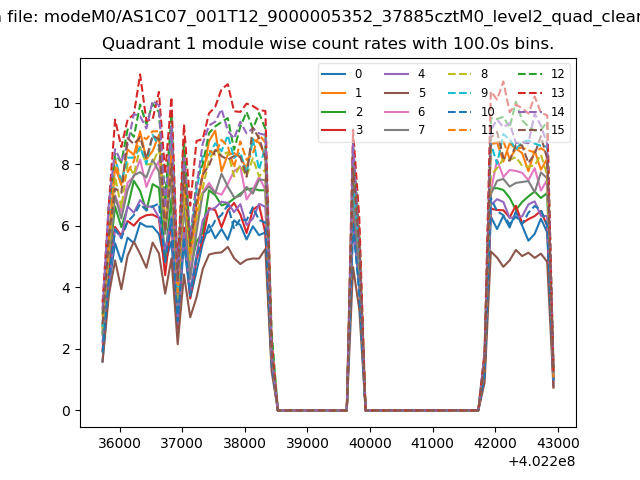
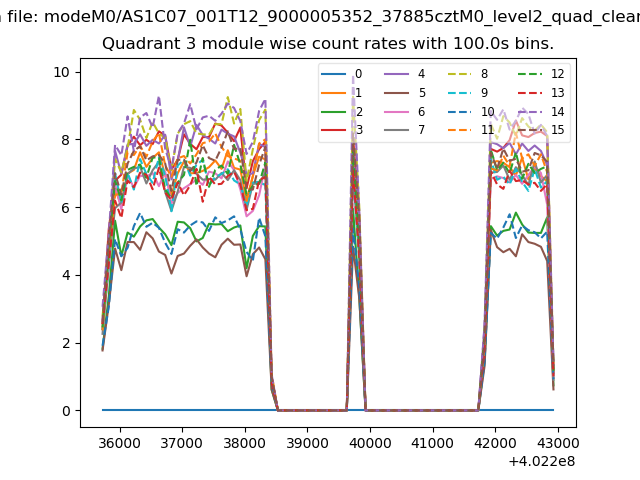
| Module-wise count rates for Quadrant A Data is divided into 100 sec bins |
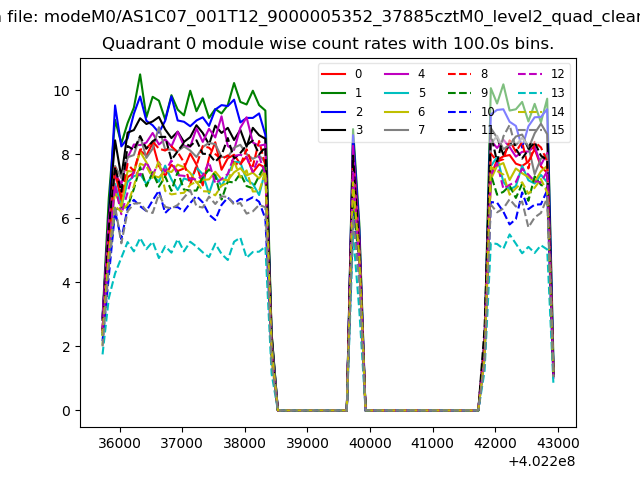 |
 |
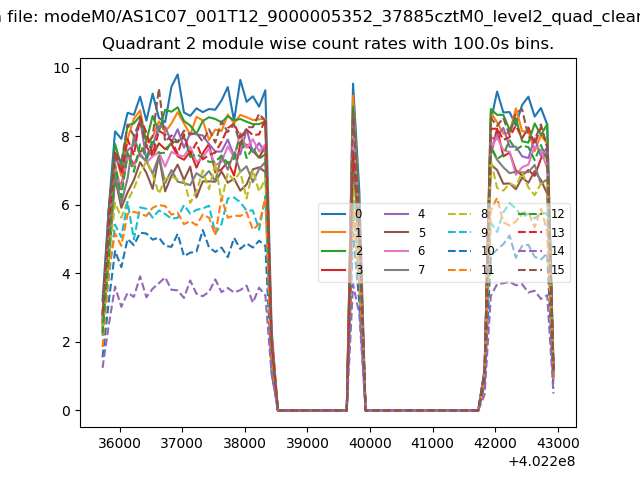
| Module-wise count rates for Quadrant B Data is divided into 100 sec bins |
 |
 |
| Module-wise count rates for Quadrant C Data is divided into 100 sec bins |
 |
 |
| Module-wise count rates for Quadrant D Data is divided into 100 sec bins |
 |
 |
| Parameter | Plot |
|---|---|
| CZT HV Monitor |  |
| D_VDD | 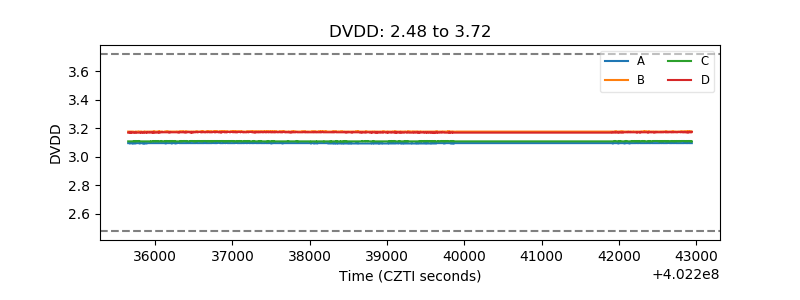 |
| Temperature 1 | 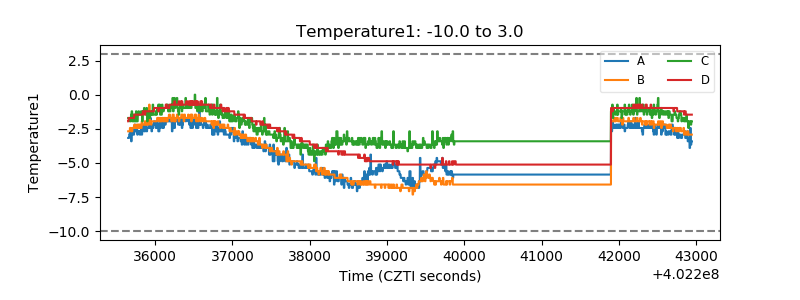 |
| Veto HV Monitor | 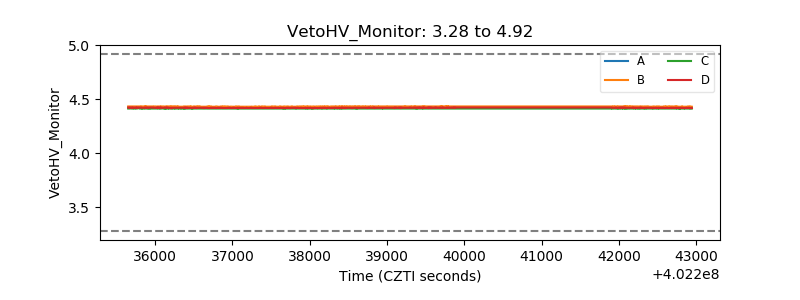 |
| Veto LLD | 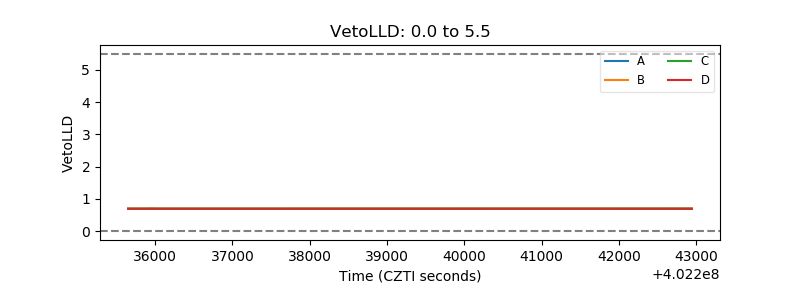 |
| Alpha Counter | 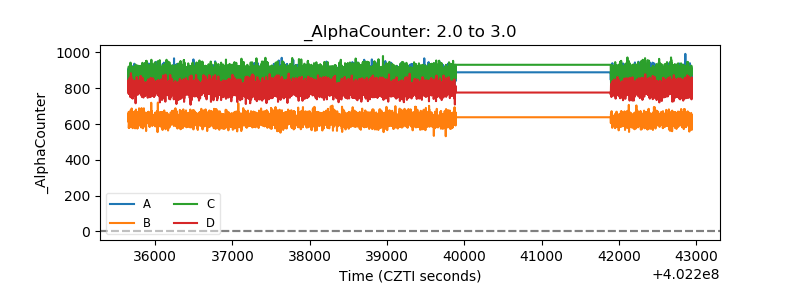 |
| _CPM_Rate | 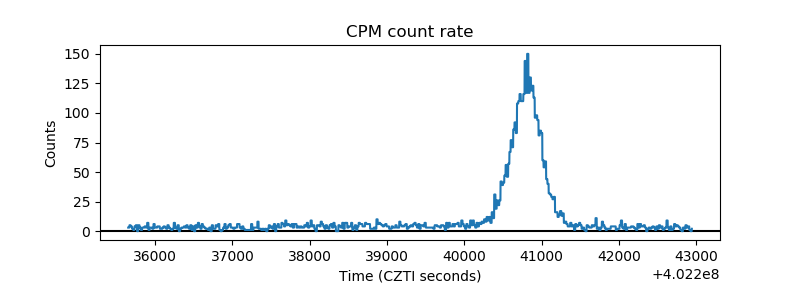 |
| CZT Counter | 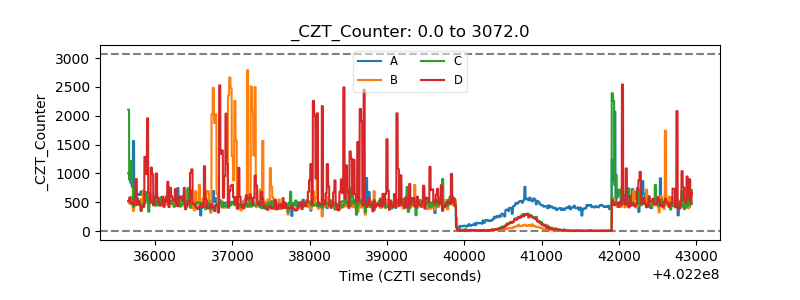 |
| +2.5 Volts monitor | 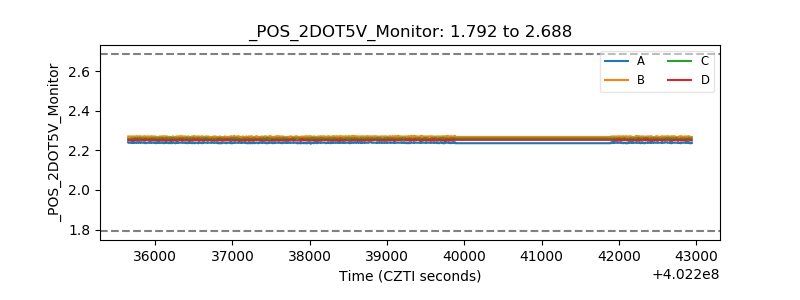 |
| +5 Volts monitor | 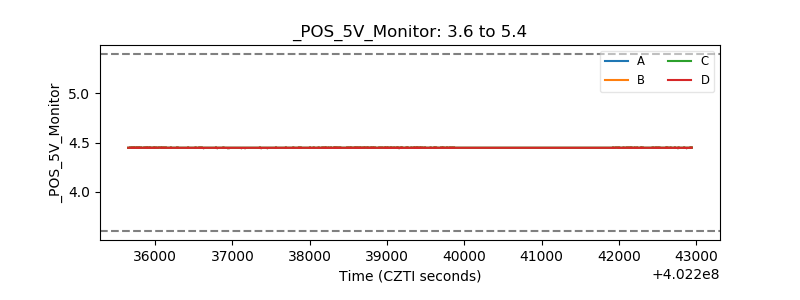 |
| _ROLL_ROT | 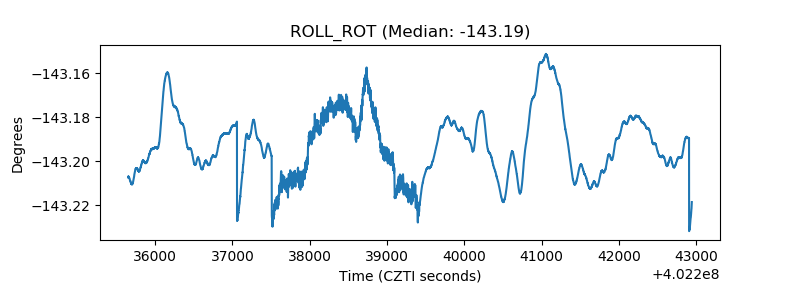 |
| _Roll_DEC | 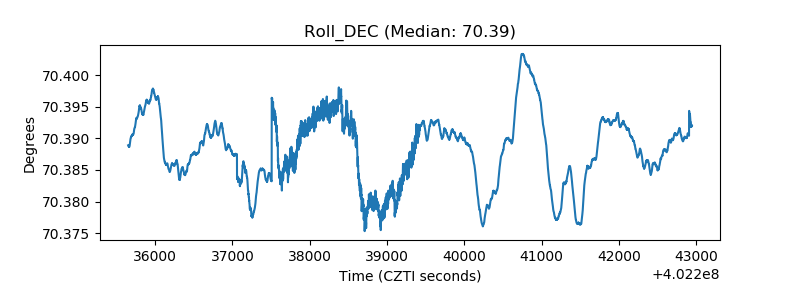 |
| _Roll_RA | 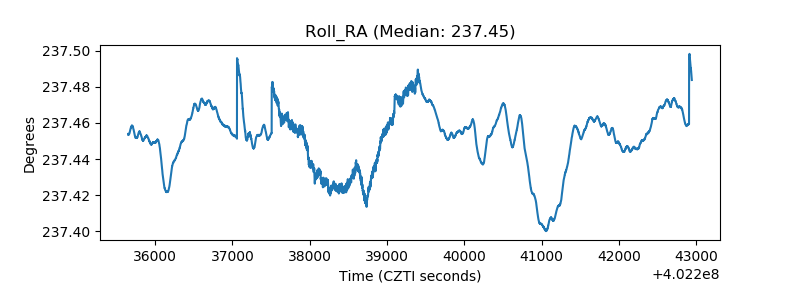 |
| Veto Counter | 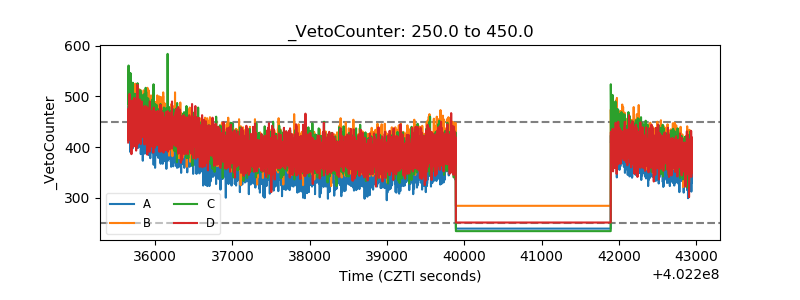 |