| Param | Original file | Final file |
|---|---|---|
| Filename | modeM0/AS1C07_001T12_9000005352_37886cztM0_level2.evt | modeM0/AS1C07_001T12_9000005352_37886cztM0_level2_quad_clean.evt |
| Size (bytes) | 442,028,160 | 73,365,120 |
| Size | 421.6 MB | 70.0 MB |
| Events in quadrant A | 2,804,849 | 491,004 |
| Events in quadrant B | 3,277,463 | 473,960 |
| Events in quadrant C | 2,775,927 | 458,856 |
| Events in quadrant D | 4,157,984 | 415,782 |
| Mode M9 | |||
|---|---|---|---|
| Quadrant | BADHDUFLAG | Total packets | Discarded packets |
| A | 0 | 17 | 0 |
| B | 0 | 17 | 0 |
| C | 0 | 17 | 0 |
| D | 0 | 18 | 0 |
| Mode M0 | |||
|---|---|---|---|
| Quadrant | BADHDUFLAG | Total packets | Discarded packets |
| A | 0 | 11822 | 3 |
| B | 0 | 13496 | 2 |
| C | 0 | 11643 | 2 |
| D | 0 | 16078 | 2 |
| Mode SS | |||
|---|---|---|---|
| Quadrant | BADHDUFLAG | Total packets | Discarded packets |
| A | 0 | 112 | 0 |
| B | 0 | 112 | 0 |
| C | 0 | 112 | 0 |
| D | 0 | 112 | 0 |
| Quadrant | Total seconds | Saturated seconds | Saturation percentage |
|---|---|---|---|
| A | 5452 | 25 | 0.458547% |
| B | 5452 | 238 | 4.365371% |
| C | 5452 | 44 | 0.807043% |
| D | 5452 | 400 | 7.336757% |
Noise dominated data is calculated using 1-second bins in cleaned event files. If a bin has >2000 counts, and if more than 50% of those come from <1% of pixels, then it is considered to be noise-dominated and hence unusable.
| Quadrant | # 1 sec bins | Bins with >0 counts | Bins with >2000 counts | High rate bins dominated by noise | Noise dominated (total time) | Noise dominated (detector-on time) | Marked lightcurve |
|---|---|---|---|---|---|---|---|
| A | 7155 | 5453 | 8 | 8 | 0.11% | 0.15% | 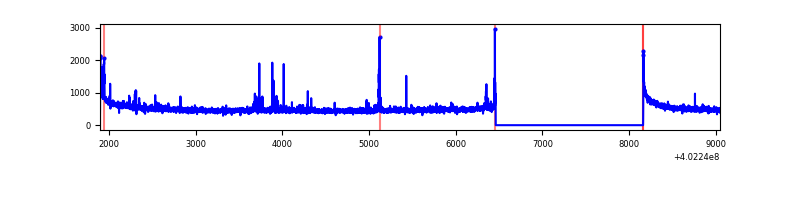 |
| B | 7155 | 5453 | 195 | 195 | 2.73% | 3.58% | 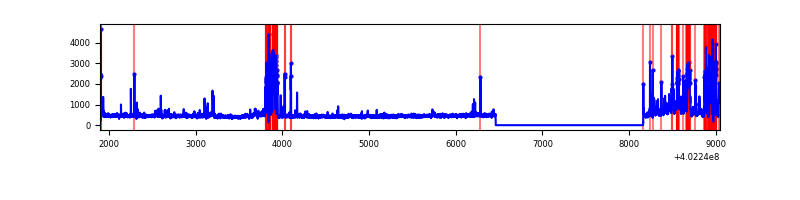 |
| C | 7155 | 5453 | 40 | 40 | 0.56% | 0.73% | 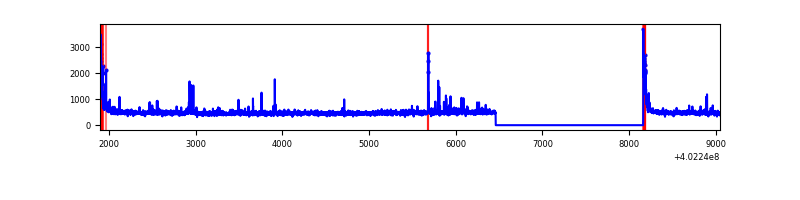 |
| D | 7155 | 5453 | 342 | 342 | 4.78% | 6.27% | 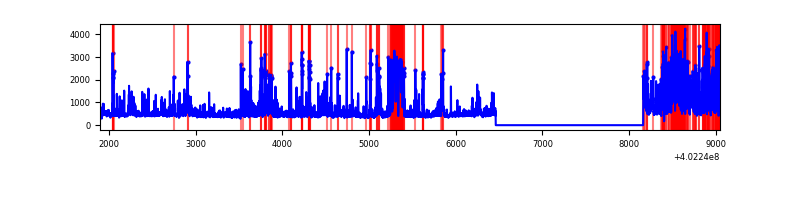 |
Top three noisy pixels from each quadrant. If the there are fewer than three noisy pixels in the level2.evt file, extra rows are filled as -1
| Pixel properties | Quadrant properties | ||||||
|---|---|---|---|---|---|---|---|
| Quadrant | DetID | PixID | Counts | Sigma | Mean | Median | Sigma |
| A | 10 | 83 | 360285 | 2966.04 | 599 | 590 | 121.3 |
| A | 12 | 227 | 45440 | 369.83 | 599 | 590 | 121.3 |
| A | 13 | 248 | 35197 | 285.37 | 599 | 590 | 121.3 |
| B | 5 | 172 | 837247 | 7490.88 | 583 | 569 | 111.7 |
| B | 0 | 213 | 44779 | 395.82 | 583 | 569 | 111.7 |
| B | 0 | 183 | 44456 | 392.93 | 583 | 569 | 111.7 |
| C | 15 | 214 | 233433 | 1713.01 | 582 | 584 | 135.9 |
| C | 0 | 10 | 159923 | 1172.22 | 582 | 584 | 135.9 |
| C | 14 | 254 | 80499 | 587.91 | 582 | 584 | 135.9 |
| D | 2 | 249 | 549774 | 3951.08 | 572 | 556 | 139.0 |
| D | 2 | 250 | 343036 | 2463.8 | 572 | 556 | 139.0 |
| D | 10 | 246 | 272627 | 1957.28 | 572 | 556 | 139.0 |
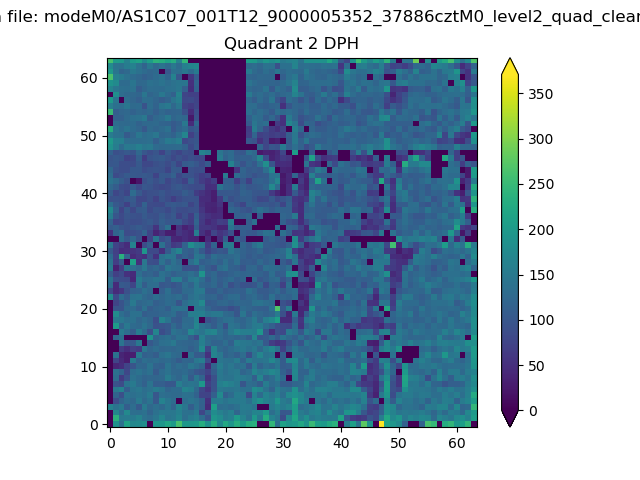
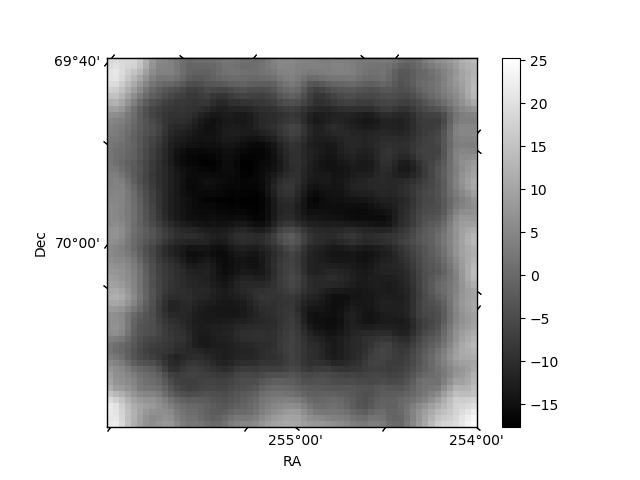
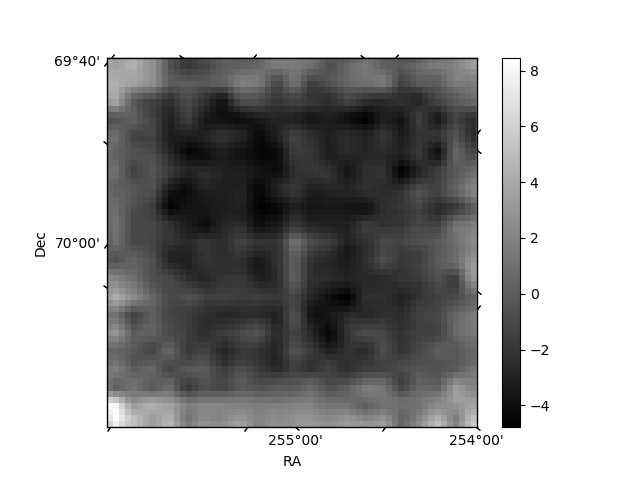
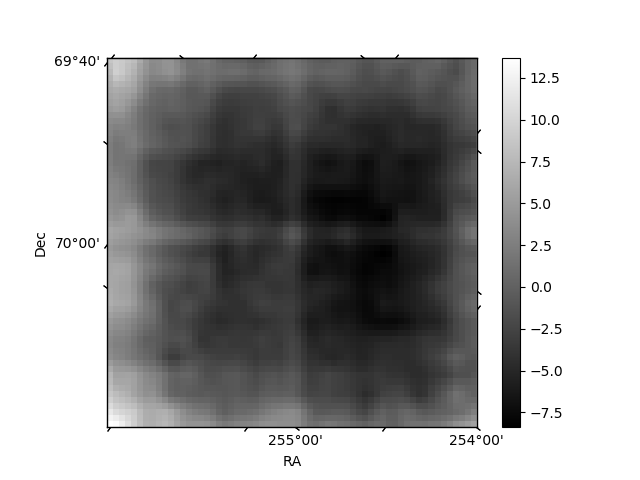
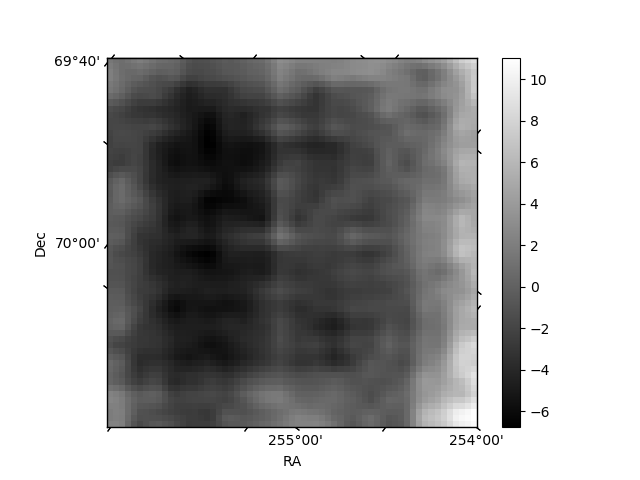
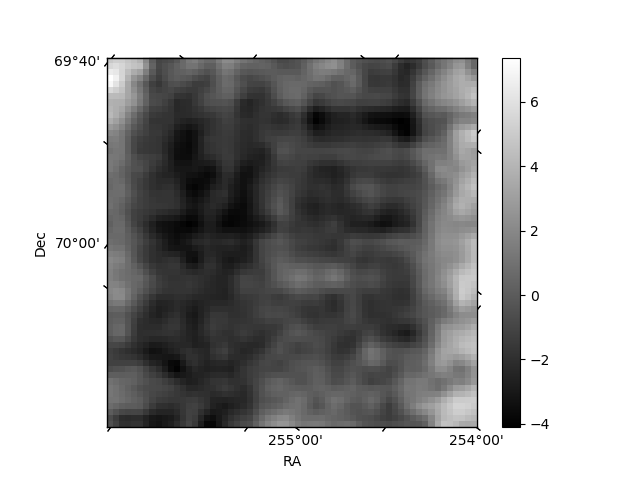
Histogram calculated using DETX and DETY for each event in the final _common_clean file
| Quadrant A | 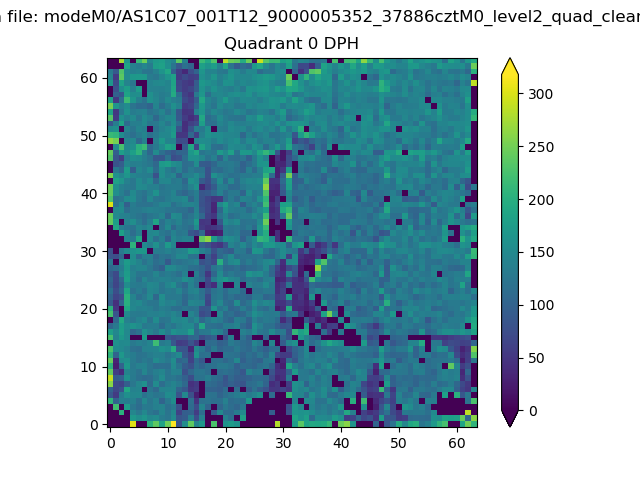 |
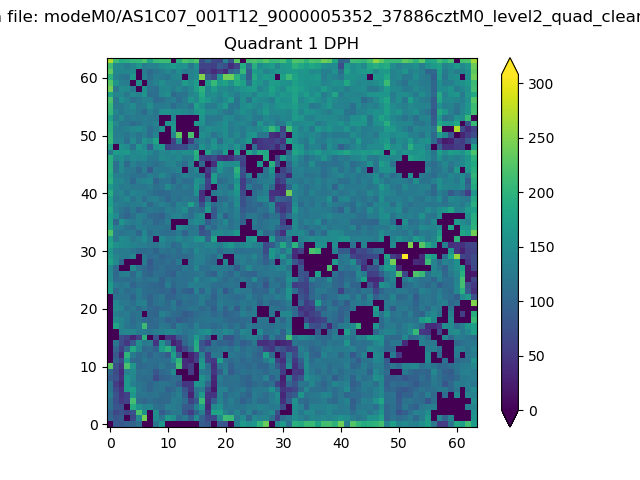 |
Quadrant B |
|---|---|---|---|
| Quadrant D | 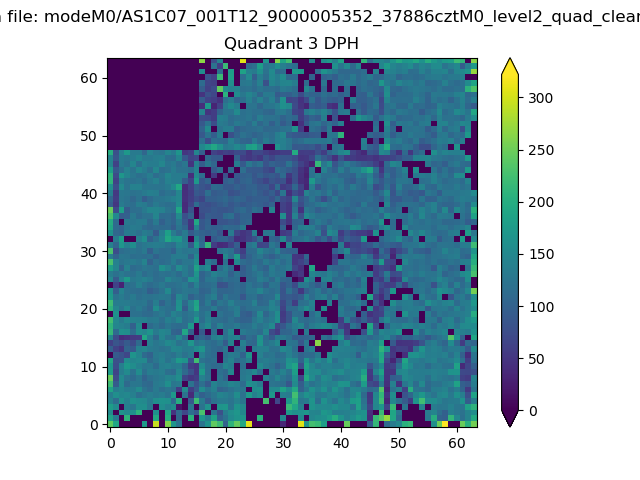 |
 |
Quadrant C |
| Plot type | Count rate plots | Images |
|---|---|---|
| Comparison with Poisson distribution Blue bars denote a histogram of data divided into 1 sec bins. Red curve is a Poisson curve with rate = median count rate of data. |
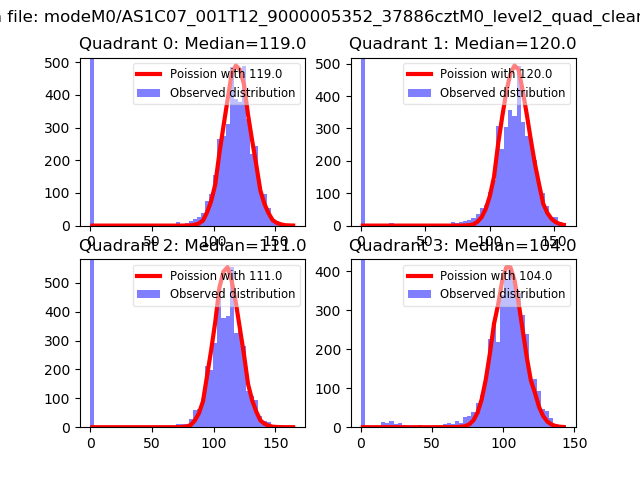 |
 |
| Quadrant-wise count rates Data is divided into 100 sec bins |
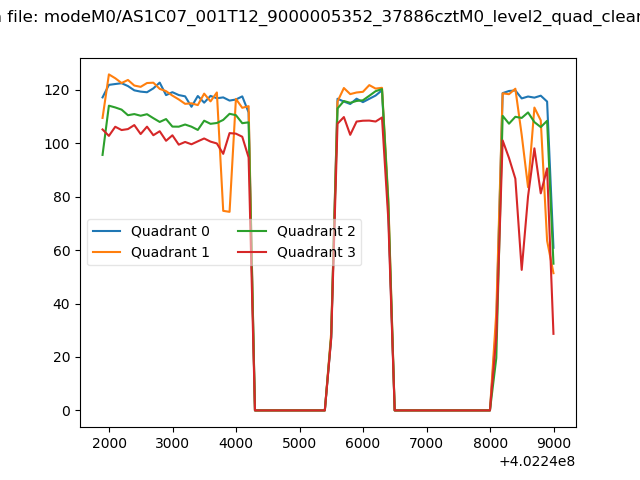 |
|
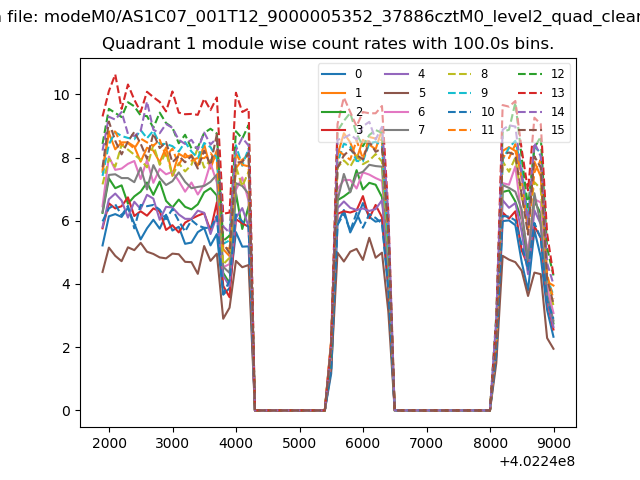
| Module-wise count rates for Quadrant A Data is divided into 100 sec bins |
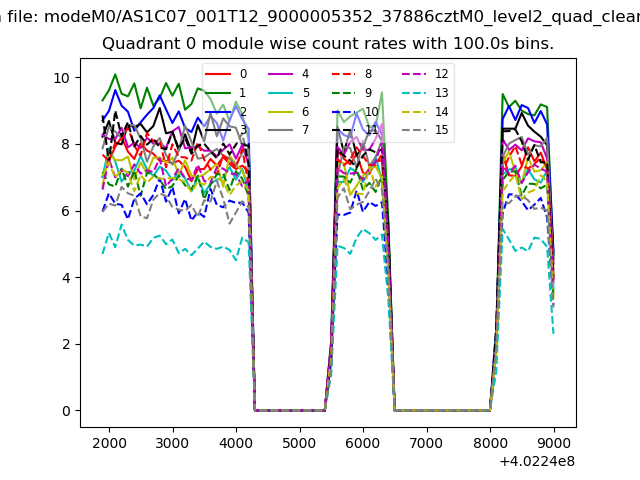 |
 |
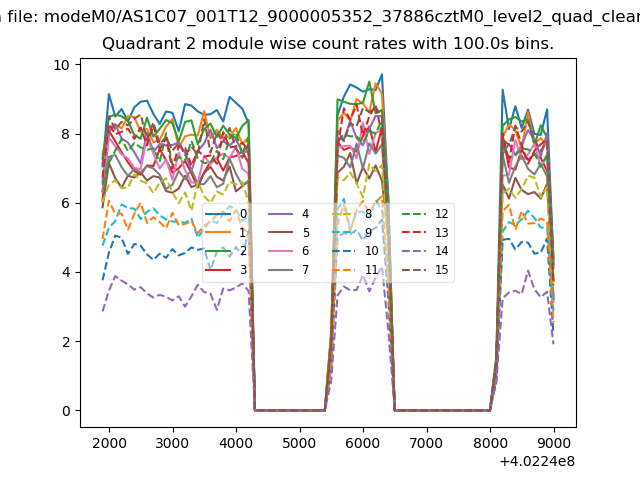
| Module-wise count rates for Quadrant B Data is divided into 100 sec bins |
 |
 |
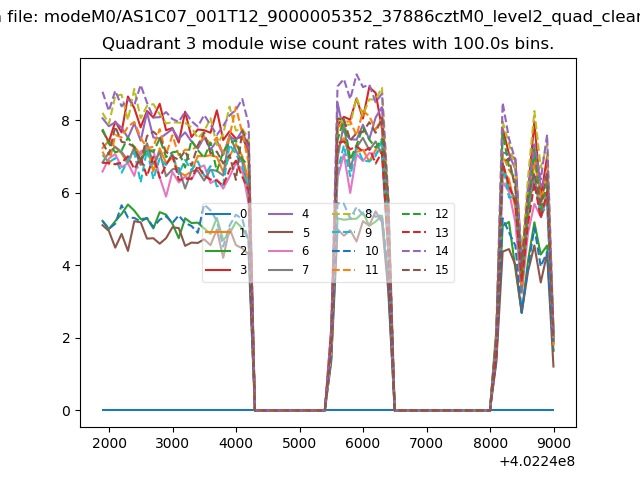
| Module-wise count rates for Quadrant C Data is divided into 100 sec bins |
 |
 |
| Module-wise count rates for Quadrant D Data is divided into 100 sec bins |
 |
 |
| Parameter | Plot |
|---|---|
| CZT HV Monitor |  |
| D_VDD | 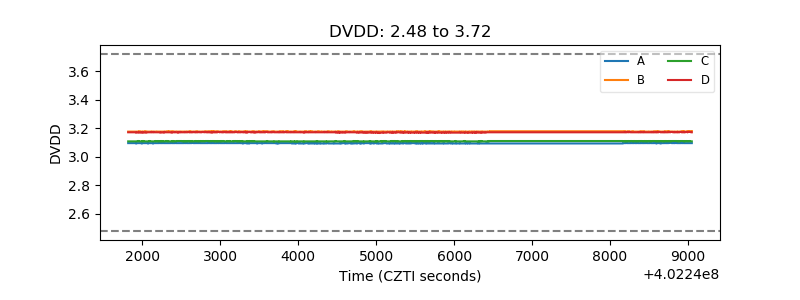 |
| Temperature 1 | 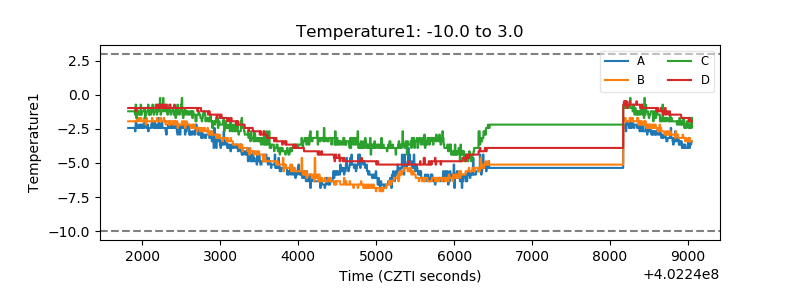 |
| Veto HV Monitor | 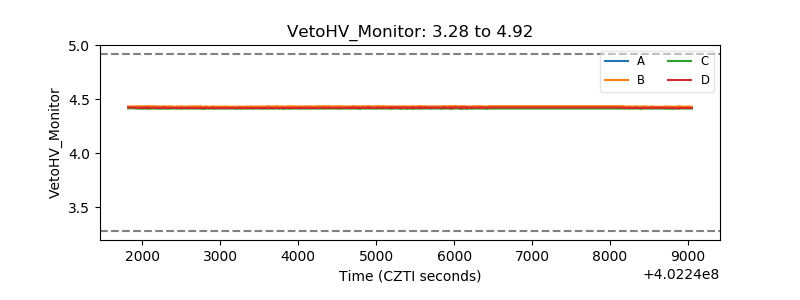 |
| Veto LLD | 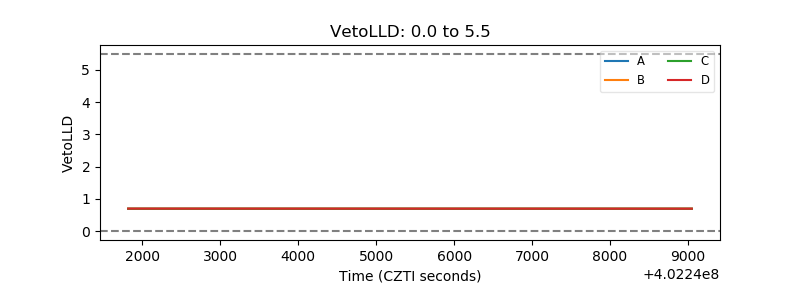 |
| Alpha Counter | 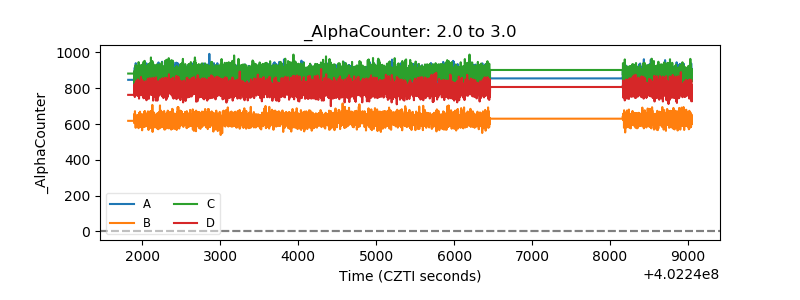 |
| _CPM_Rate | 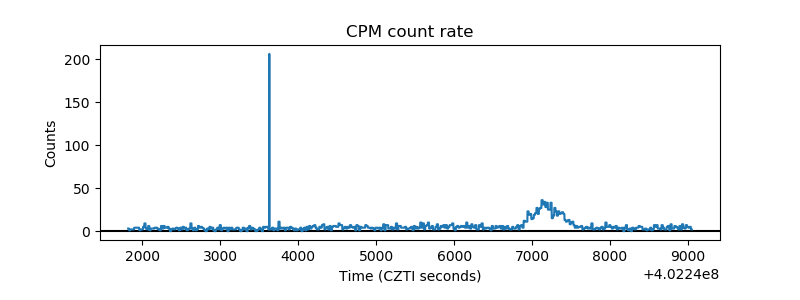 |
| CZT Counter | 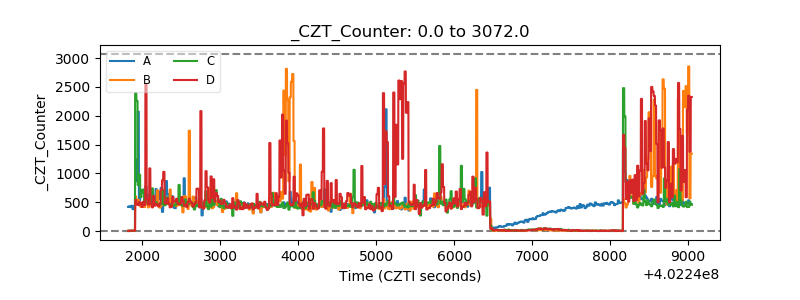 |
| +2.5 Volts monitor | 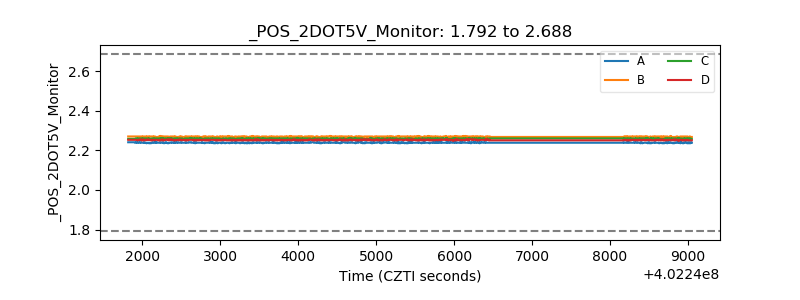 |
| +5 Volts monitor | 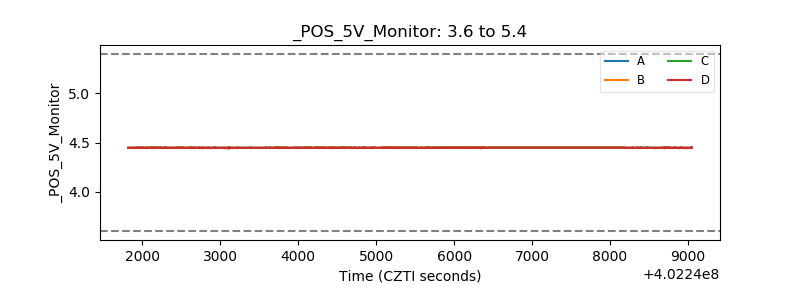 |
| _ROLL_ROT | 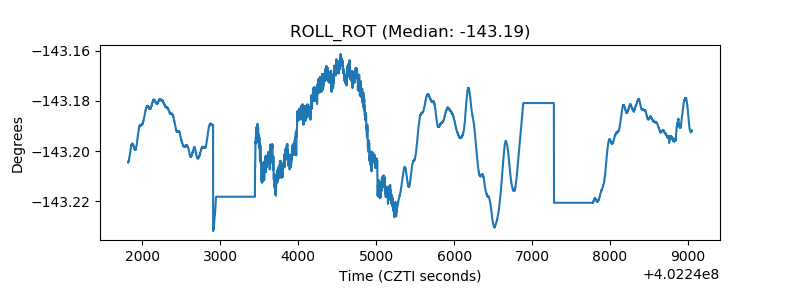 |
| _Roll_DEC | 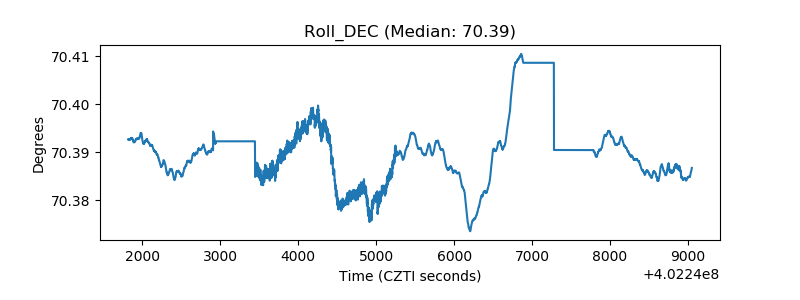 |
| _Roll_RA | 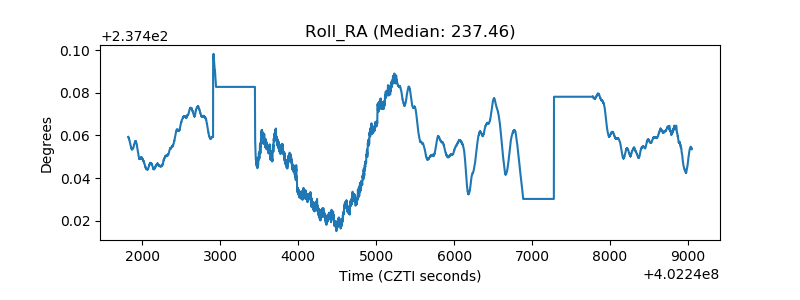 |
| Veto Counter | 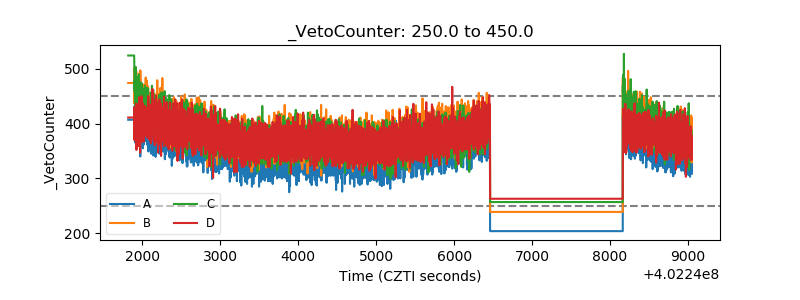 |