| Param | Original file | Final file |
|---|---|---|
| Filename | modeM0/AS1C07_001T12_9000005352_37887cztM0_level2.evt | modeM0/AS1C07_001T12_9000005352_37887cztM0_level2_quad_clean.evt |
| Size (bytes) | 482,155,200 | 77,247,360 |
| Size | 459.8 MB | 73.7 MB |
| Events in quadrant A | 2,862,442 | 520,736 |
| Events in quadrant B | 3,538,929 | 508,931 |
| Events in quadrant C | 2,911,847 | 490,490 |
| Events in quadrant D | 4,897,581 | 415,737 |
| Mode M9 | |||
|---|---|---|---|
| Quadrant | BADHDUFLAG | Total packets | Discarded packets |
| A | 0 | 17 | 0 |
| B | 0 | 17 | 0 |
| C | 0 | 17 | 0 |
| D | 0 | 18 | 0 |
| Mode M0 | |||
|---|---|---|---|
| Quadrant | BADHDUFLAG | Total packets | Discarded packets |
| A | 0 | 12159 | 4 |
| B | 0 | 14376 | 2 |
| C | 0 | 12303 | 5 |
| D | 0 | 18592 | 5 |
| Mode SS | |||
|---|---|---|---|
| Quadrant | BADHDUFLAG | Total packets | Discarded packets |
| A | 0 | 118 | 0 |
| B | 0 | 118 | 0 |
| C | 0 | 118 | 0 |
| D | 0 | 118 | 0 |
| Quadrant | Total seconds | Saturated seconds | Saturation percentage |
|---|---|---|---|
| A | 5762 | 11 | 0.190906% |
| B | 5763 | 181 | 3.140725% |
| C | 5761 | 43 | 0.746398% |
| D | 5761 | 633 | 10.987676% |
Noise dominated data is calculated using 1-second bins in cleaned event files. If a bin has >2000 counts, and if more than 50% of those come from <1% of pixels, then it is considered to be noise-dominated and hence unusable.
| Quadrant | # 1 sec bins | Bins with >0 counts | Bins with >2000 counts | High rate bins dominated by noise | Noise dominated (total time) | Noise dominated (detector-on time) | Marked lightcurve |
|---|---|---|---|---|---|---|---|
| A | 7165 | 5764 | 6 | 6 | 0.08% | 0.10% | 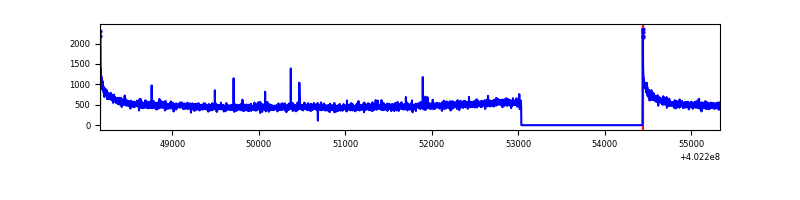 |
| B | 7165 | 5764 | 155 | 155 | 2.16% | 2.69% | 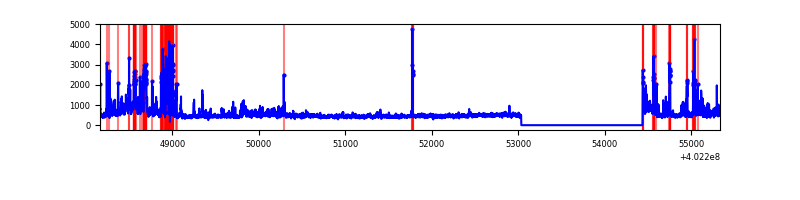 |
| C | 7165 | 5763 | 39 | 39 | 0.54% | 0.68% | 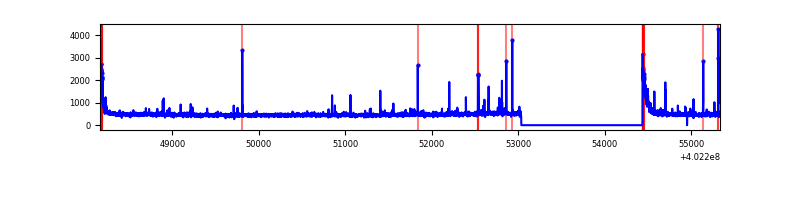 |
| D | 7165 | 5763 | 481 | 481 | 6.71% | 8.35% | 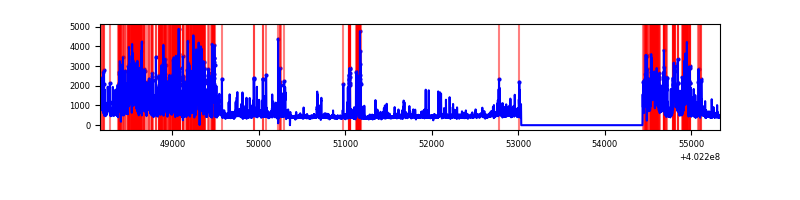 |
Top three noisy pixels from each quadrant. If the there are fewer than three noisy pixels in the level2.evt file, extra rows are filled as -1
| Pixel properties | Quadrant properties | ||||||
|---|---|---|---|---|---|---|---|
| Quadrant | DetID | PixID | Counts | Sigma | Mean | Median | Sigma |
| A | 10 | 83 | 374386 | 2914.41 | 633 | 619 | 128.2 |
| A | 13 | 6 | 15110 | 112.99 | 633 | 619 | 128.2 |
| A | 12 | 189 | 9574 | 69.83 | 633 | 619 | 128.2 |
| B | 5 | 172 | 752799 | 6332.27 | 622 | 606 | 118.8 |
| B | 0 | 213 | 149244 | 1251.3 | 622 | 606 | 118.8 |
| B | 0 | 183 | 101033 | 845.44 | 622 | 606 | 118.8 |
| C | 15 | 214 | 243912 | 1702.22 | 613 | 616 | 142.9 |
| C | 0 | 10 | 158424 | 1104.1 | 613 | 616 | 142.9 |
| C | 14 | 254 | 103278 | 718.27 | 613 | 616 | 142.9 |
| D | 2 | 249 | 1054324 | 7270.59 | 592 | 575 | 144.9 |
| D | 2 | 250 | 496447 | 3421.38 | 592 | 575 | 144.9 |
| D | 12 | 233 | 302279 | 2081.68 | 592 | 575 | 144.9 |
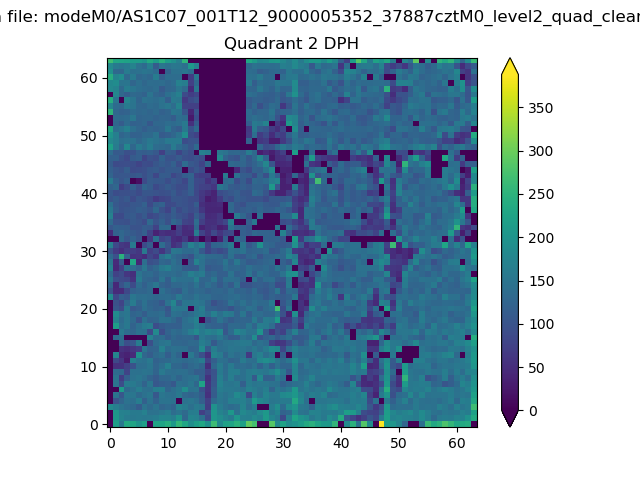
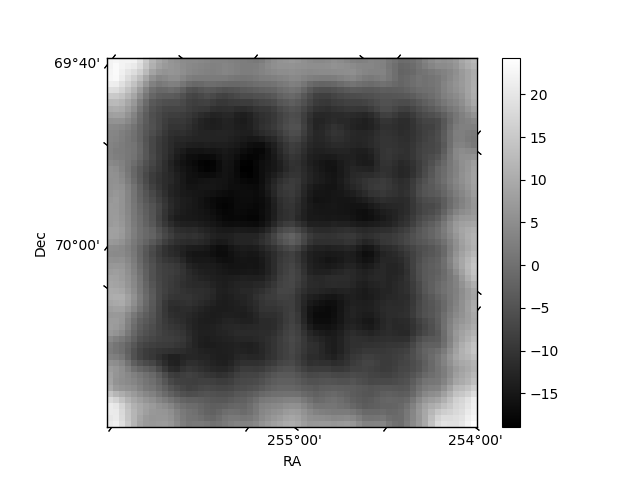
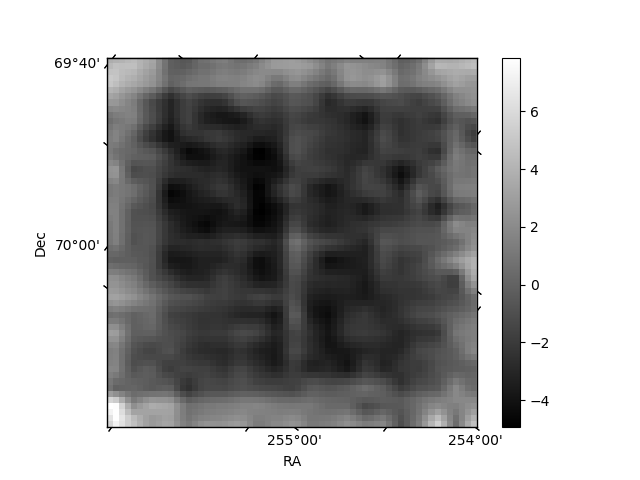
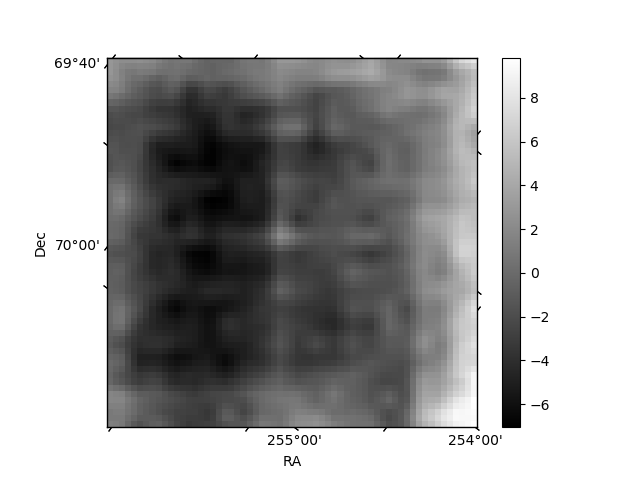
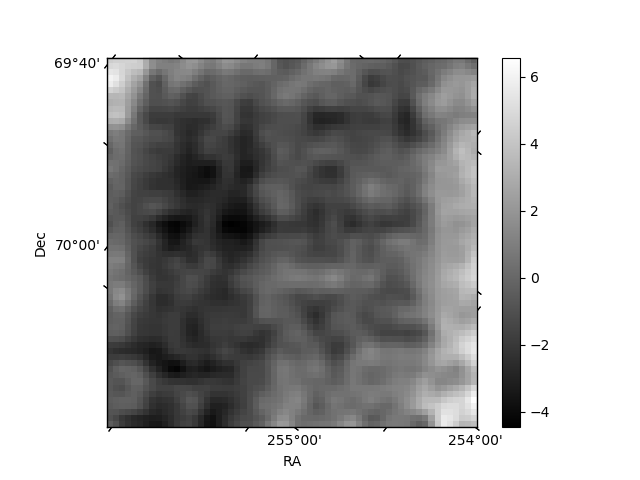
Histogram calculated using DETX and DETY for each event in the final _common_clean file
| Quadrant A | 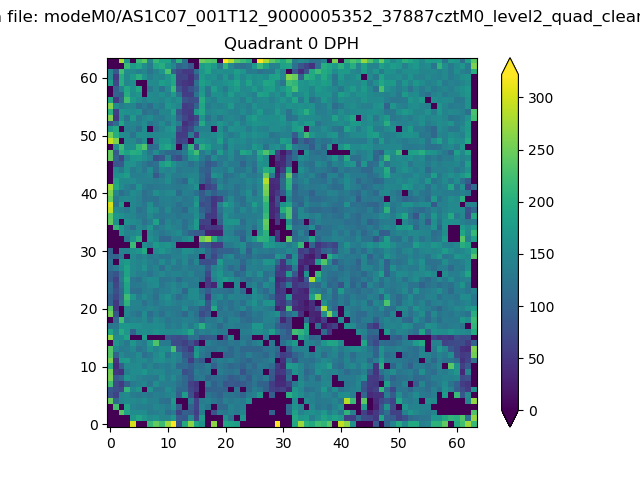 |
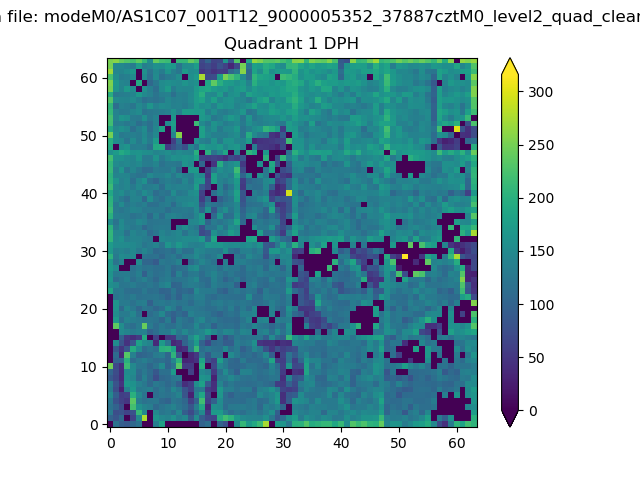 |
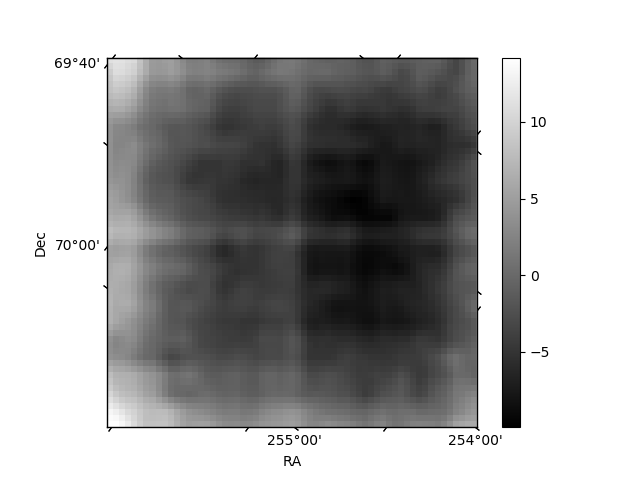
Quadrant B |
|---|---|---|---|
| Quadrant D | 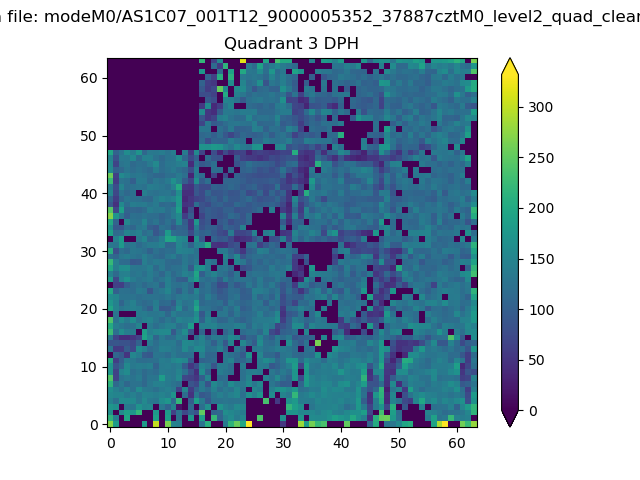 |
 |
Quadrant C |
| Plot type | Count rate plots | Images |
|---|---|---|
| Comparison with Poisson distribution Blue bars denote a histogram of data divided into 1 sec bins. Red curve is a Poisson curve with rate = median count rate of data. |
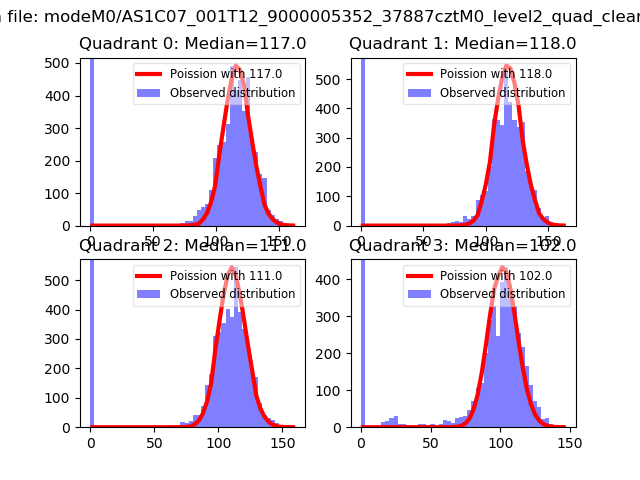 |
 |
| Quadrant-wise count rates Data is divided into 100 sec bins |
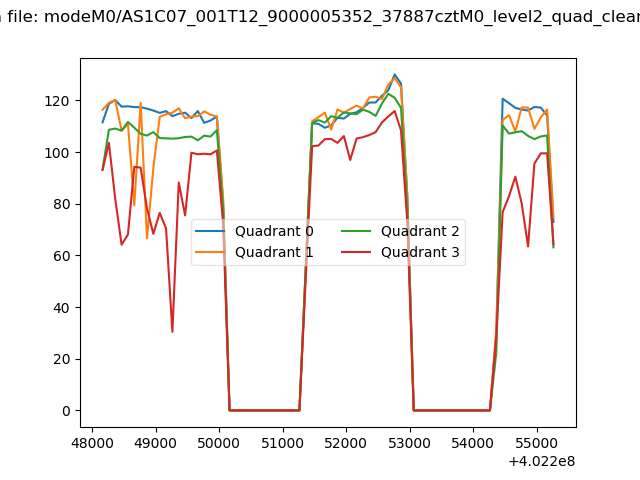 |
|
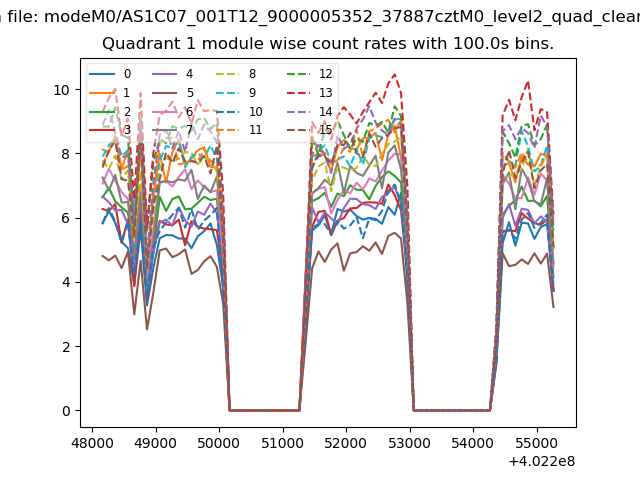
| Module-wise count rates for Quadrant A Data is divided into 100 sec bins |
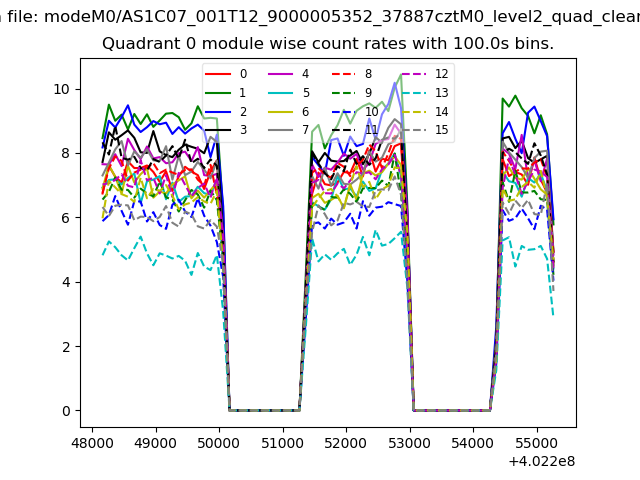 |
 |
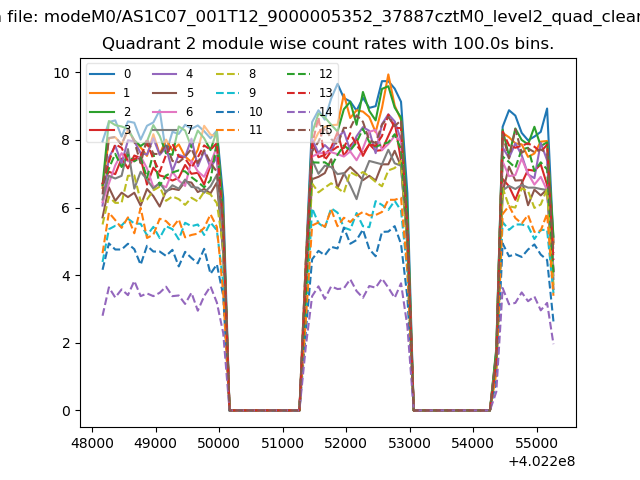
| Module-wise count rates for Quadrant B Data is divided into 100 sec bins |
 |
 |
| Module-wise count rates for Quadrant C Data is divided into 100 sec bins |
 |
 |
| Module-wise count rates for Quadrant D Data is divided into 100 sec bins |
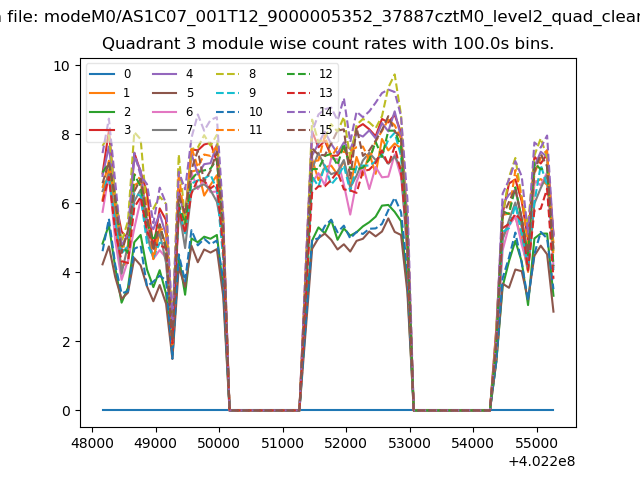 |
 |
| Parameter | Plot |
|---|---|
| CZT HV Monitor | 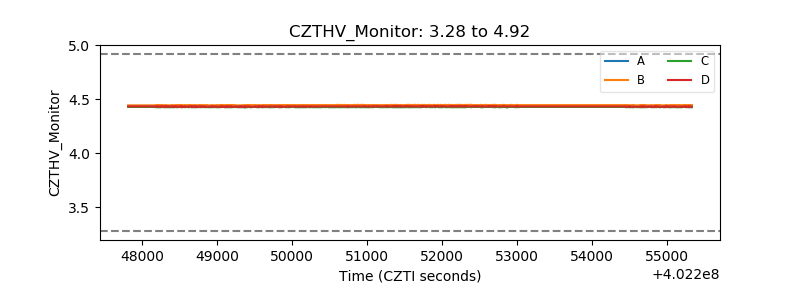 |
| D_VDD | 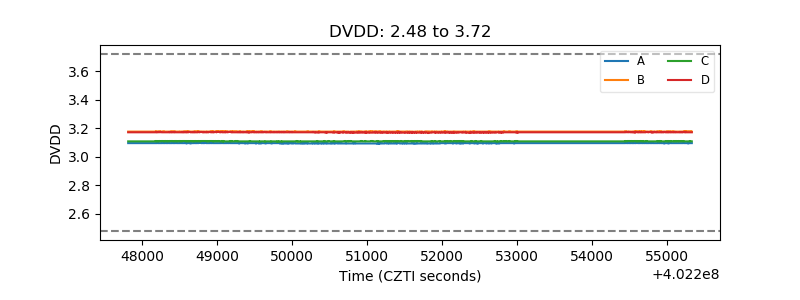 |
| Temperature 1 | 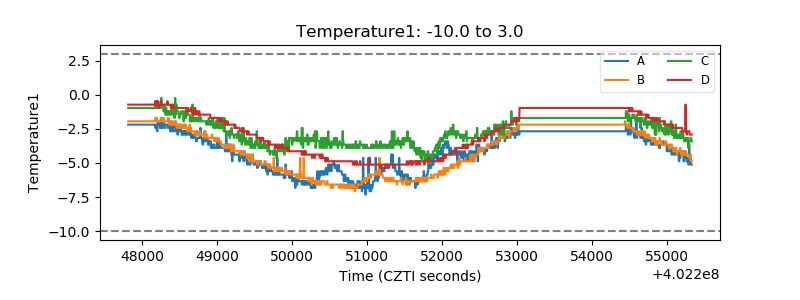 |
| Veto HV Monitor | 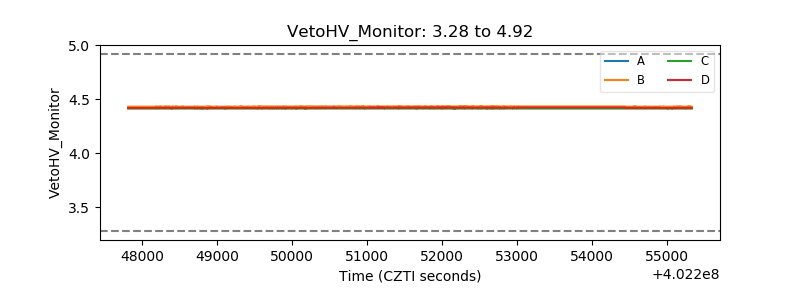 |
| Veto LLD | 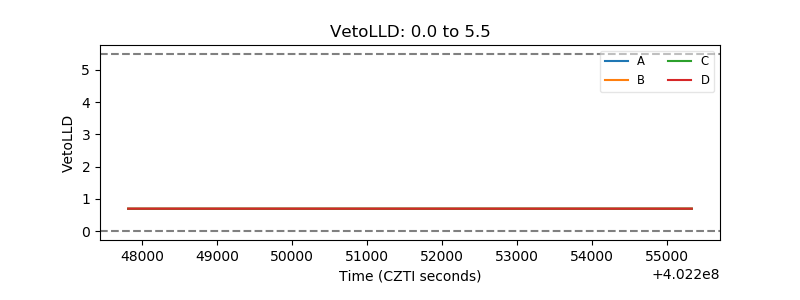 |
| Alpha Counter | 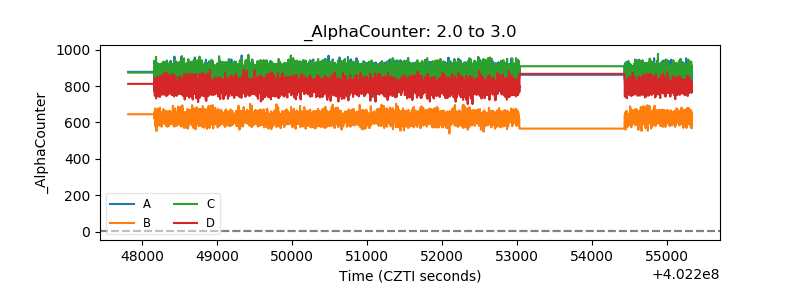 |
| _CPM_Rate |  |
| CZT Counter | 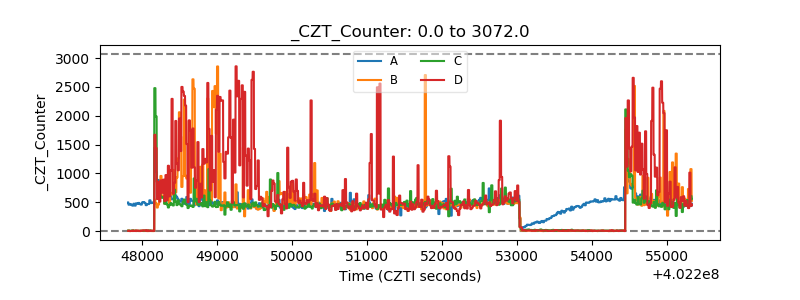 |
| +2.5 Volts monitor | 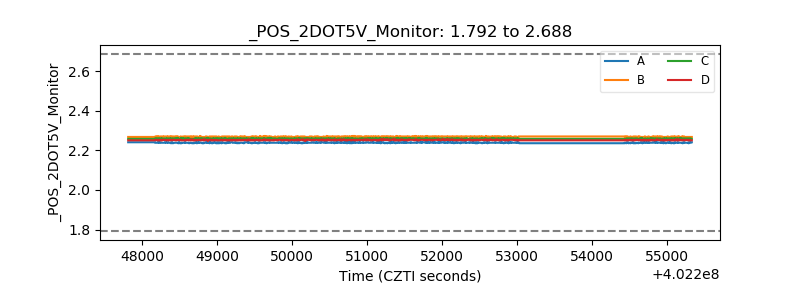 |
| +5 Volts monitor | 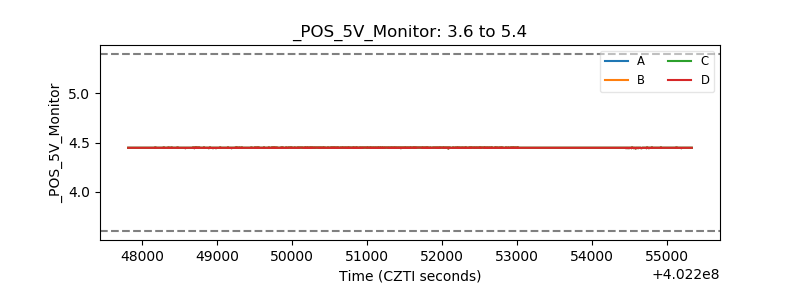 |
| _ROLL_ROT | 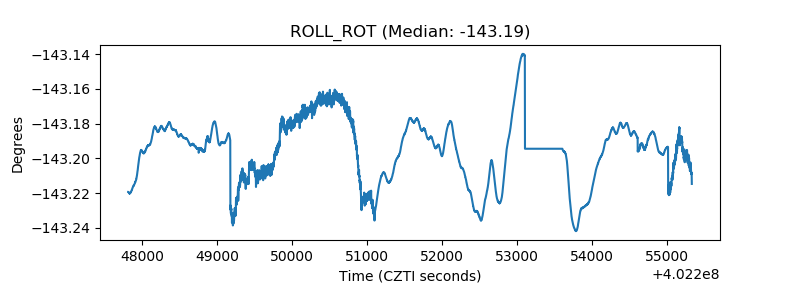 |
| _Roll_DEC | 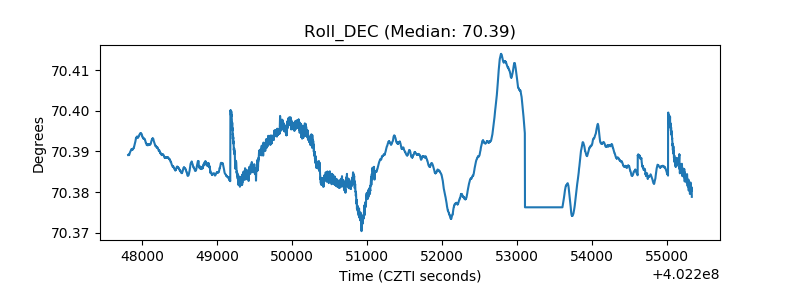 |
| _Roll_RA | 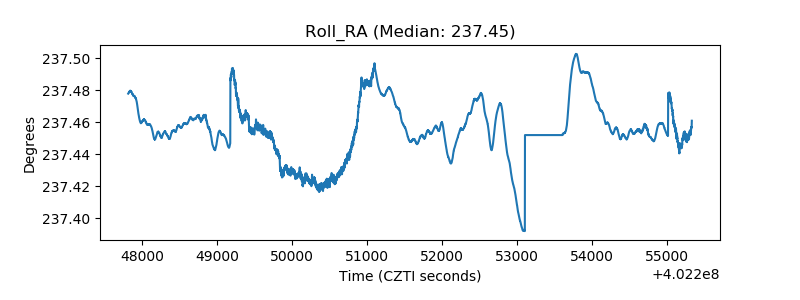 |
| Veto Counter | 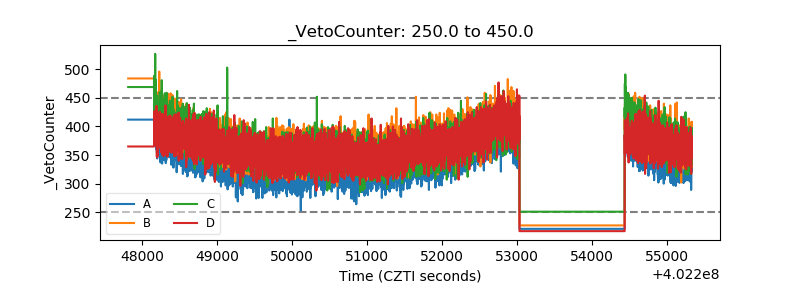 |