| Param | Original file | Final file |
|---|---|---|
| Filename | modeM0/AS1C07_001T12_9000005352_37888cztM0_level2.evt | modeM0/AS1C07_001T12_9000005352_37888cztM0_level2_quad_clean.evt |
| Size (bytes) | 443,471,040 | 78,848,640 |
| Size | 422.9 MB | 75.2 MB |
| Events in quadrant A | 2,888,100 | 520,472 |
| Events in quadrant B | 3,025,276 | 523,893 |
| Events in quadrant C | 2,914,853 | 491,609 |
| Events in quadrant D | 4,209,487 | 447,174 |
| Mode M9 | |||
|---|---|---|---|
| Quadrant | BADHDUFLAG | Total packets | Discarded packets |
| A | 0 | 21 | 0 |
| B | 0 | 21 | 0 |
| C | 0 | 21 | 0 |
| D | 0 | 22 | 0 |
| Mode M0 | |||
|---|---|---|---|
| Quadrant | BADHDUFLAG | Total packets | Discarded packets |
| A | 0 | 12274 | 5 |
| B | 0 | 12982 | 6 |
| C | 0 | 12331 | 3 |
| D | 0 | 16571 | 18 |
| Mode SS | |||
|---|---|---|---|
| Quadrant | BADHDUFLAG | Total packets | Discarded packets |
| A | 0 | 117 | 0 |
| B | 0 | 118 | 0 |
| C | 0 | 118 | 0 |
| D | 0 | 118 | 0 |
| Quadrant | Total seconds | Saturated seconds | Saturation percentage |
|---|---|---|---|
| A | 5786 | 16 | 0.276530% |
| B | 5784 | 68 | 1.175657% |
| C | 5786 | 44 | 0.760456% |
| D | 5783 | 284 | 4.910946% |
Noise dominated data is calculated using 1-second bins in cleaned event files. If a bin has >2000 counts, and if more than 50% of those come from <1% of pixels, then it is considered to be noise-dominated and hence unusable.
| Quadrant | # 1 sec bins | Bins with >0 counts | Bins with >2000 counts | High rate bins dominated by noise | Noise dominated (total time) | Noise dominated (detector-on time) | Marked lightcurve |
|---|---|---|---|---|---|---|---|
| A | 7099 | 5788 | 8 | 8 | 0.11% | 0.14% | 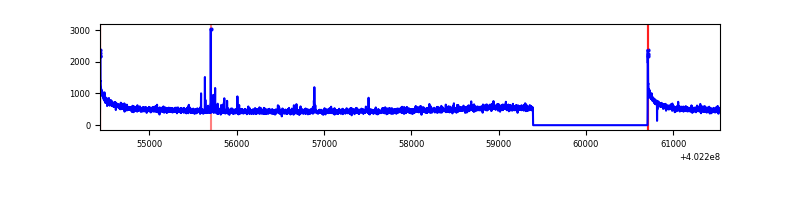 |
| B | 7099 | 5787 | 43 | 43 | 0.61% | 0.74% | 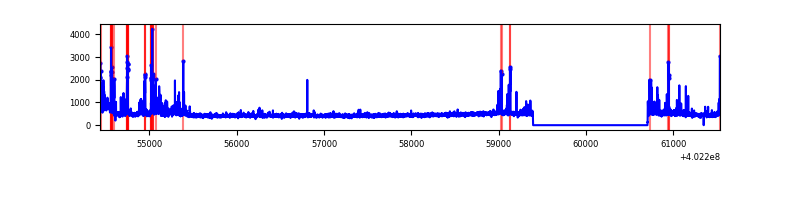 |
| C | 7099 | 5788 | 31 | 31 | 0.44% | 0.54% | 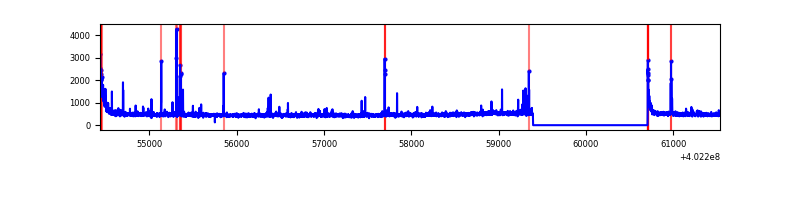 |
| D | 7099 | 5786 | 216 | 216 | 3.04% | 3.73% | 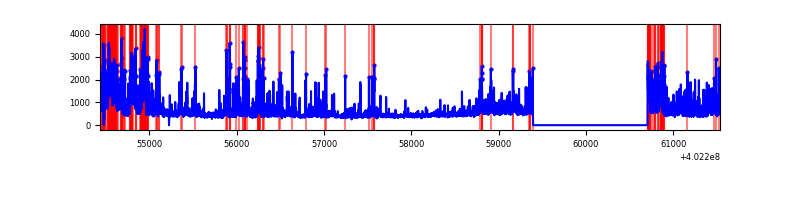 |
Top three noisy pixels from each quadrant. If the there are fewer than three noisy pixels in the level2.evt file, extra rows are filled as -1
| Pixel properties | Quadrant properties | ||||||
|---|---|---|---|---|---|---|---|
| Quadrant | DetID | PixID | Counts | Sigma | Mean | Median | Sigma |
| A | 10 | 83 | 373940 | 2885.65 | 637 | 623 | 129.4 |
| A | 7 | 3 | 16657 | 123.94 | 637 | 623 | 129.4 |
| A | 13 | 6 | 13986 | 103.29 | 637 | 623 | 129.4 |
| B | 5 | 172 | 303430 | 2469.42 | 632 | 615 | 122.6 |
| B | 0 | 213 | 122604 | 994.81 | 632 | 615 | 122.6 |
| B | 4 | 81 | 22517 | 178.61 | 632 | 615 | 122.6 |
| C | 15 | 214 | 241337 | 1663.47 | 618 | 622 | 144.7 |
| C | 0 | 10 | 123407 | 848.51 | 618 | 622 | 144.7 |
| C | 14 | 254 | 120383 | 827.61 | 618 | 622 | 144.7 |
| D | 2 | 249 | 628822 | 4186.72 | 613 | 595 | 150.1 |
| D | 1 | 52 | 362747 | 2413.51 | 613 | 595 | 150.1 |
| D | 13 | 200 | 188523 | 1252.42 | 613 | 595 | 150.1 |
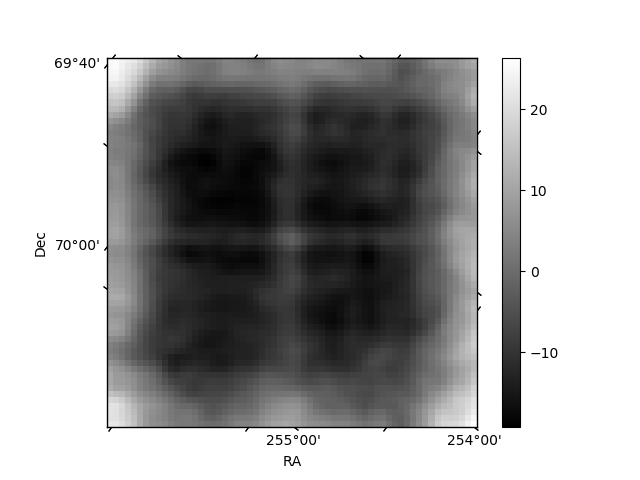
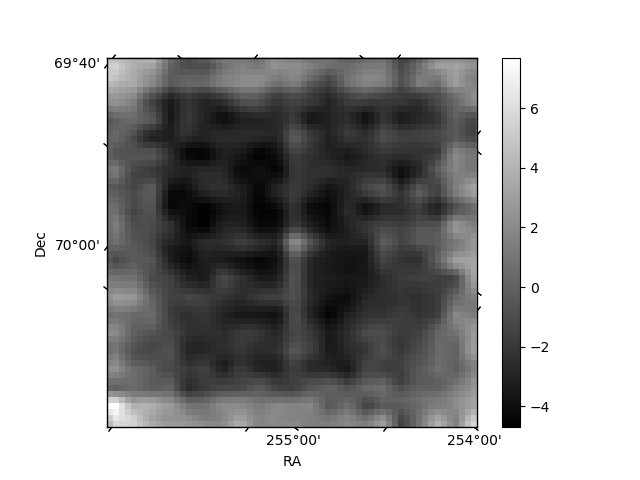
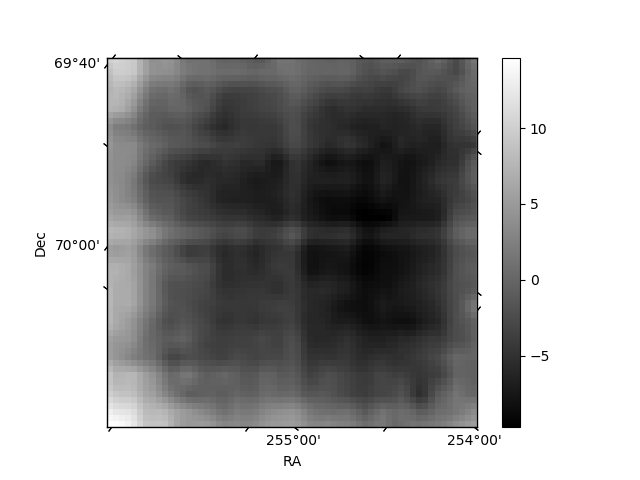
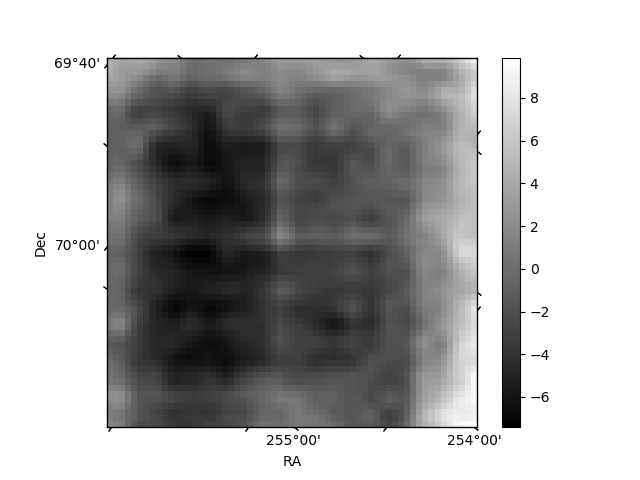
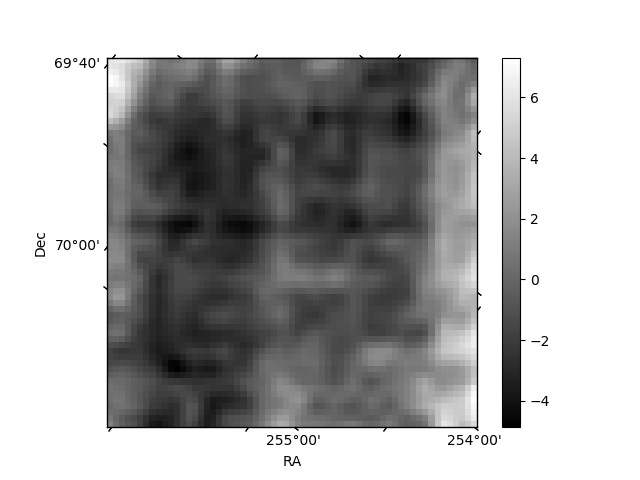
Histogram calculated using DETX and DETY for each event in the final _common_clean file
| Quadrant A | 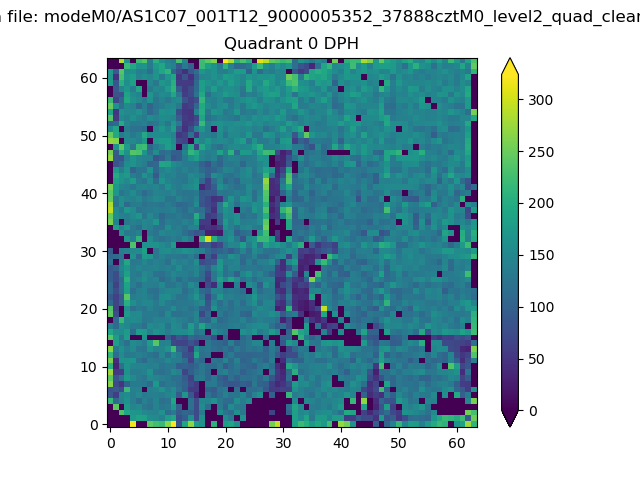 |
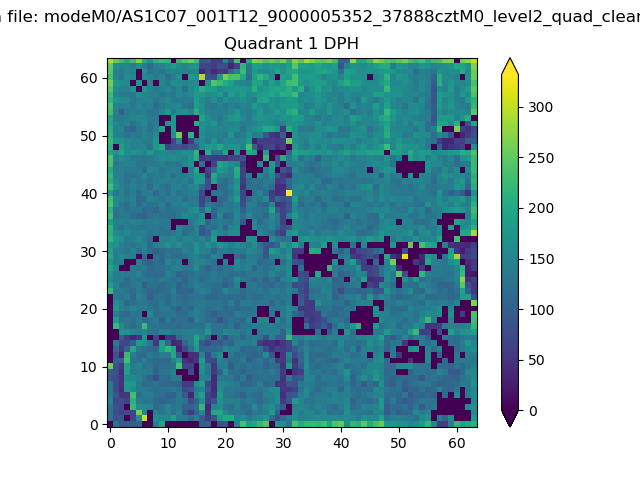 |
Quadrant B |
|---|---|---|---|
| Quadrant D | 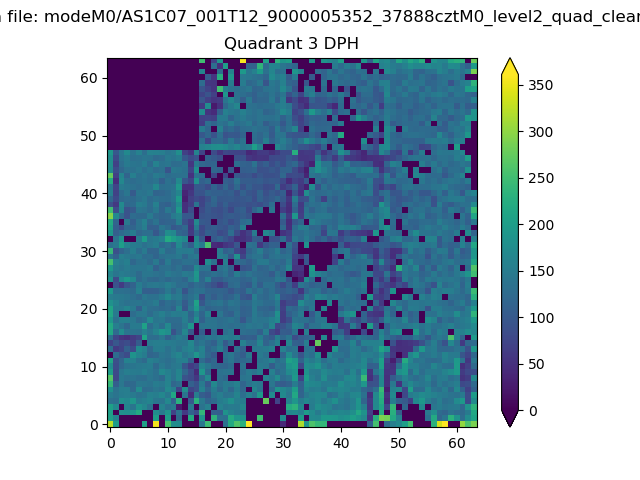 |
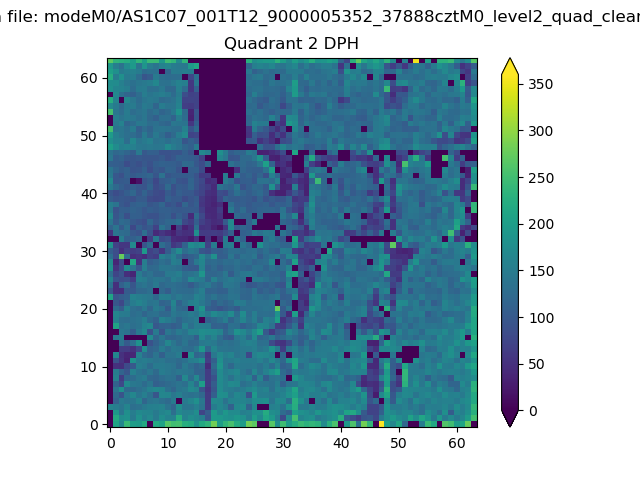 |
Quadrant C |
| Plot type | Count rate plots | Images |
|---|---|---|
| Comparison with Poisson distribution Blue bars denote a histogram of data divided into 1 sec bins. Red curve is a Poisson curve with rate = median count rate of data. |
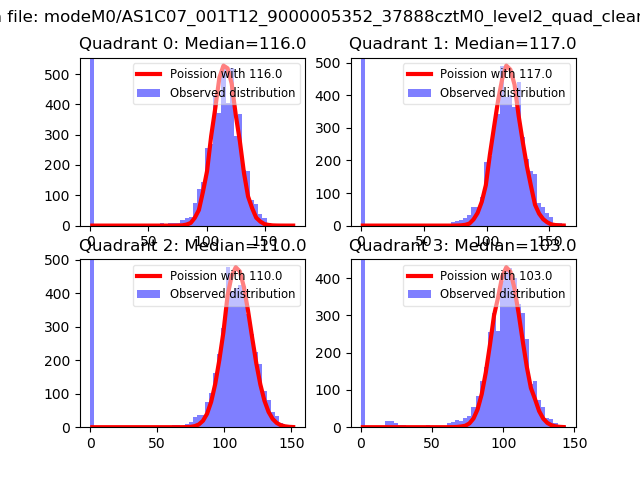 |
 |
| Quadrant-wise count rates Data is divided into 100 sec bins |
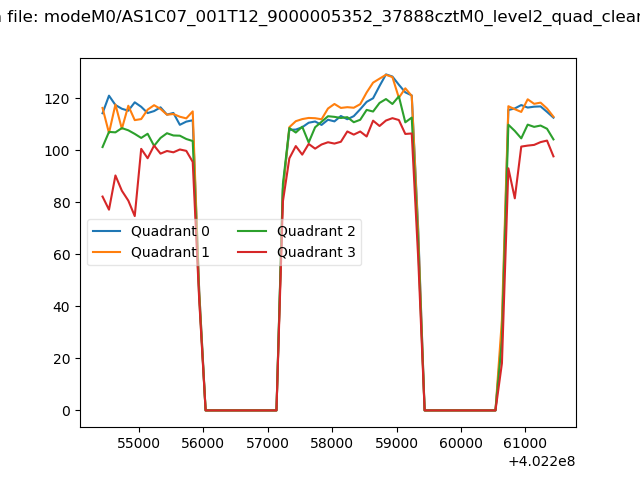 |
|
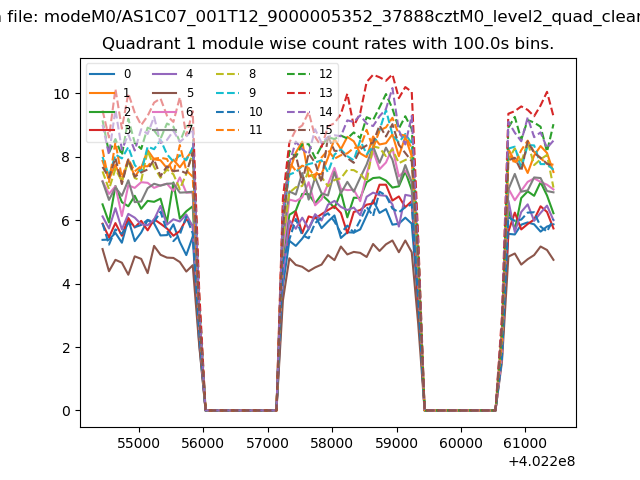
| Module-wise count rates for Quadrant A Data is divided into 100 sec bins |
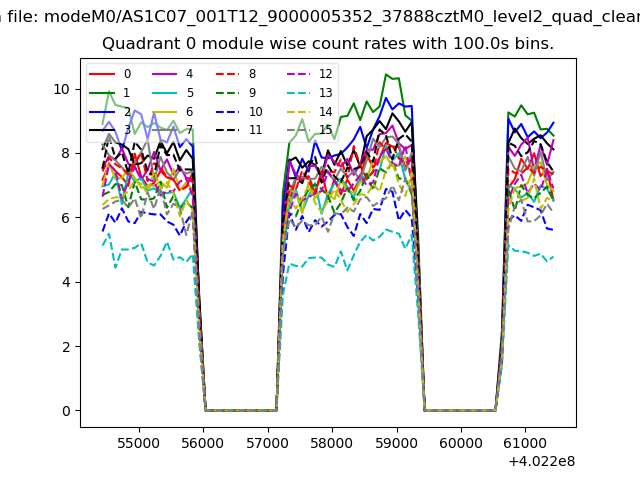 |
 |
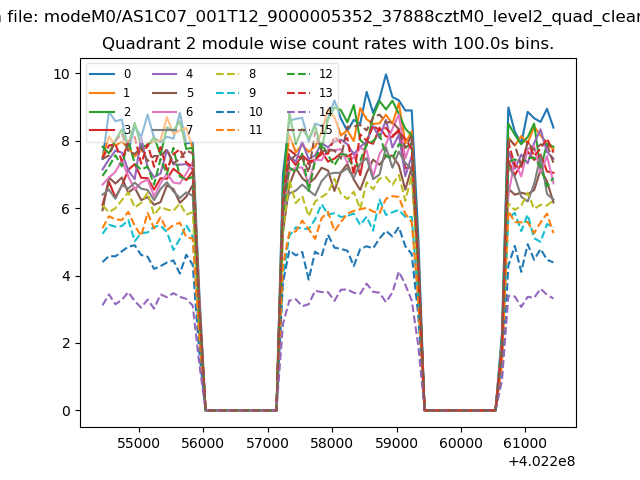
| Module-wise count rates for Quadrant B Data is divided into 100 sec bins |
 |
 |
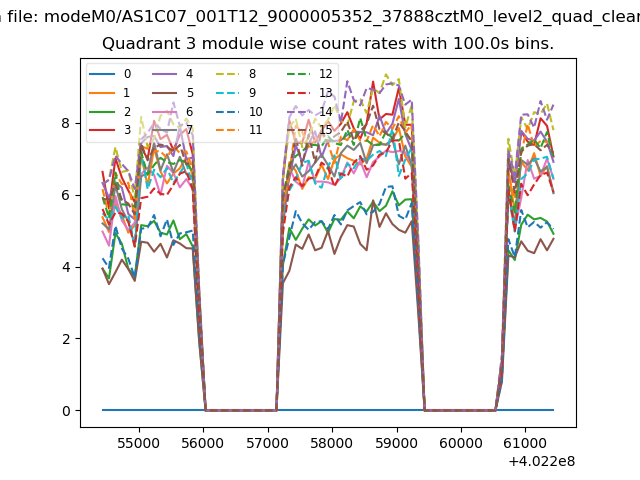
| Module-wise count rates for Quadrant C Data is divided into 100 sec bins |
 |
 |
| Module-wise count rates for Quadrant D Data is divided into 100 sec bins |
 |
 |
| Parameter | Plot |
|---|---|
| CZT HV Monitor | 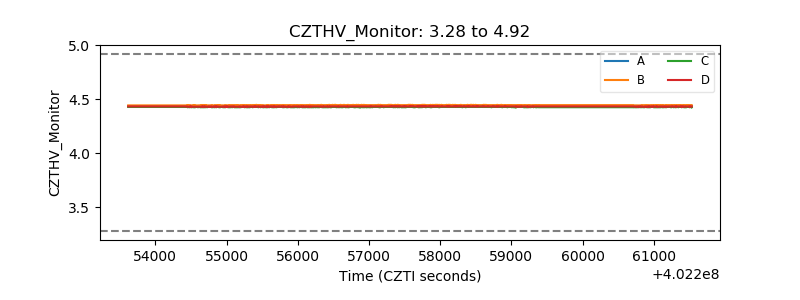 |
| D_VDD | 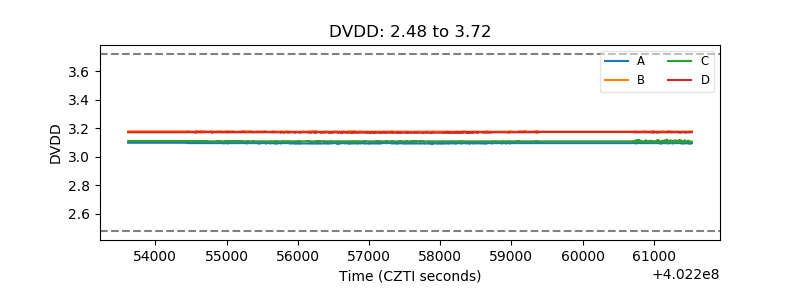 |
| Temperature 1 | 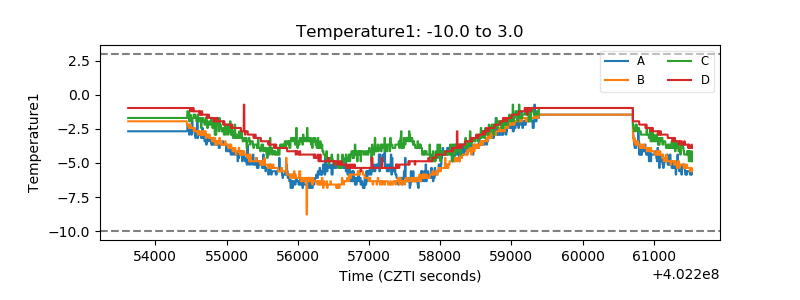 |
| Veto HV Monitor | 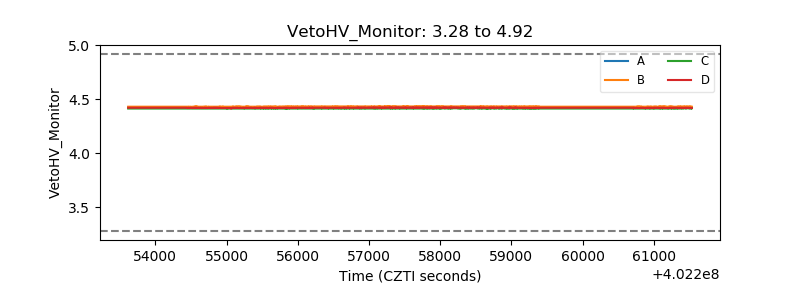 |
| Veto LLD | 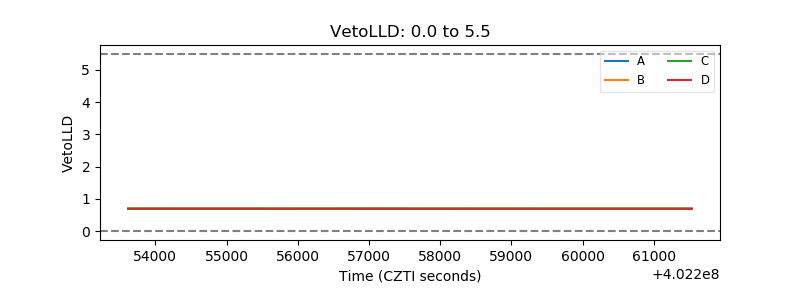 |
| Alpha Counter |  |
| _CPM_Rate | 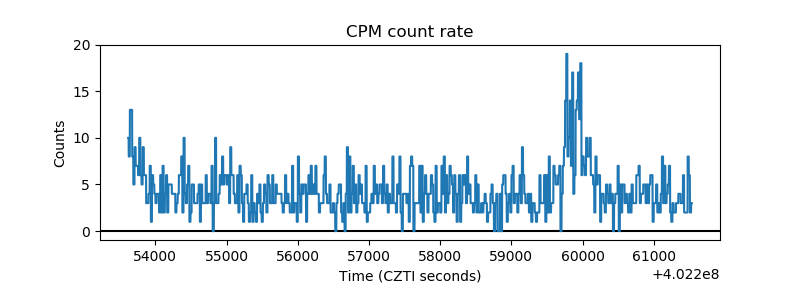 |
| CZT Counter | 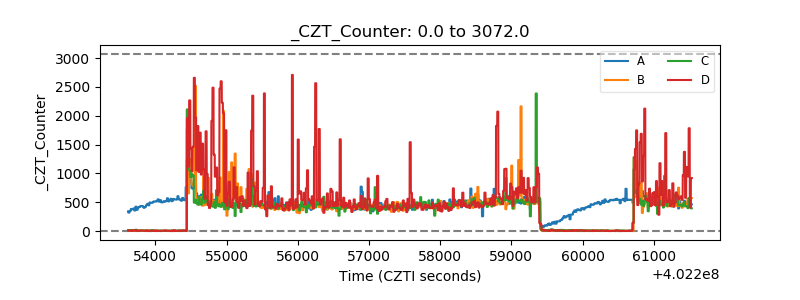 |
| +2.5 Volts monitor | 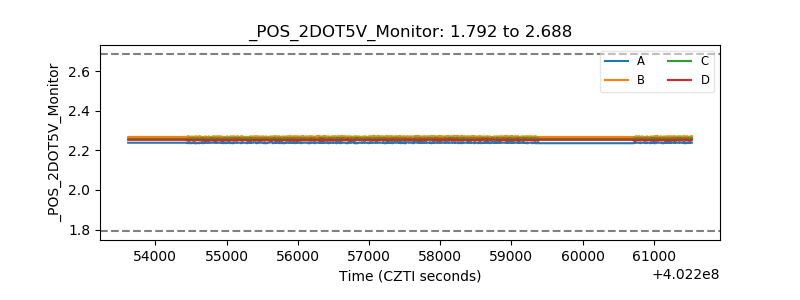 |
| +5 Volts monitor | 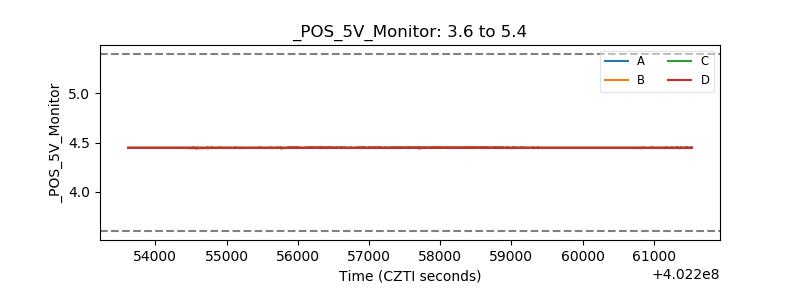 |
| _ROLL_ROT | 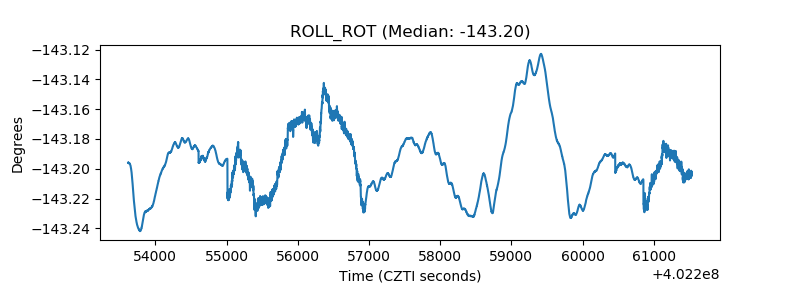 |
| _Roll_DEC | 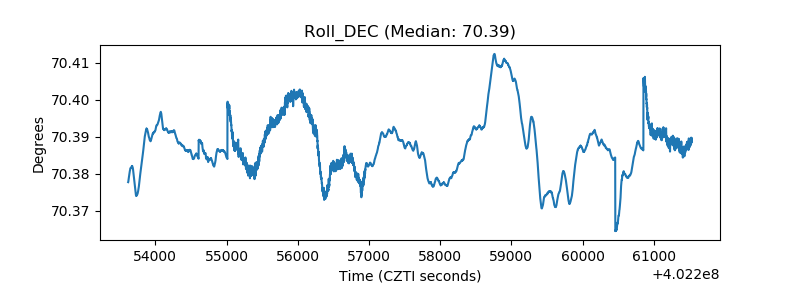 |
| _Roll_RA | 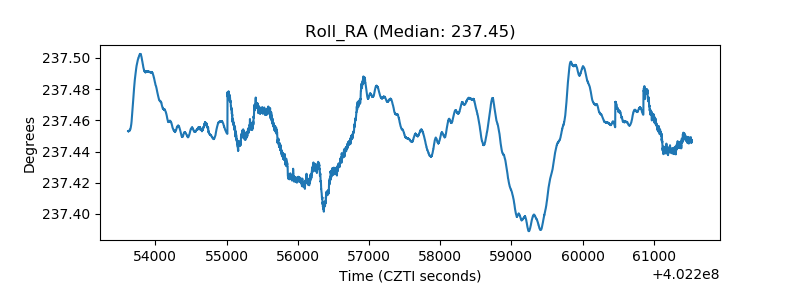 |
| Veto Counter | 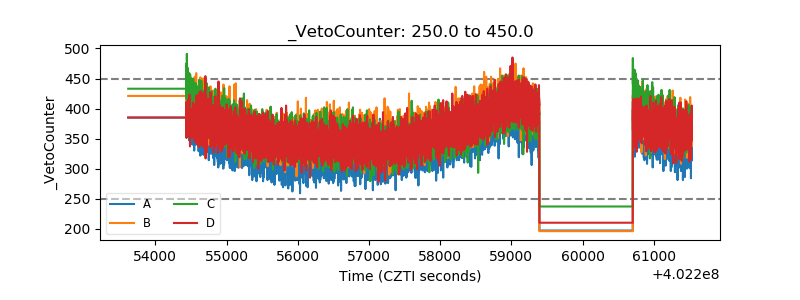 |