| Param | Original file | Final file |
|---|---|---|
| Filename | modeM0/AS1C07_001T12_9000005352_37892cztM0_level2.evt | modeM0/AS1C07_001T12_9000005352_37892cztM0_level2_quad_clean.evt |
| Size (bytes) | 416,211,840 | 71,481,600 |
| Size | 396.9 MB | 68.2 MB |
| Events in quadrant A | 2,782,592 | 450,869 |
| Events in quadrant B | 2,544,269 | 460,512 |
| Events in quadrant C | 2,929,485 | 446,041 |
| Events in quadrant D | 3,969,279 | 416,780 |
| Mode M9 | |||
|---|---|---|---|
| Quadrant | BADHDUFLAG | Total packets | Discarded packets |
| A | 0 | 25 | 0 |
| B | 0 | 25 | 0 |
| C | 0 | 25 | 0 |
| D | 0 | 26 | 0 |
| Mode M0 | |||
|---|---|---|---|
| Quadrant | BADHDUFLAG | Total packets | Discarded packets |
| A | 0 | 11822 | 3 |
| B | 0 | 11443 | 2 |
| C | 0 | 12158 | 2 |
| D | 0 | 15799 | 2 |
| Mode SS | |||
|---|---|---|---|
| Quadrant | BADHDUFLAG | Total packets | Discarded packets |
| A | 0 | 116 | 0 |
| B | 0 | 116 | 0 |
| C | 0 | 116 | 0 |
| D | 0 | 116 | 0 |
| Quadrant | Total seconds | Saturated seconds | Saturation percentage |
|---|---|---|---|
| A | 5569 | 8 | 0.143652% |
| B | 5569 | 26 | 0.466870% |
| C | 5569 | 50 | 0.897827% |
| D | 5569 | 407 | 7.308314% |
Noise dominated data is calculated using 1-second bins in cleaned event files. If a bin has >2000 counts, and if more than 50% of those come from <1% of pixels, then it is considered to be noise-dominated and hence unusable.
| Quadrant | # 1 sec bins | Bins with >0 counts | Bins with >2000 counts | High rate bins dominated by noise | Noise dominated (total time) | Noise dominated (detector-on time) | Marked lightcurve |
|---|---|---|---|---|---|---|---|
| A | 7210 | 5570 | 3 | 3 | 0.04% | 0.05% | 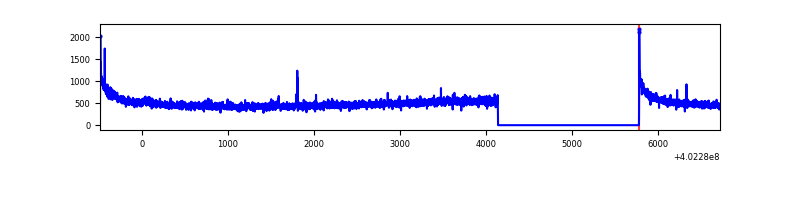 |
| B | 7210 | 5570 | 13 | 13 | 0.18% | 0.23% | 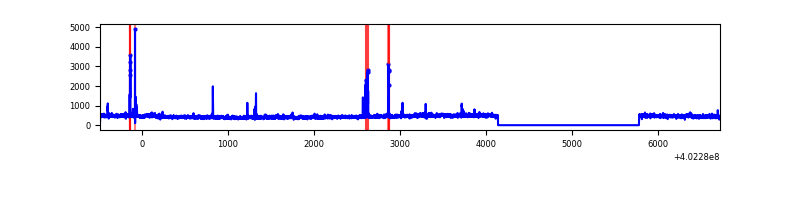 |
| C | 7210 | 5570 | 39 | 39 | 0.54% | 0.70% | 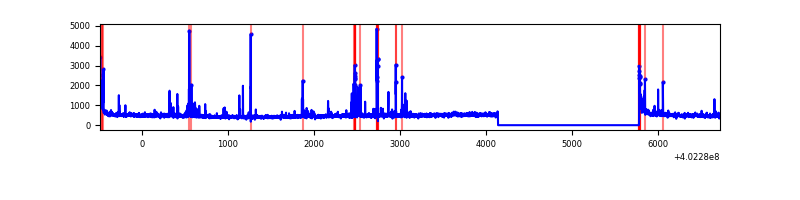 |
| D | 7210 | 5570 | 327 | 327 | 4.54% | 5.87% | 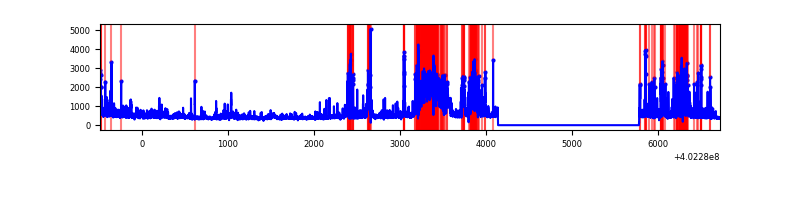 |
Top three noisy pixels from each quadrant. If the there are fewer than three noisy pixels in the level2.evt file, extra rows are filled as -1
| Pixel properties | Quadrant properties | ||||||
|---|---|---|---|---|---|---|---|
| Quadrant | DetID | PixID | Counts | Sigma | Mean | Median | Sigma |
| A | 10 | 83 | 343420 | 2789.03 | 614 | 602 | 122.9 |
| A | 15 | 222 | 29531 | 235.35 | 614 | 602 | 122.9 |
| A | 12 | 189 | 11455 | 88.3 | 614 | 602 | 122.9 |
| B | 5 | 172 | 59581 | 496.25 | 612 | 593 | 118.9 |
| B | 5 | 250 | 21539 | 176.21 | 612 | 593 | 118.9 |
| B | 4 | 81 | 17247 | 140.1 | 612 | 593 | 118.9 |
| C | 15 | 214 | 233662 | 1666.11 | 595 | 599 | 139.9 |
| C | 14 | 254 | 228592 | 1629.87 | 595 | 599 | 139.9 |
| C | 0 | 10 | 88747 | 630.15 | 595 | 599 | 139.9 |
| D | 12 | 233 | 541662 | 3774.46 | 582 | 564 | 143.4 |
| D | 1 | 52 | 410517 | 2859.65 | 582 | 564 | 143.4 |
| D | 2 | 249 | 271462 | 1889.67 | 582 | 564 | 143.4 |
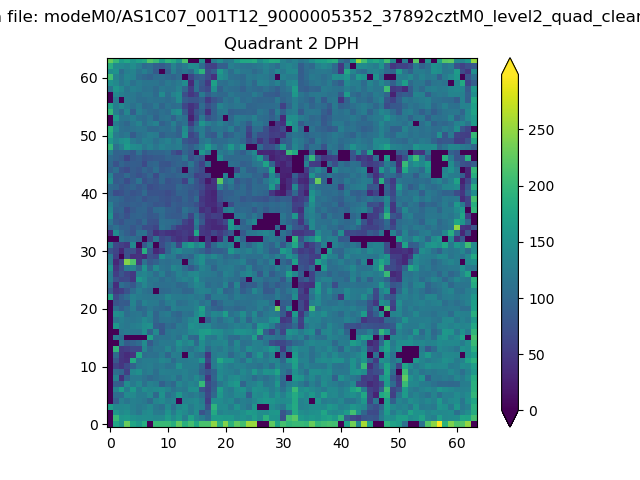
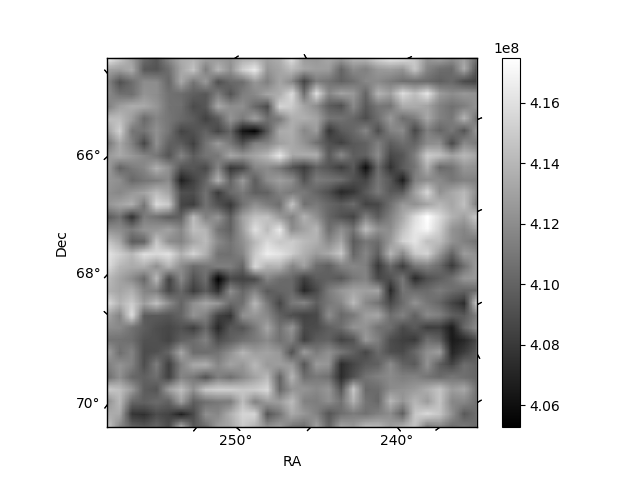
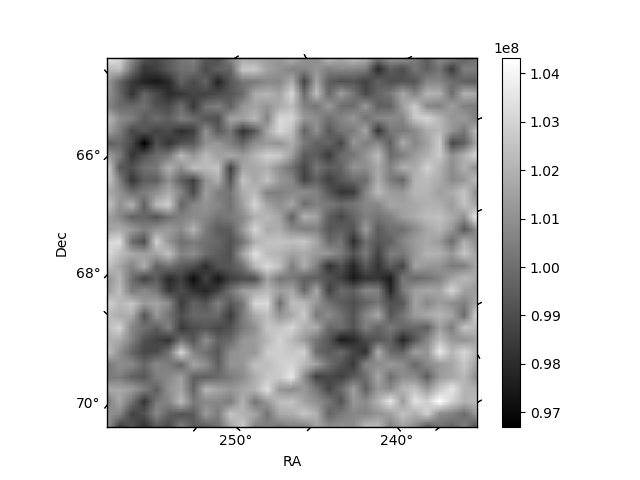
Histogram calculated using DETX and DETY for each event in the final _common_clean file
| Quadrant A | 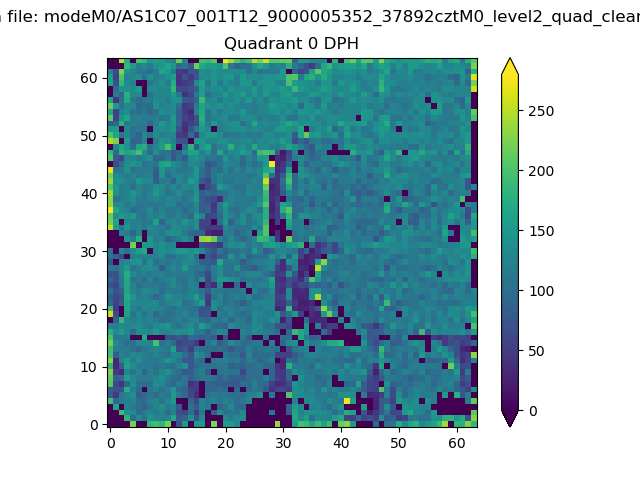 |
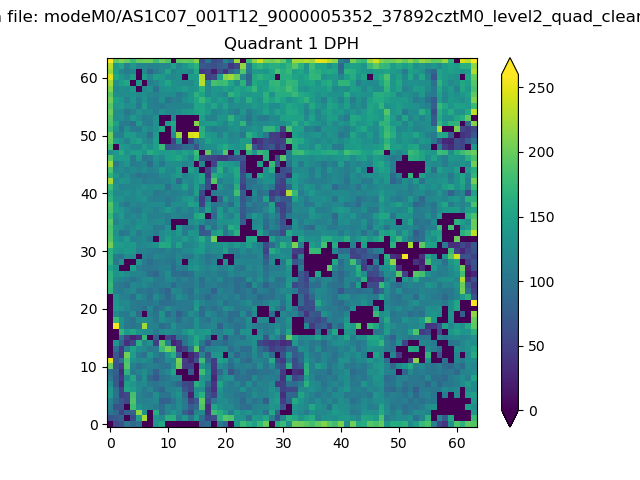 |
Quadrant B |
|---|---|---|---|
| Quadrant D | 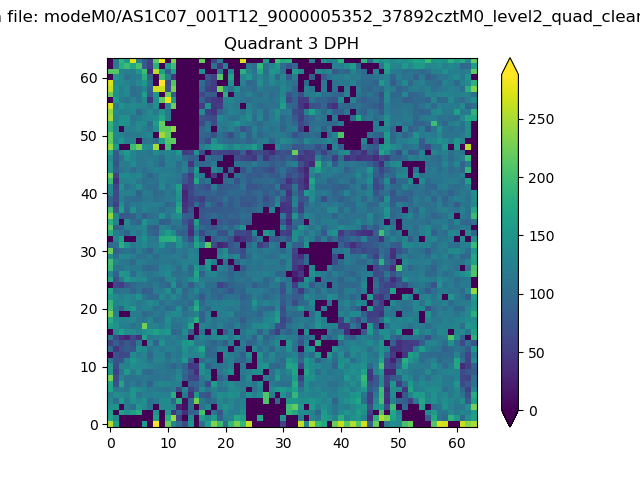 |
 |
Quadrant C |
| Plot type | Count rate plots | Images |
|---|---|---|
| Comparison with Poisson distribution Blue bars denote a histogram of data divided into 1 sec bins. Red curve is a Poisson curve with rate = median count rate of data. |
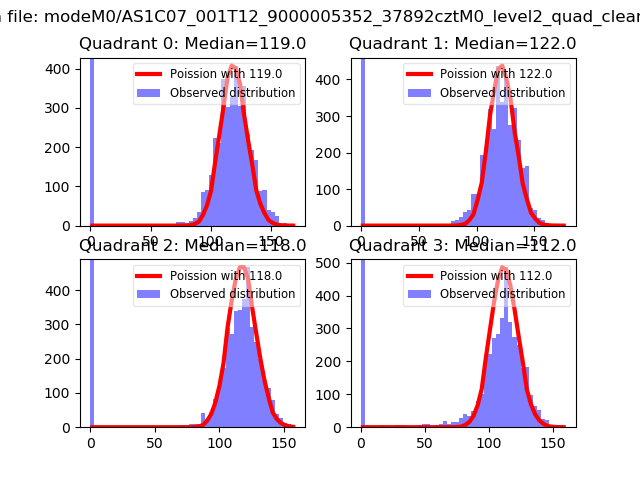 |
 |
| Quadrant-wise count rates Data is divided into 100 sec bins |
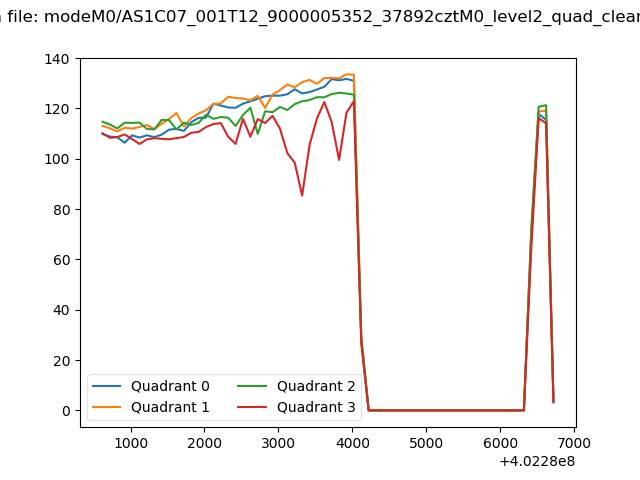 |
|
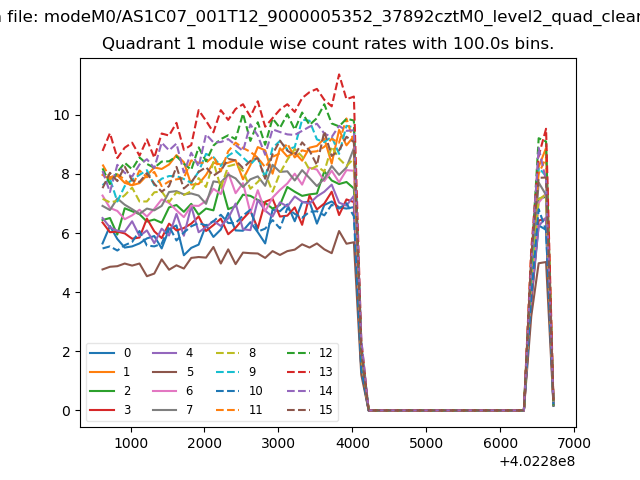
| Module-wise count rates for Quadrant A Data is divided into 100 sec bins |
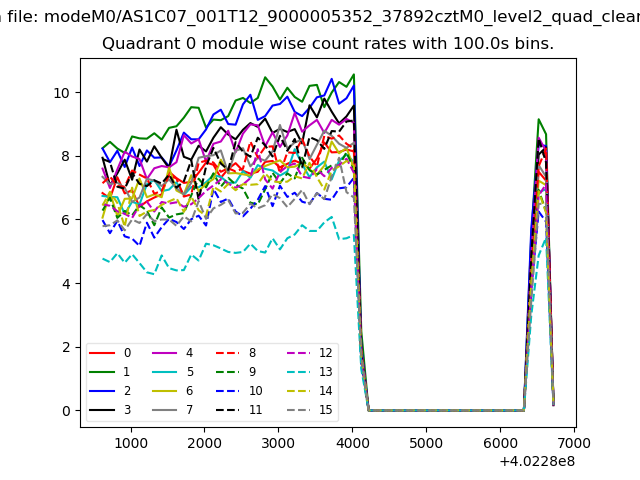 |
 |
| Module-wise count rates for Quadrant B Data is divided into 100 sec bins |
 |
 |
| Module-wise count rates for Quadrant C Data is divided into 100 sec bins |
 |
 |
| Module-wise count rates for Quadrant D Data is divided into 100 sec bins |
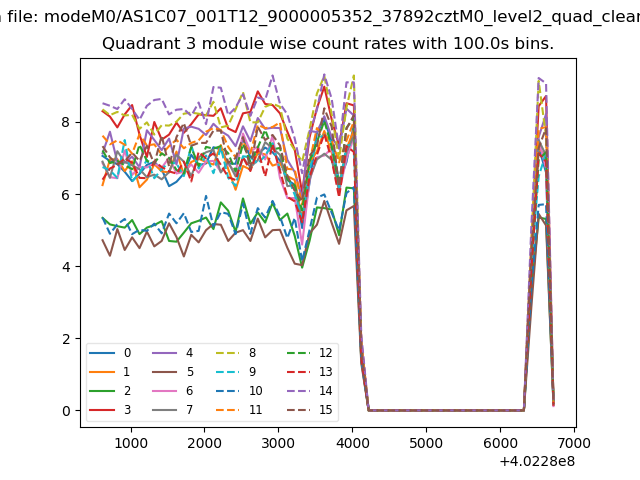 |
 |
| Parameter | Plot |
|---|---|
| CZT HV Monitor | 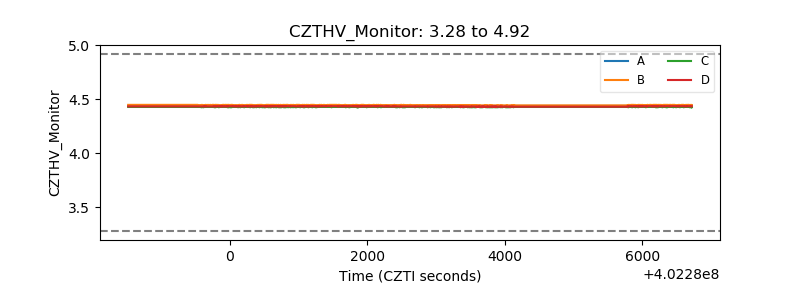 |
| D_VDD | 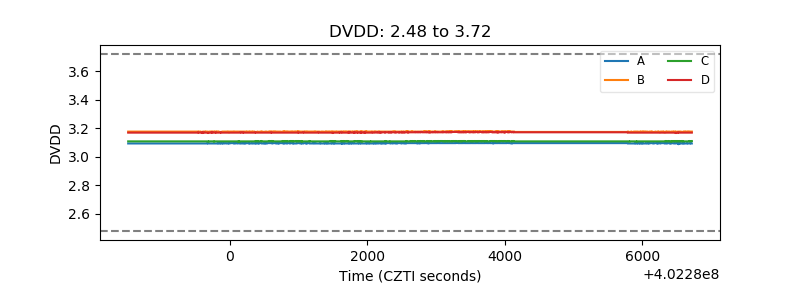 |
| Temperature 1 | 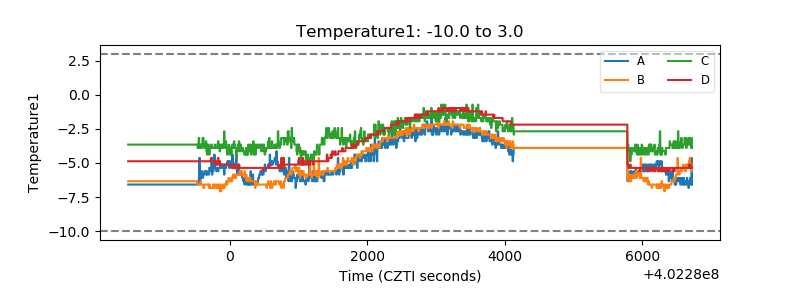 |
| Veto HV Monitor | 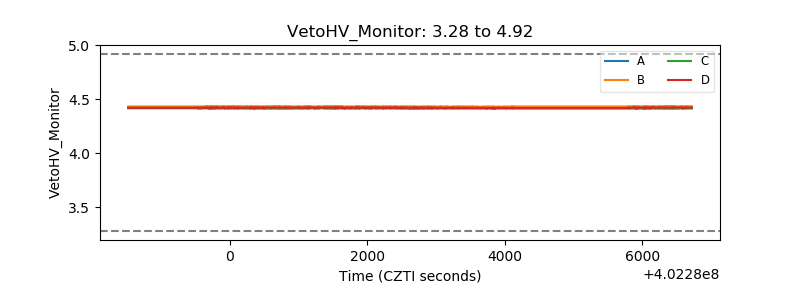 |
| Veto LLD | 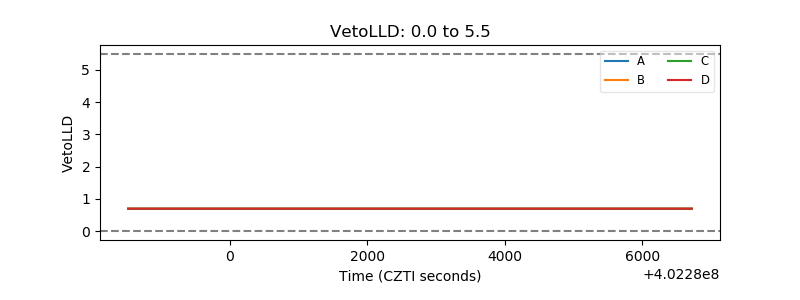 |
| Alpha Counter | 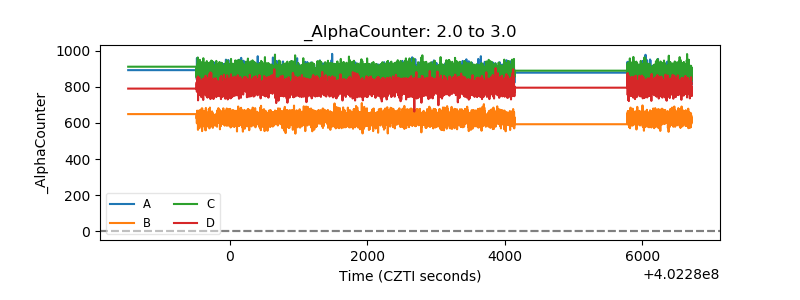 |
| _CPM_Rate | 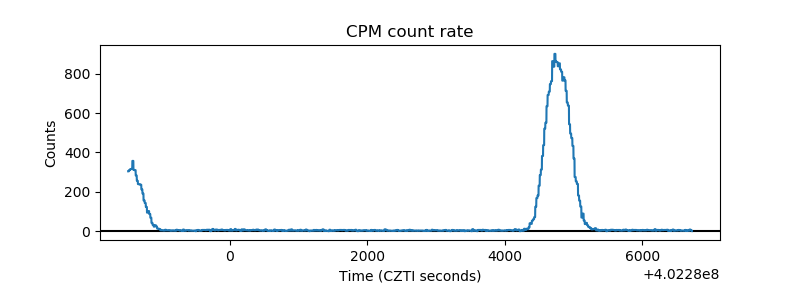 |
| CZT Counter | 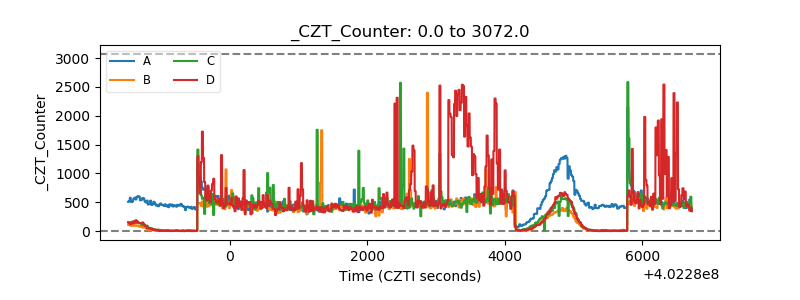 |
| +2.5 Volts monitor | 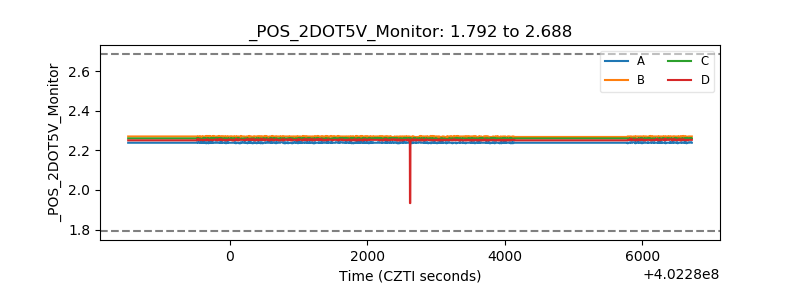 |
| +5 Volts monitor | 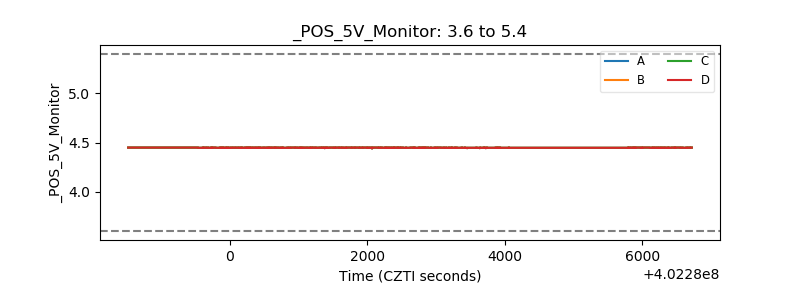 |
| _ROLL_ROT | 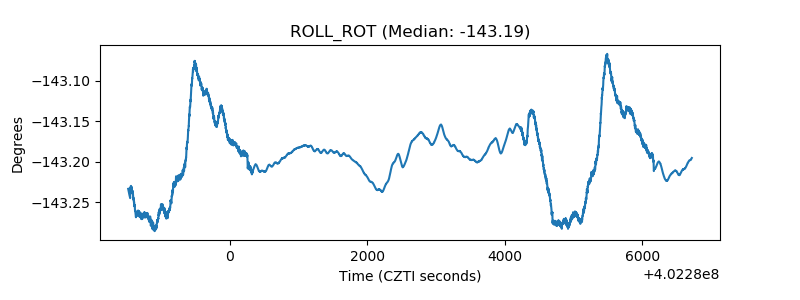 |
| _Roll_DEC | 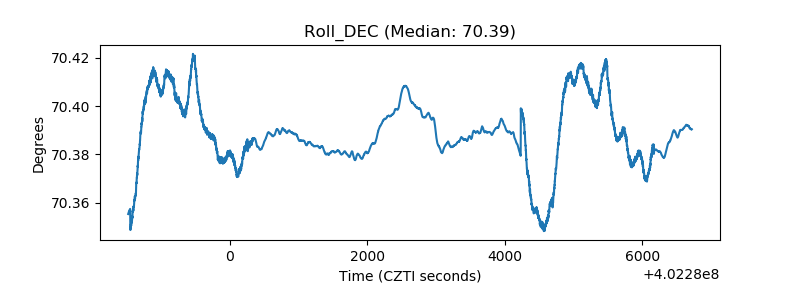 |
| _Roll_RA | 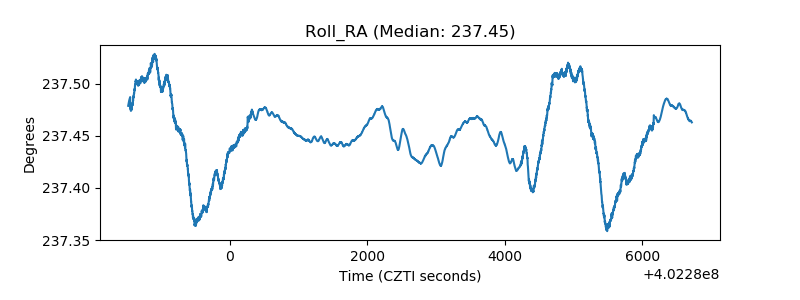 |
| Veto Counter | 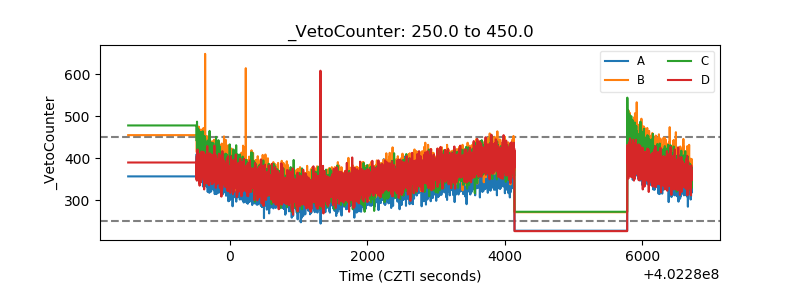 |