| Param | Original file | Final file |
|---|---|---|
| Filename | modeM0/AS1C07_001T12_9000005352_37894cztM0_level2.evt | modeM0/AS1C07_001T12_9000005352_37894cztM0_level2_quad_clean.evt |
| Size (bytes) | 1,707,468,480 | 324,855,360 |
| Size | 1.6 GB | 309.8 MB |
| Events in quadrant A | 11,265,378 | 2,101,314 |
| Events in quadrant B | 10,920,958 | 2,129,004 |
| Events in quadrant C | 11,374,377 | 2,071,234 |
| Events in quadrant D | 16,592,523 | 1,949,937 |
| Mode M9 | |||
|---|---|---|---|
| Quadrant | BADHDUFLAG | Total packets | Discarded packets |
| A | 0 | 57 | 0 |
| B | 0 | 57 | 0 |
| C | 0 | 57 | 0 |
| D | 0 | 58 | 0 |
| Mode M0 | |||
|---|---|---|---|
| Quadrant | BADHDUFLAG | Total packets | Discarded packets |
| A | 0 | 48318 | 5 |
| B | 0 | 48638 | 5 |
| C | 0 | 48414 | 5 |
| D | 0 | 65984 | 5 |
| Mode SS | |||
|---|---|---|---|
| Quadrant | BADHDUFLAG | Total packets | Discarded packets |
| A | 0 | 472 | 0 |
| B | 0 | 472 | 0 |
| C | 0 | 472 | 0 |
| D | 0 | 472 | 0 |
| Quadrant | Total seconds | Saturated seconds | Saturation percentage |
|---|---|---|---|
| A | 23064 | 37 | 0.160423% |
| B | 23064 | 194 | 0.841138% |
| C | 23064 | 112 | 0.485605% |
| D | 23064 | 1346 | 5.835935% |
Noise dominated data is calculated using 1-second bins in cleaned event files. If a bin has >2000 counts, and if more than 50% of those come from <1% of pixels, then it is considered to be noise-dominated and hence unusable.
| Quadrant | # 1 sec bins | Bins with >0 counts | Bins with >2000 counts | High rate bins dominated by noise | Noise dominated (total time) | Noise dominated (detector-on time) | Marked lightcurve |
|---|---|---|---|---|---|---|---|
| A | 28911 | 23068 | 16 | 16 | 0.06% | 0.07% | 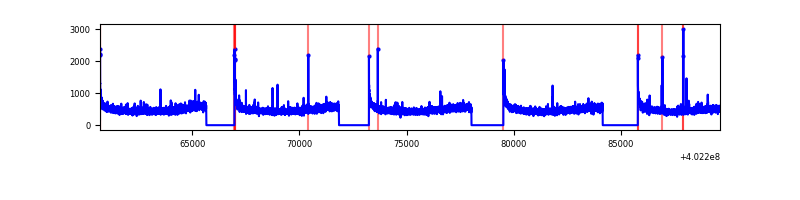 |
| B | 28911 | 23068 | 117 | 117 | 0.40% | 0.51% | 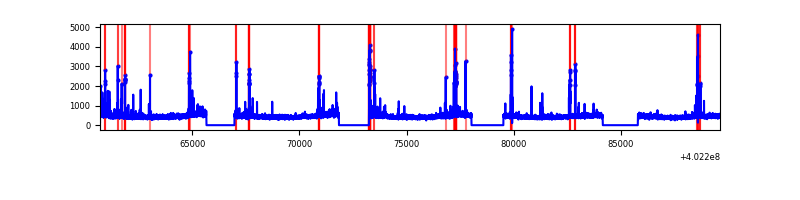 |
| C | 28911 | 23068 | 82 | 82 | 0.28% | 0.36% | 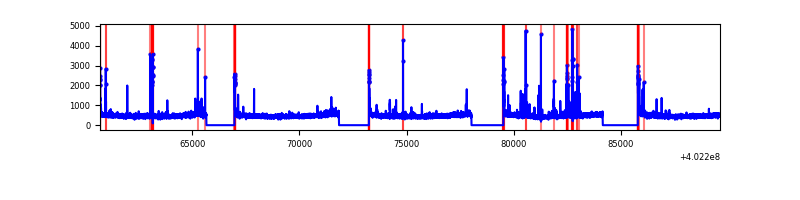 |
| D | 28911 | 23068 | 1017 | 1017 | 3.52% | 4.41% | 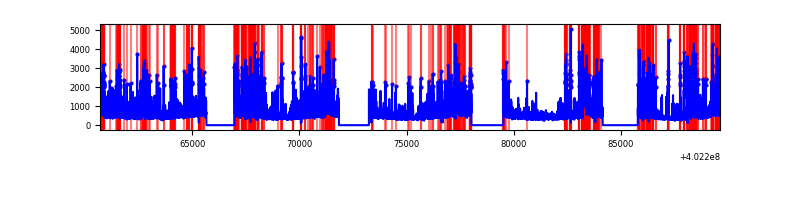 |
Top three noisy pixels from each quadrant. If the there are fewer than three noisy pixels in the level2.evt file, extra rows are filled as -1
| Pixel properties | Quadrant properties | ||||||
|---|---|---|---|---|---|---|---|
| Quadrant | DetID | PixID | Counts | Sigma | Mean | Median | Sigma |
| A | 10 | 83 | 1212046 | 2396.81 | 2542 | 2494 | 504.7 |
| A | 12 | 189 | 66958 | 127.74 | 2542 | 2494 | 504.7 |
| A | 15 | 222 | 51759 | 97.62 | 2542 | 2494 | 504.7 |
| B | 5 | 172 | 570893 | 1189.83 | 2517 | 2445 | 477.8 |
| B | 0 | 229 | 125863 | 258.33 | 2517 | 2445 | 477.8 |
| B | 0 | 213 | 78128 | 158.41 | 2517 | 2445 | 477.8 |
| C | 15 | 214 | 951586 | 1668.06 | 2454 | 2472 | 569.0 |
| C | 14 | 254 | 413102 | 721.68 | 2454 | 2472 | 569.0 |
| C | 0 | 10 | 274644 | 478.34 | 2454 | 2472 | 569.0 |
| D | 1 | 52 | 2299483 | 3913.71 | 2418 | 2352 | 586.9 |
| D | 12 | 233 | 1180637 | 2007.49 | 2418 | 2352 | 586.9 |
| D | 2 | 249 | 1180598 | 2007.42 | 2418 | 2352 | 586.9 |
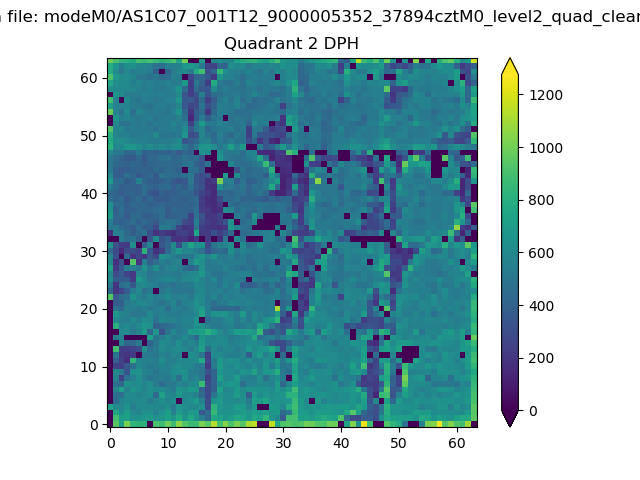
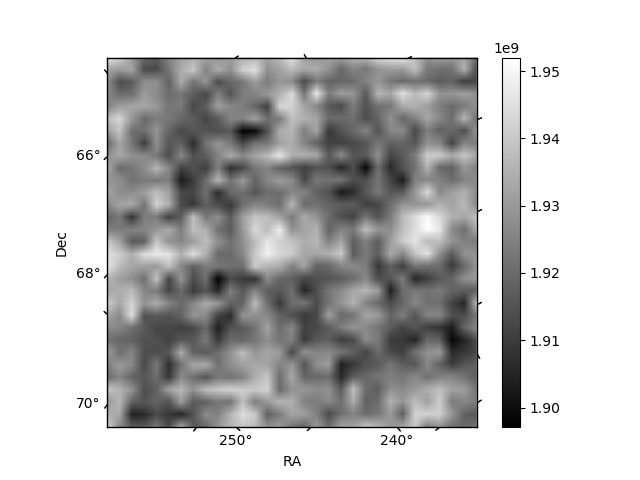
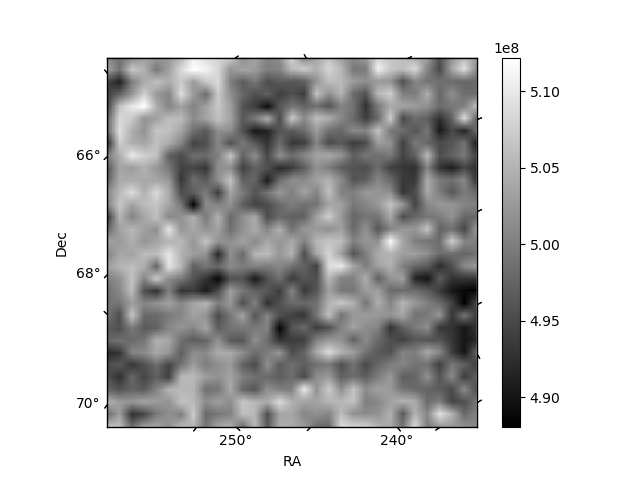
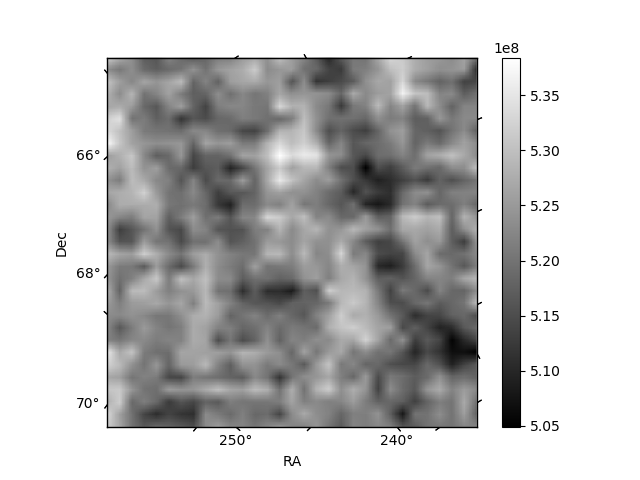
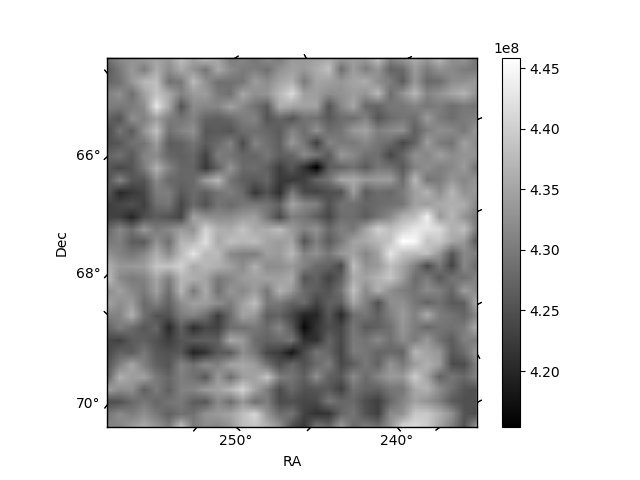
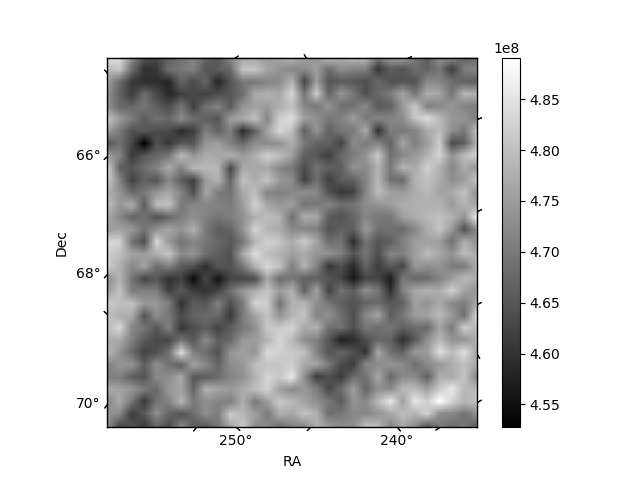
Histogram calculated using DETX and DETY for each event in the final _common_clean file
| Quadrant A | 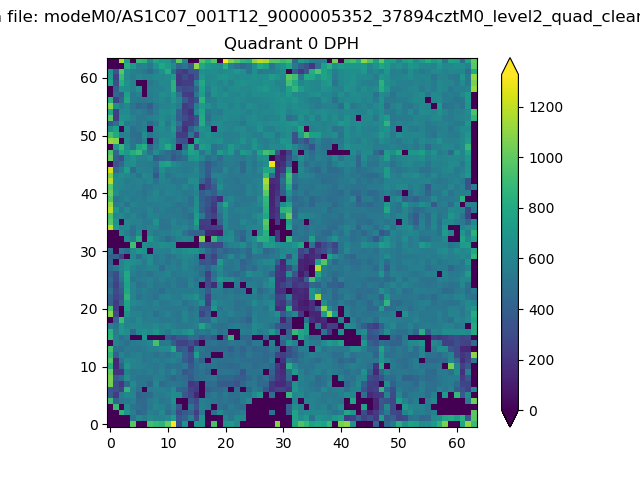 |
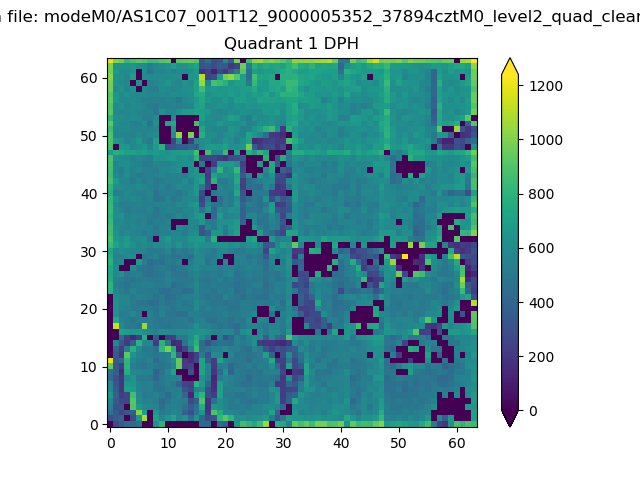 |
Quadrant B |
|---|---|---|---|
| Quadrant D | 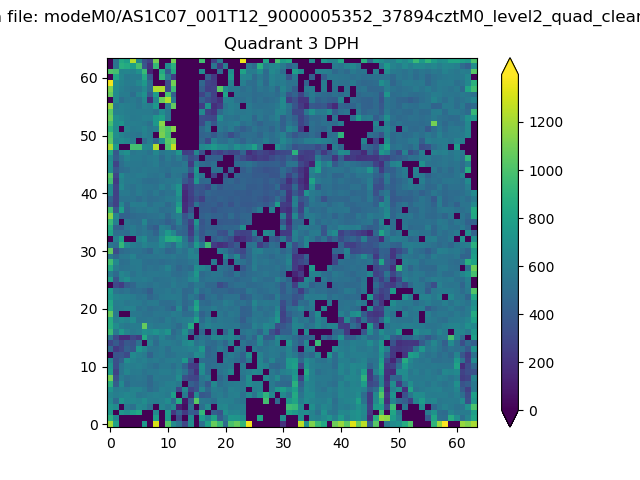 |
 |
Quadrant C |
| Plot type | Count rate plots | Images |
|---|---|---|
| Comparison with Poisson distribution Blue bars denote a histogram of data divided into 1 sec bins. Red curve is a Poisson curve with rate = median count rate of data. |
 |
 |
| Quadrant-wise count rates Data is divided into 100 sec bins |
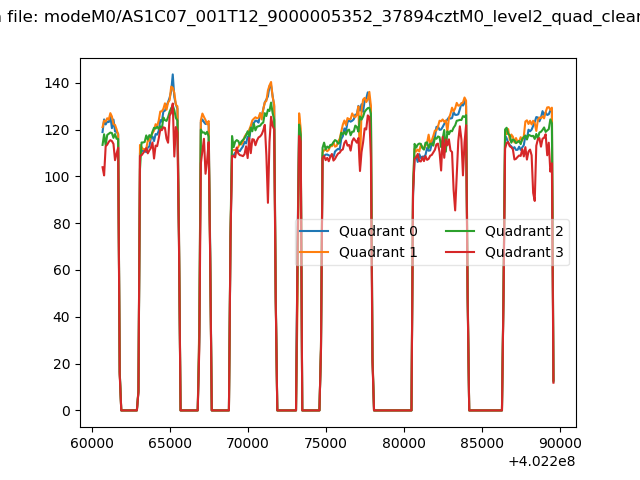 |
|
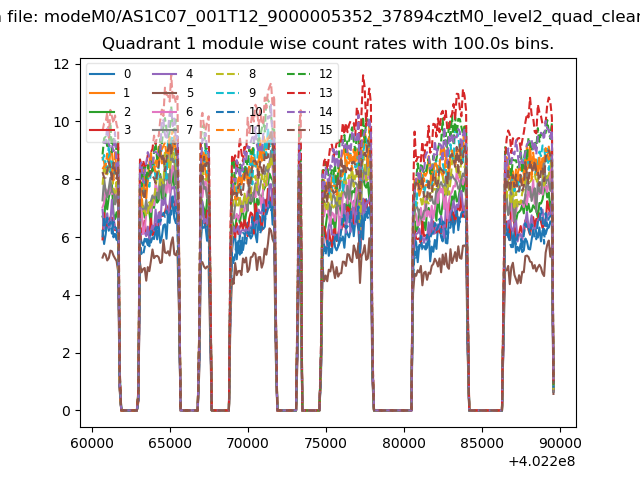
| Module-wise count rates for Quadrant A Data is divided into 100 sec bins |
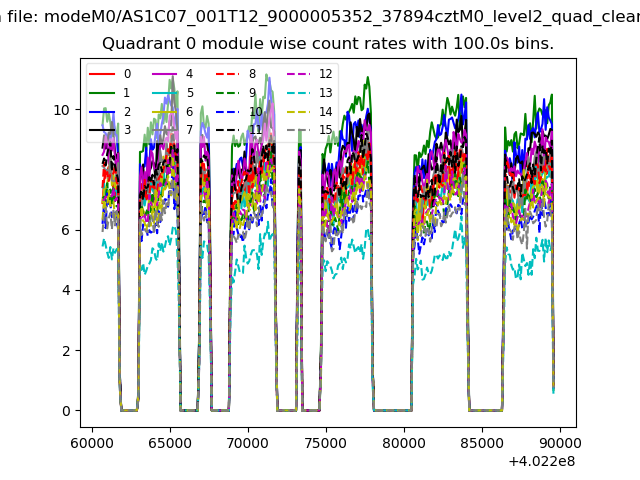 |
 |
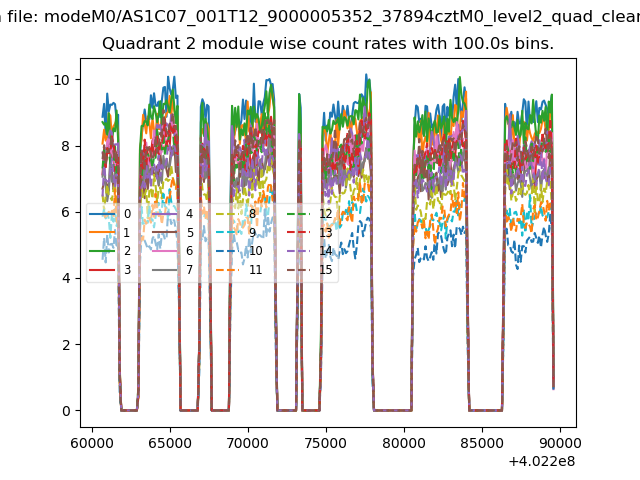
| Module-wise count rates for Quadrant B Data is divided into 100 sec bins |
 |
 |
| Module-wise count rates for Quadrant C Data is divided into 100 sec bins |
 |
 |
| Module-wise count rates for Quadrant D Data is divided into 100 sec bins |
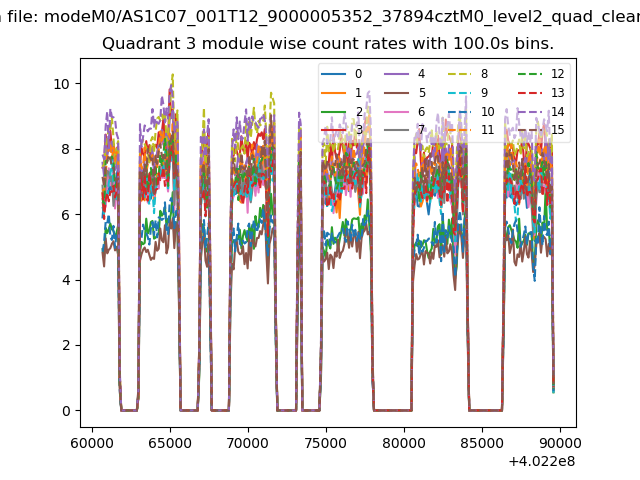 |
 |
| Parameter | Plot |
|---|---|
| CZT HV Monitor | 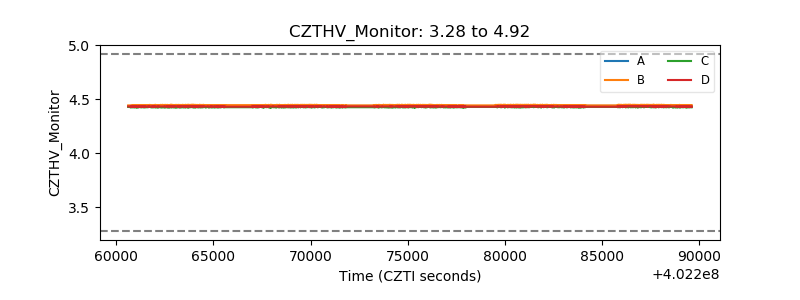 |
| D_VDD | 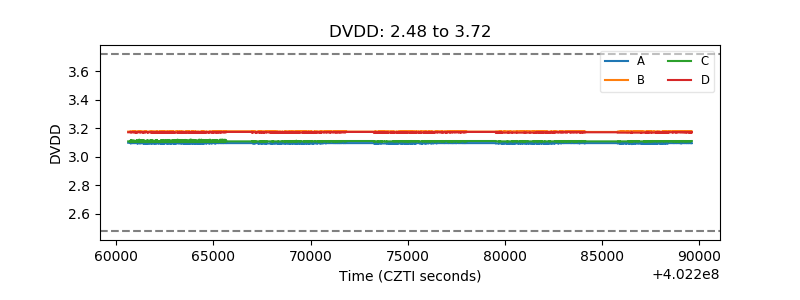 |
| Temperature 1 | 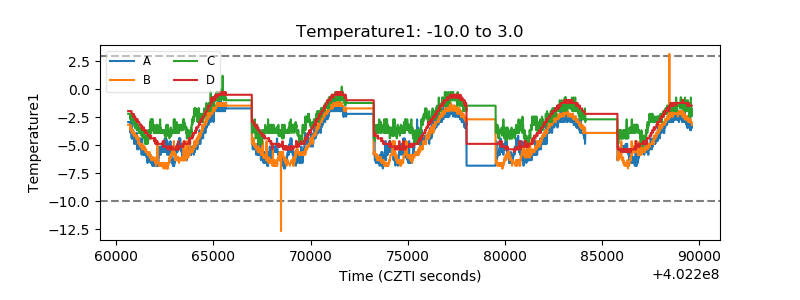 |
| Veto HV Monitor | 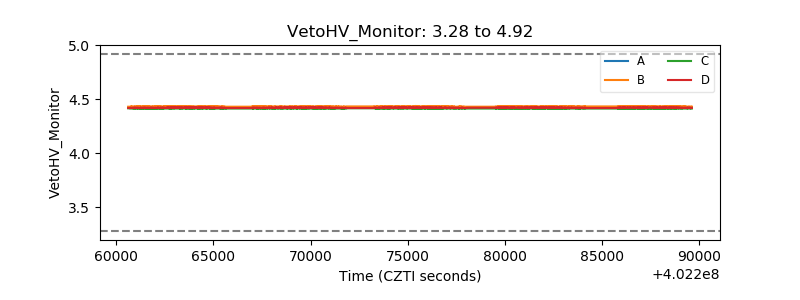 |
| Veto LLD | 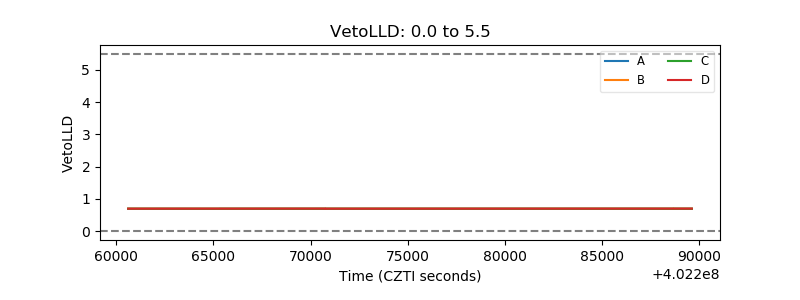 |
| Alpha Counter | 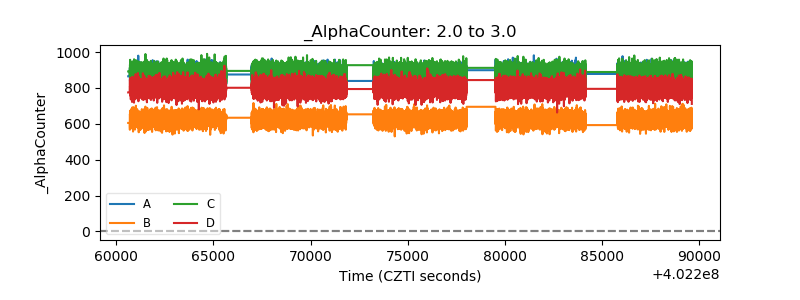 |
| _CPM_Rate | 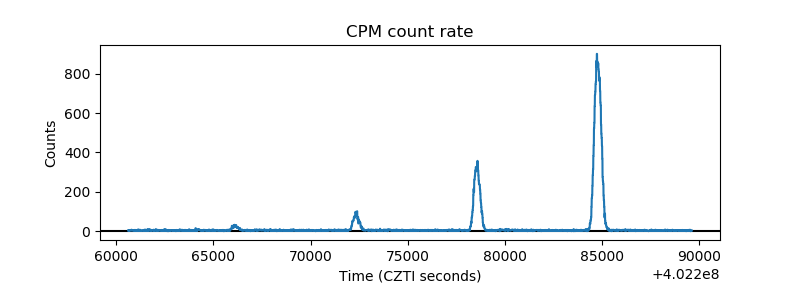 |
| CZT Counter | 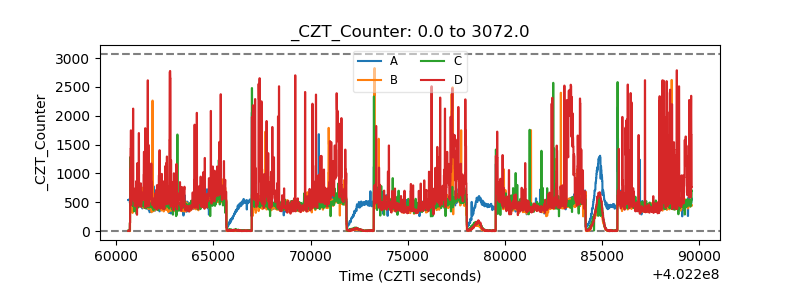 |
| +2.5 Volts monitor | 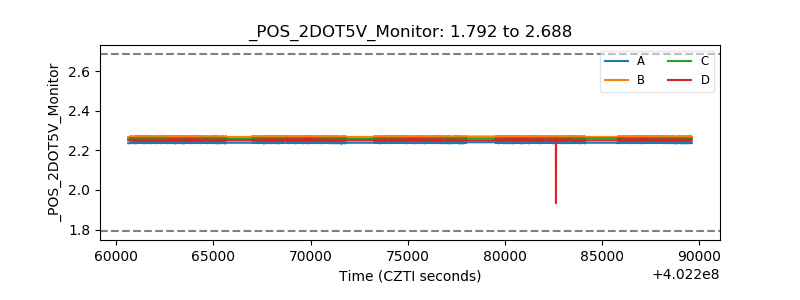 |
| +5 Volts monitor | 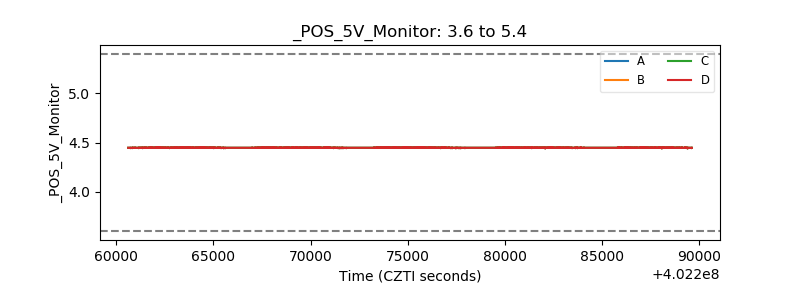 |
| _ROLL_ROT | 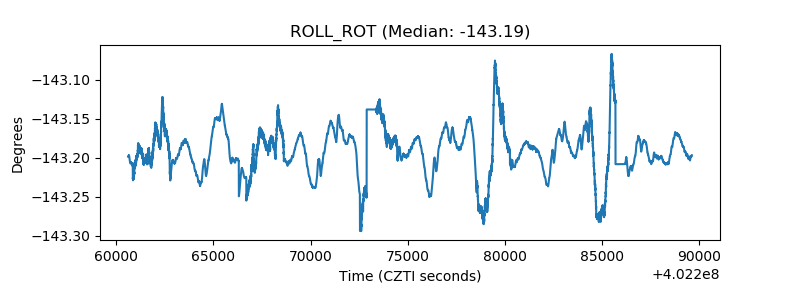 |
| _Roll_DEC | 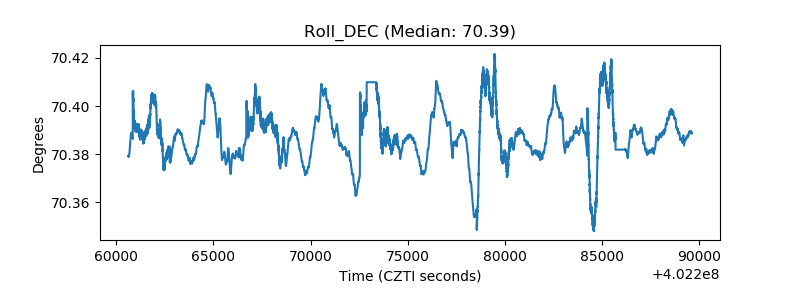 |
| _Roll_RA | 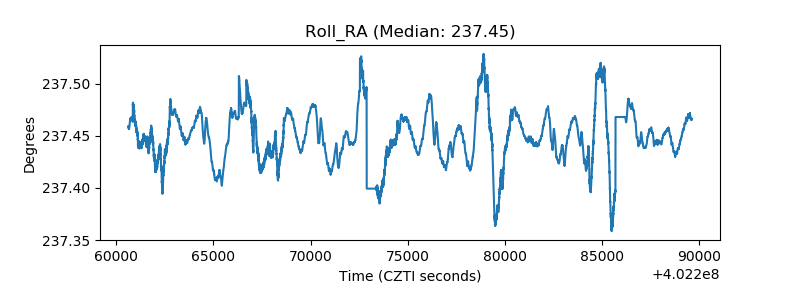 |
| Veto Counter | 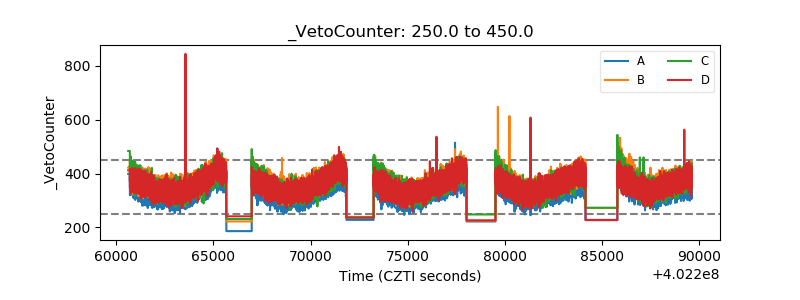 |