| Param | Original file | Final file |
|---|---|---|
| Filename | modeM0/AS1T05_059T01_9000005354cztM0_level2.fits | modeM0/AS1T05_059T01_9000005354cztM0_level2_quad_clean.evt |
| Size (bytes) | 1,375,292,160 | 1,533,807,360 |
| Size | 1.3 GB | 1.4 GB |
| Events in quadrant A | 8,413,236 | 9,516,745 |
| Events in quadrant B | 7,966,682 | 9,390,839 |
| Events in quadrant C | 8,290,444 | 9,473,407 |
| Events in quadrant D | 6,921,008 | 8,019,582 |
| Mode M0 | |||
|---|---|---|---|
| Quadrant | BADHDUFLAG | Total packets | Discarded packets |
| A | 0 | 335774 | 0 |
| B | 0 | 360419 | 0 |
| C | 0 | 315398 | 0 |
| D | 0 | 438286 | 0 |
| Mode SS | |||
|---|---|---|---|
| Quadrant | BADHDUFLAG | Total packets | Discarded packets |
| A | 0 | 3000 | 0 |
| B | 0 | 3000 | 0 |
| C | 0 | 3000 | 0 |
| D | 0 | 3000 | 0 |
| Mode M9 | |||
|---|---|---|---|
| Quadrant | BADHDUFLAG | Total packets | Discarded packets |
| A | 0 | 591 | 0 |
| B | 0 | 591 | 0 |
| C | 0 | 591 | 0 |
| D | 0 | 592 | 0 |
| Quadrant | Total seconds | Saturated seconds | Saturation percentage |
|---|---|---|---|
| A | 146729 | 2608 | 1.777426% |
| B | 146729 | 4412 | 3.006904% |
| C | 146729 | 955 | 0.650860% |
| D | 146728 | 11830 | 8.062537% |
Noise dominated data is calculated using 1-second bins in cleaned event files. If a bin has >2000 counts, and if more than 50% of those come from <1% of pixels, then it is considered to be noise-dominated and hence unusable.
| Quadrant | # 1 sec bins | Bins with >0 counts | Bins with >2000 counts | High rate bins dominated by noise | Noise dominated (total time) | Noise dominated (detector-on time) | Marked lightcurve |
|---|---|---|---|---|---|---|---|
| A | 209107 | 146701 | 0 | 0 | 0.00% | 0.00% | 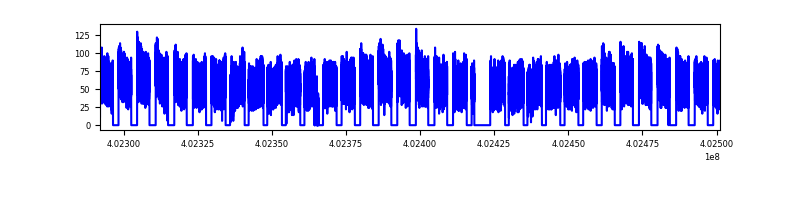 |
| B | 209107 | 146643 | 0 | 0 | 0.00% | 0.00% | 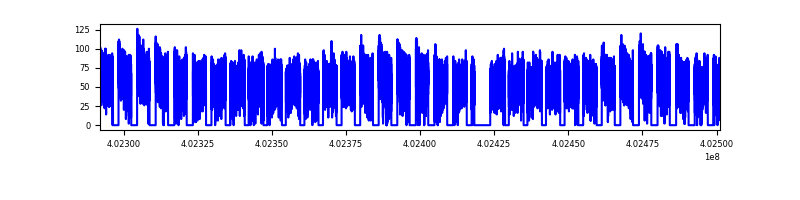 |
| C | 209107 | 146725 | 0 | 0 | 0.00% | 0.00% |  |
| D | 209107 | 146488 | 0 | 0 | 0.00% | 0.00% | 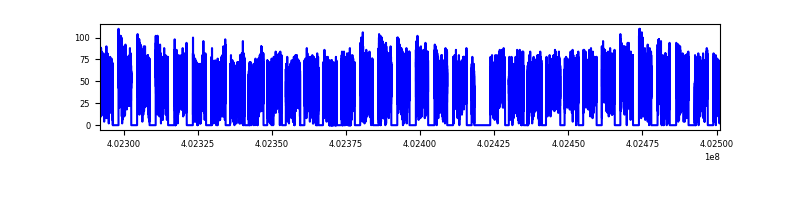 |
Top three noisy pixels from each quadrant. If the there are fewer than three noisy pixels in the level2.evt file, extra rows are filled as -1
| Pixel properties | Quadrant properties | ||||||
|---|---|---|---|---|---|---|---|
| Quadrant | DetID | PixID | Counts | Sigma | Mean | Median | Sigma |
| A | 7 | 110 | 6923 | 9.1 | 2203 | 2087 | 531.6 |
| A | 0 | 29 | 6841 | 8.94 | 2203 | 2087 | 531.6 |
| A | 9 | 19 | 6794 | 8.85 | 2203 | 2087 | 531.6 |
| B | 2 | 9 | 6847 | 11.92 | 2117 | 2036 | 403.7 |
| B | 3 | 80 | 6469 | 10.98 | 2117 | 2036 | 403.7 |
| B | 5 | 128 | 5665 | 8.99 | 2117 | 2036 | 403.7 |
| C | 1 | 81 | 7077 | 9.06 | 2193 | 2070 | 552.6 |
| C | 1 | 80 | 6766 | 8.5 | 2193 | 2070 | 552.6 |
| C | 3 | 202 | 6687 | 8.35 | 2193 | 2070 | 552.6 |
| D | 10 | 189 | 5300 | 6.67 | 1987 | 1818 | 522.1 |
| D | 7 | 3 | 5169 | 6.42 | 1987 | 1818 | 522.1 |
| D | 4 | 160 | 5158 | 6.4 | 1987 | 1818 | 522.1 |
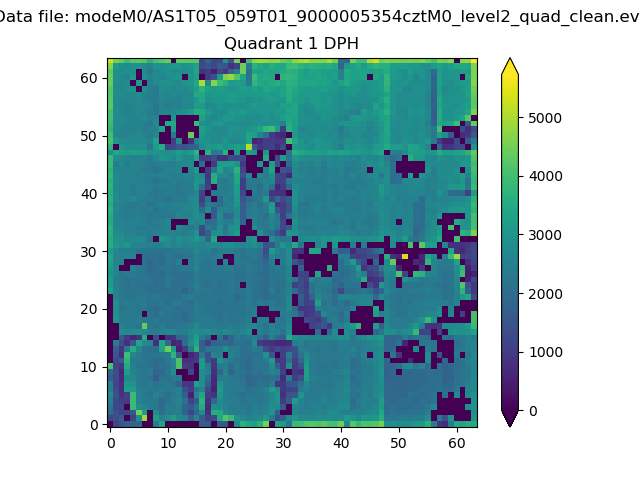
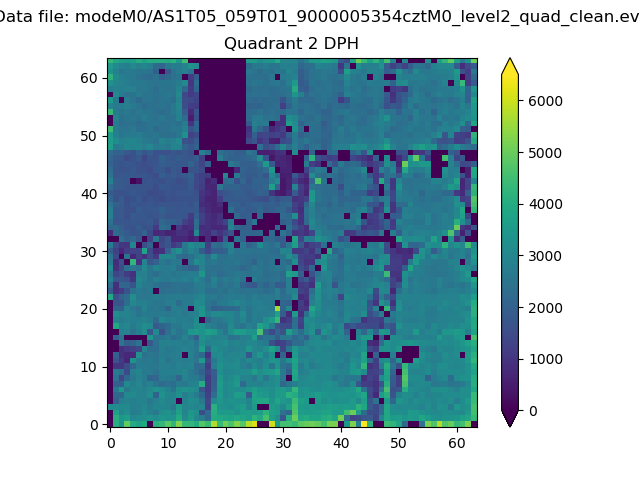
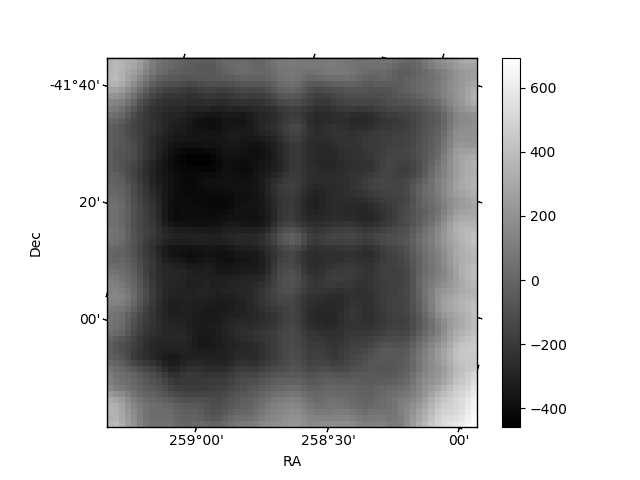
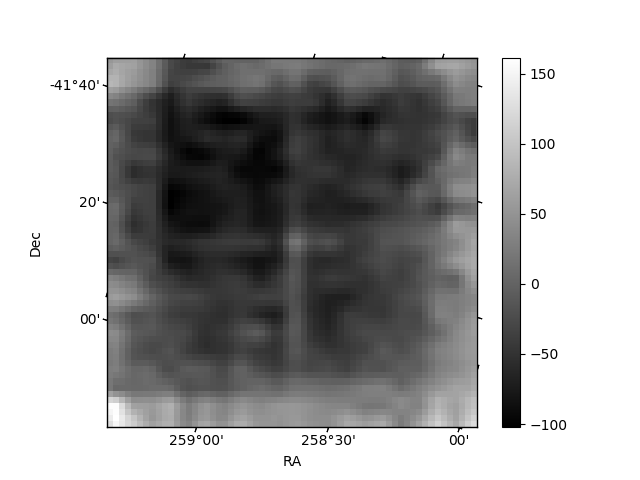
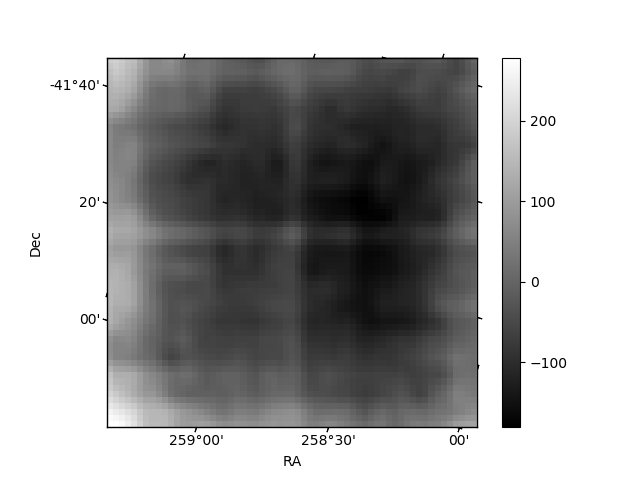
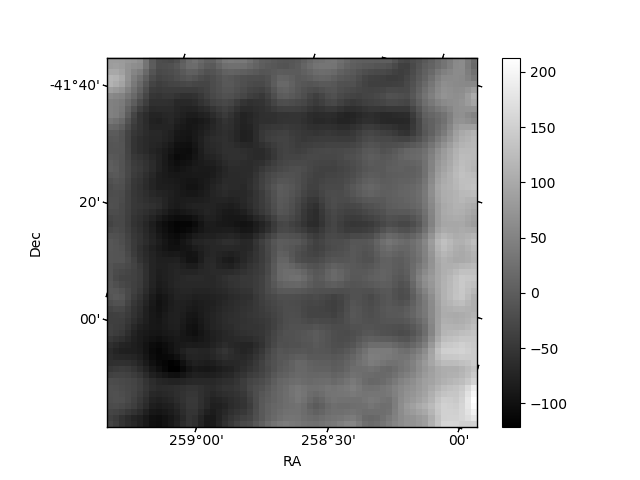
Histogram calculated using DETX and DETY for each event in the final _common_clean file
| Quadrant A | 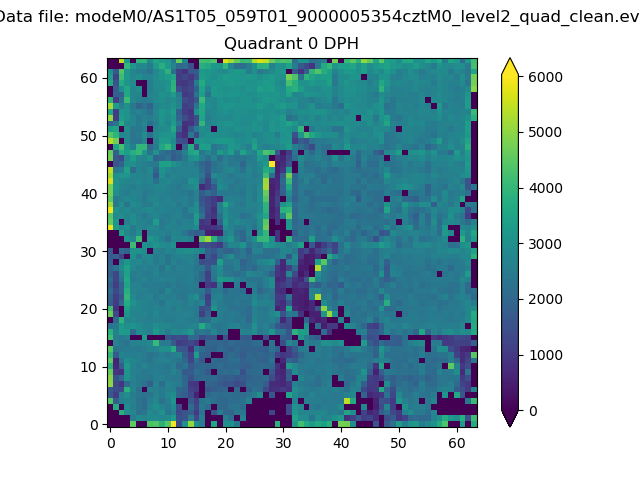 |
 |
Quadrant B |
|---|---|---|---|
| Quadrant D | 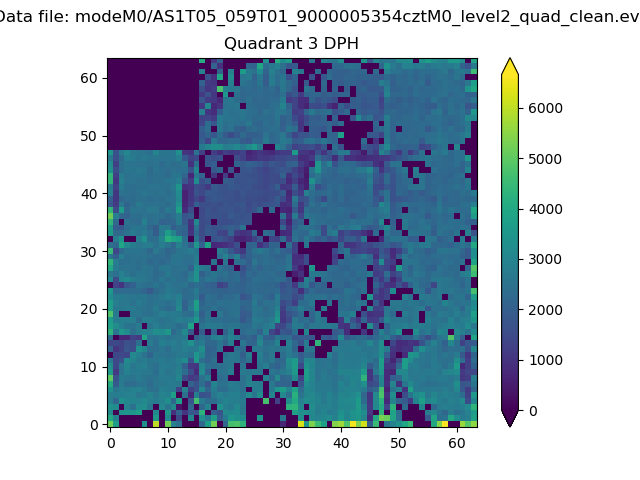 |
 |
Quadrant C |
| Plot type | Count rate plots | Images |
|---|---|---|
| Comparison with Poisson distribution Blue bars denote a histogram of data divided into 1 sec bins. Red curve is a Poisson curve with rate = median count rate of data. |
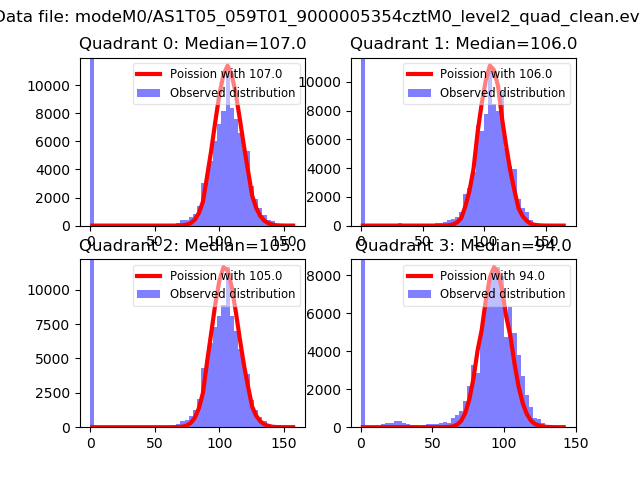 |
 |
| Quadrant-wise count rates Data is divided into 100 sec bins |
 |
|
| Module-wise count rates for Quadrant A Data is divided into 100 sec bins |
 |
 |
| Module-wise count rates for Quadrant B Data is divided into 100 sec bins |
 |
 |
| Module-wise count rates for Quadrant C Data is divided into 100 sec bins |
 |
 |
| Module-wise count rates for Quadrant D Data is divided into 100 sec bins |
 |
 |
| Parameter | Plot |
|---|---|
| CZT HV Monitor | 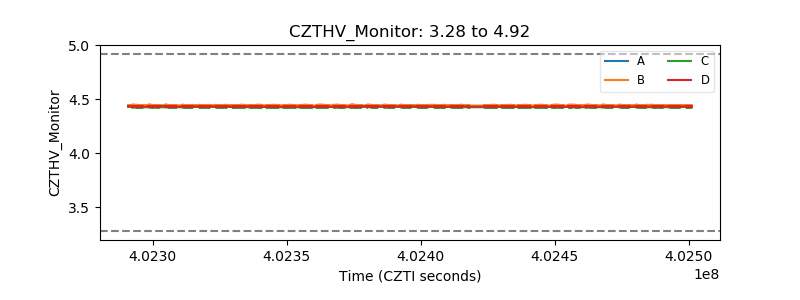 |
| D_VDD | 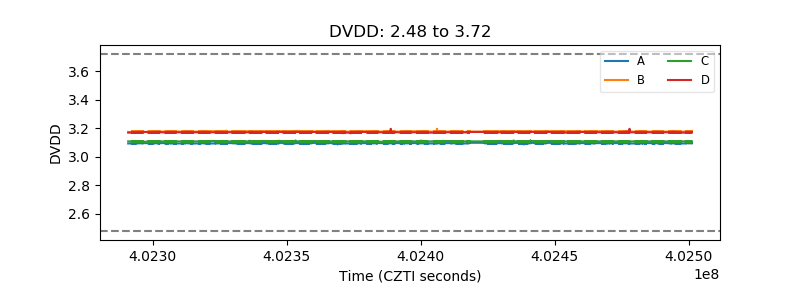 |
| Temperature 1 |  |
| Veto HV Monitor | 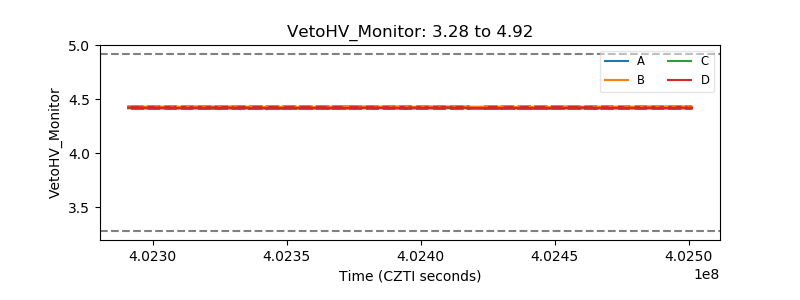 |
| Veto LLD | 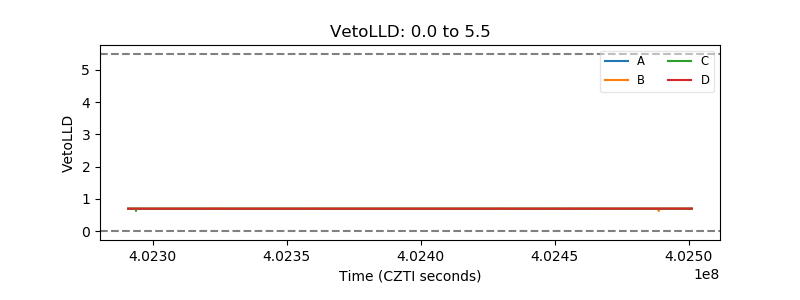 |
| Alpha Counter | 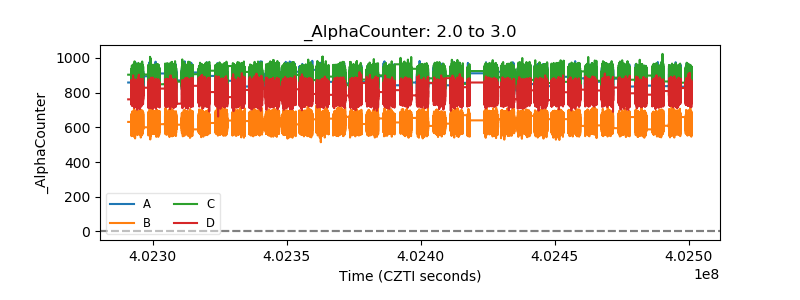 |
| _CPM_Rate | 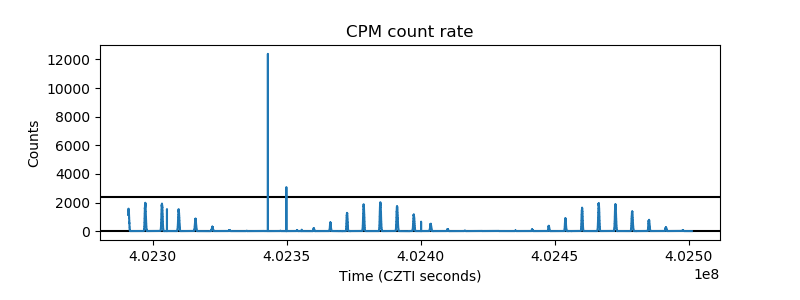 |
| CZT Counter | 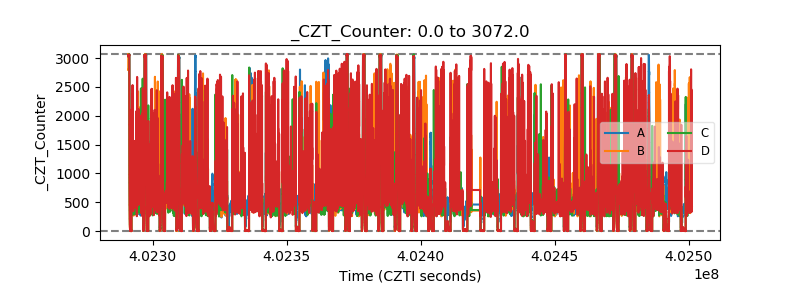 |
| +2.5 Volts monitor | 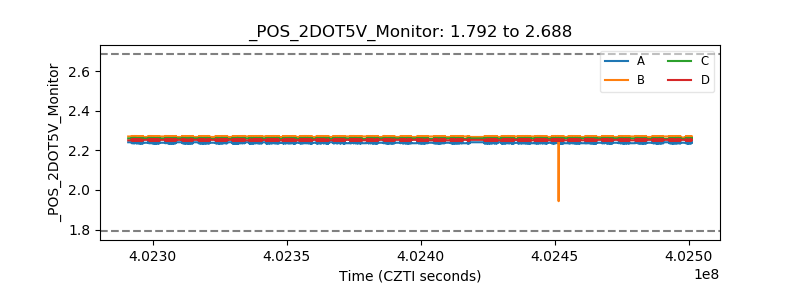 |
| +5 Volts monitor |  |
| _ROLL_ROT | 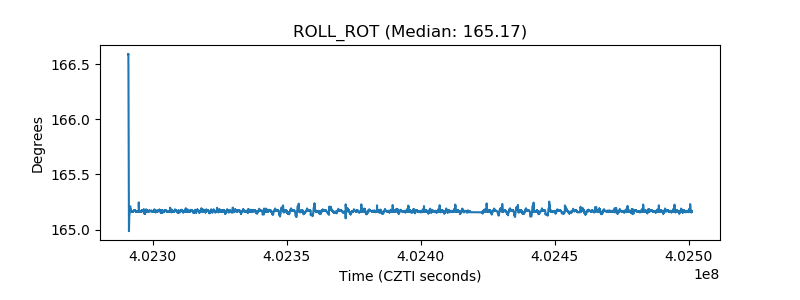 |
| _Roll_DEC |  |
| _Roll_RA | 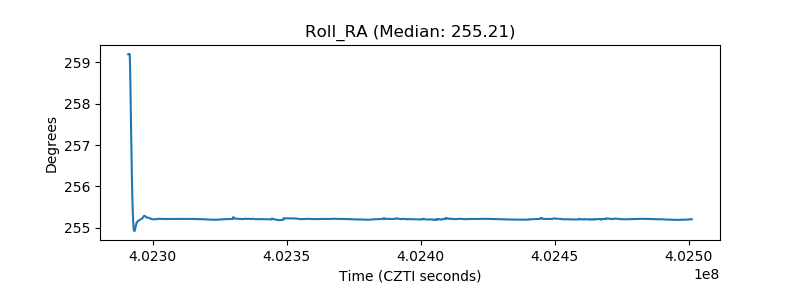 |
| Veto Counter |  |