| Param | Original file | Final file |
|---|---|---|
| Filename | modeM0/AS1T05_059T01_9000005354_37894cztM0_level2.evt | modeM0/AS1T05_059T01_9000005354_37894cztM0_level2_quad_clean.evt |
| Size (bytes) | 86,028,480 | 5,169,600 |
| Size | 82.0 MB | 4.9 MB |
| Events in quadrant A | 644,355 | 19,545 |
| Events in quadrant B | 524,565 | 20,020 |
| Events in quadrant C | 611,946 | 19,219 |
| Events in quadrant D | 751,463 | 17,869 |
| Mode M0 | |||
|---|---|---|---|
| Quadrant | BADHDUFLAG | Total packets | Discarded packets |
| A | 0 | 2588 | 2 |
| B | 0 | 2141 | 1 |
| C | 0 | 2390 | 1 |
| D | 0 | 2916 | 3 |
| Mode SS | |||
|---|---|---|---|
| Quadrant | BADHDUFLAG | Total packets | Discarded packets |
| A | 0 | 20 | 0 |
| B | 0 | 20 | 0 |
| C | 0 | 20 | 0 |
| D | 0 | 20 | 0 |
| Mode M9 | |||
|---|---|---|---|
| Quadrant | BADHDUFLAG | Total packets | Discarded packets |
| A | 0 | 13 | 0 |
| B | 0 | 13 | 0 |
| C | 0 | 13 | 0 |
| D | 0 | 13 | 0 |
| Quadrant | Total seconds | Saturated seconds | Saturation percentage |
|---|---|---|---|
| A | 1032 | 4 | 0.387597% |
| B | 1032 | 2 | 0.193798% |
| C | 1032 | 11 | 1.065891% |
| D | 1031 | 43 | 4.170708% |
Noise dominated data is calculated using 1-second bins in cleaned event files. If a bin has >2000 counts, and if more than 50% of those come from <1% of pixels, then it is considered to be noise-dominated and hence unusable.
| Quadrant | # 1 sec bins | Bins with >0 counts | Bins with >2000 counts | High rate bins dominated by noise | Noise dominated (total time) | Noise dominated (detector-on time) | Marked lightcurve |
|---|---|---|---|---|---|---|---|
| A | 1032 | 1032 | 2 | 2 | 0.19% | 0.19% | 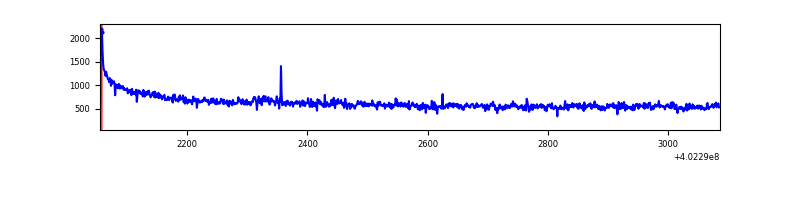 |
| B | 1032 | 1032 | 0 | 0 | 0.00% | 0.00% | 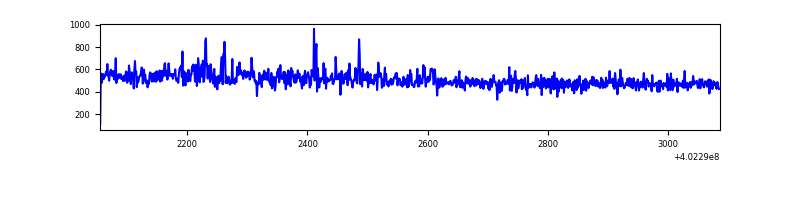 |
| C | 1032 | 1032 | 7 | 7 | 0.68% | 0.68% | 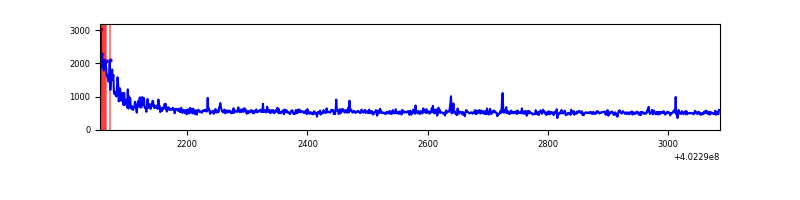 |
| D | 1032 | 1032 | 30 | 30 | 2.91% | 2.91% | 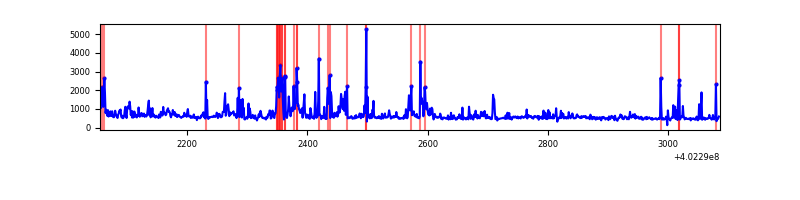 |
Top three noisy pixels from each quadrant. If the there are fewer than three noisy pixels in the level2.evt file, extra rows are filled as -1
| Pixel properties | Quadrant properties | ||||||
|---|---|---|---|---|---|---|---|
| Quadrant | DetID | PixID | Counts | Sigma | Mean | Median | Sigma |
| A | 10 | 83 | 109641 | 3961.2 | 129 | 127 | 27.6 |
| A | 15 | 222 | 26463 | 952.59 | 129 | 127 | 27.6 |
| A | 13 | 6 | 2554 | 87.79 | 129 | 127 | 27.6 |
| B | 0 | 213 | 5542 | 205.17 | 129 | 126 | 26.4 |
| B | 4 | 171 | 5495 | 203.39 | 129 | 126 | 26.4 |
| B | 12 | 111 | 2955 | 107.17 | 129 | 126 | 26.4 |
| C | 0 | 10 | 54327 | 1744.47 | 128 | 128 | 31.1 |
| C | 15 | 214 | 47801 | 1534.42 | 128 | 128 | 31.1 |
| C | 14 | 254 | 6918 | 218.55 | 128 | 128 | 31.1 |
| D | 1 | 47 | 113636 | 3599.65 | 124 | 120 | 31.5 |
| D | 1 | 52 | 101094 | 3201.94 | 124 | 120 | 31.5 |
| D | 9 | 49 | 49841 | 1576.68 | 124 | 120 | 31.5 |
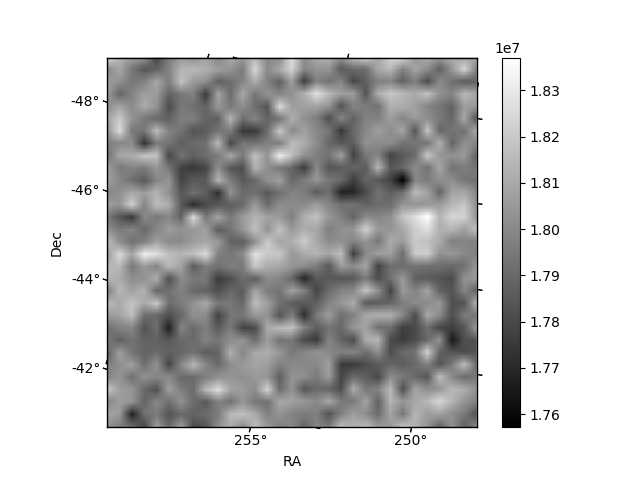
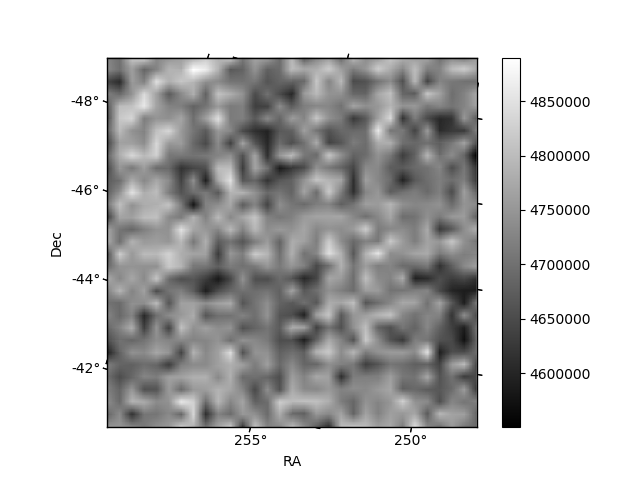
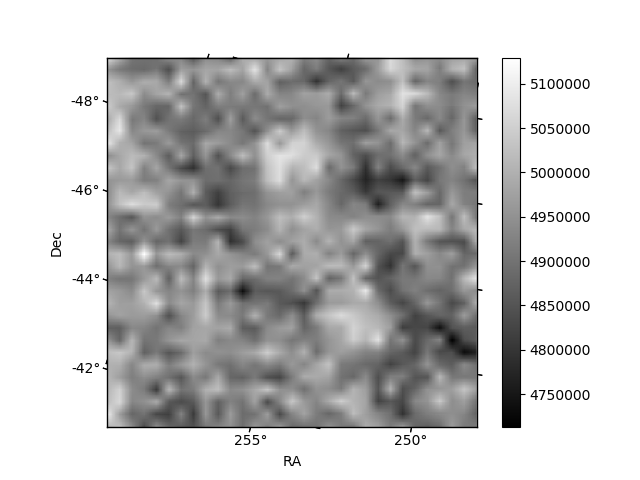
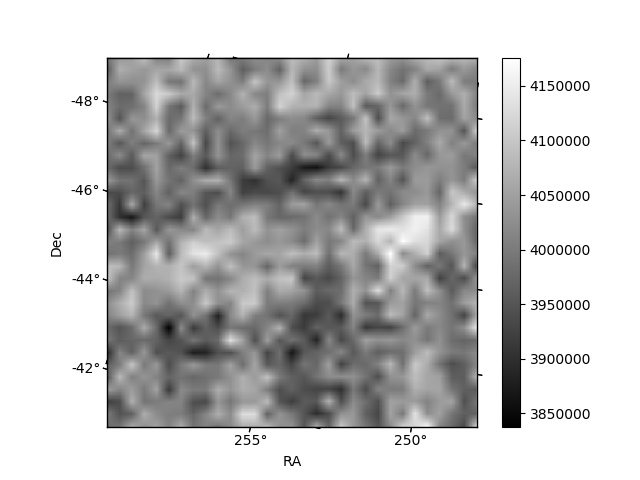
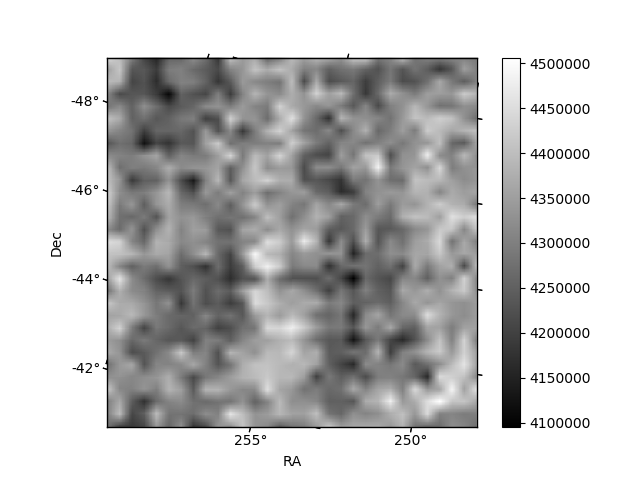
Histogram calculated using DETX and DETY for each event in the final _common_clean file
| Quadrant A | 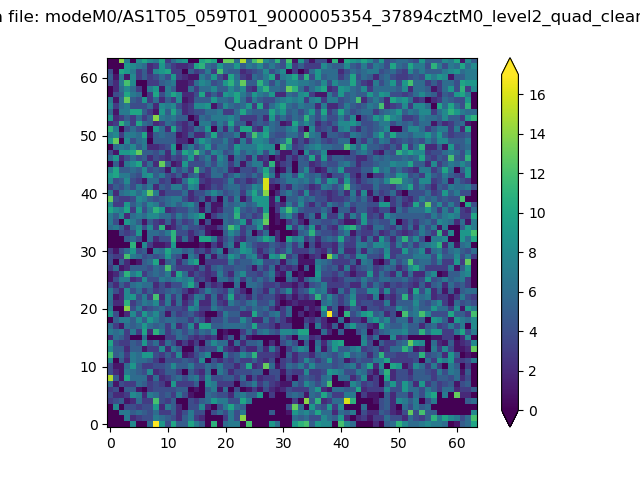 |
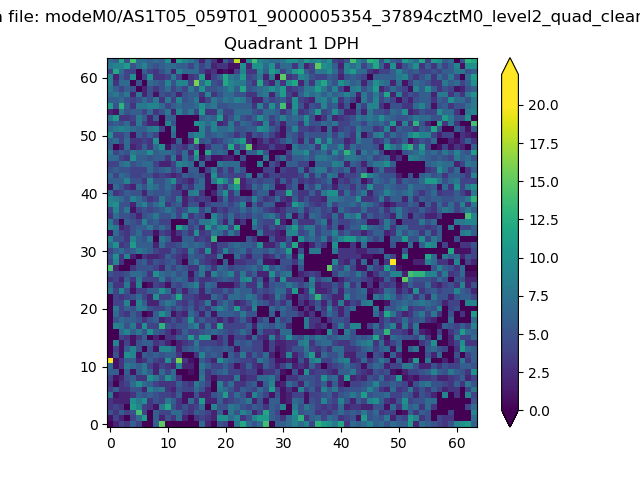 |
Quadrant B |
|---|---|---|---|
| Quadrant D | 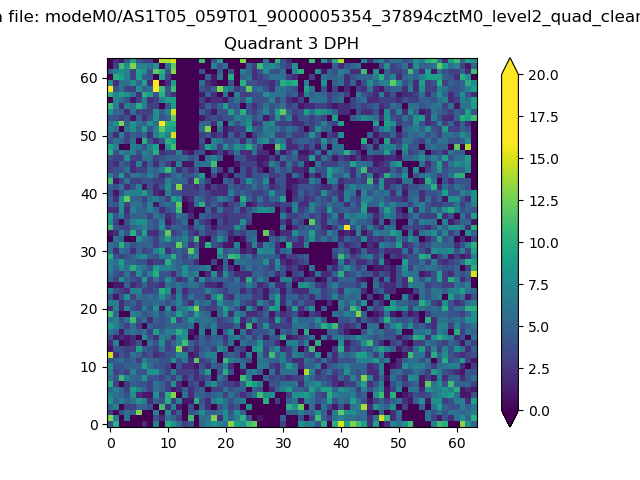 |
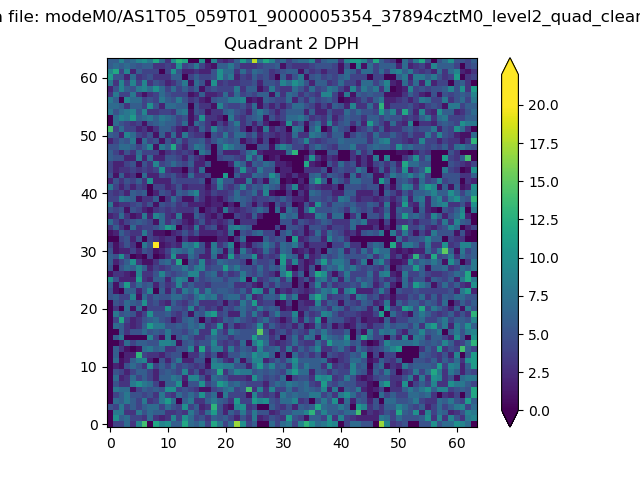 |
Quadrant C |
| Plot type | Count rate plots | Images |
|---|---|---|
| Comparison with Poisson distribution Blue bars denote a histogram of data divided into 1 sec bins. Red curve is a Poisson curve with rate = median count rate of data. |
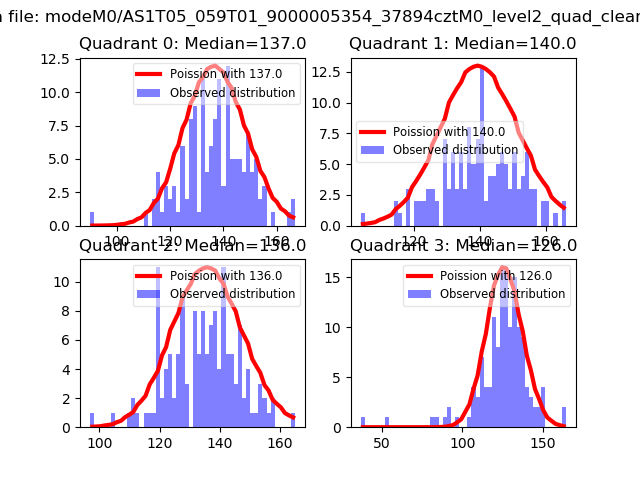 |
 |
| Quadrant-wise count rates Data is divided into 100 sec bins |
 |
|
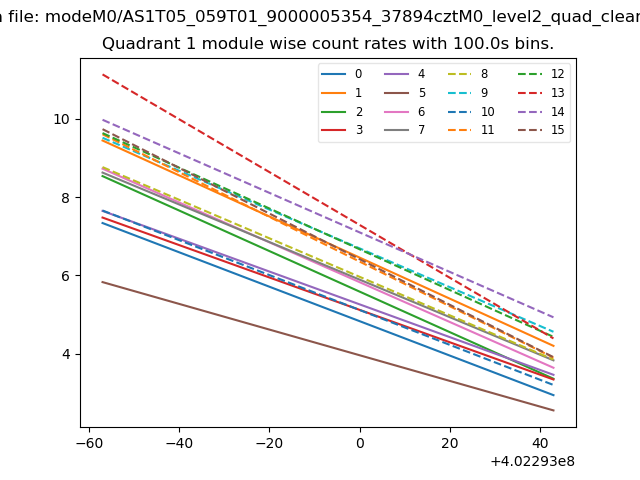
| Module-wise count rates for Quadrant A Data is divided into 100 sec bins |
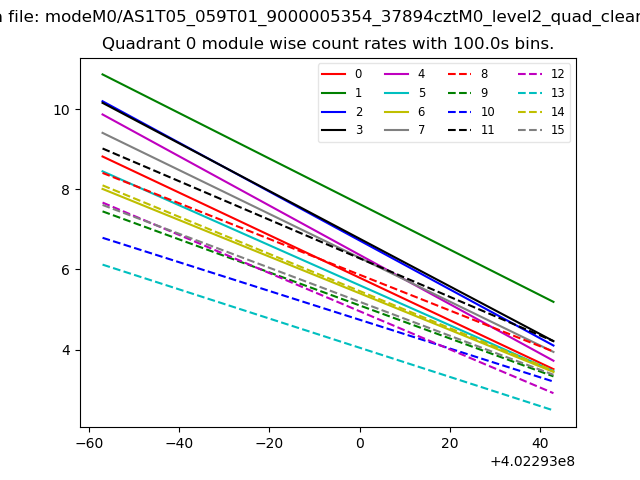 |
 |
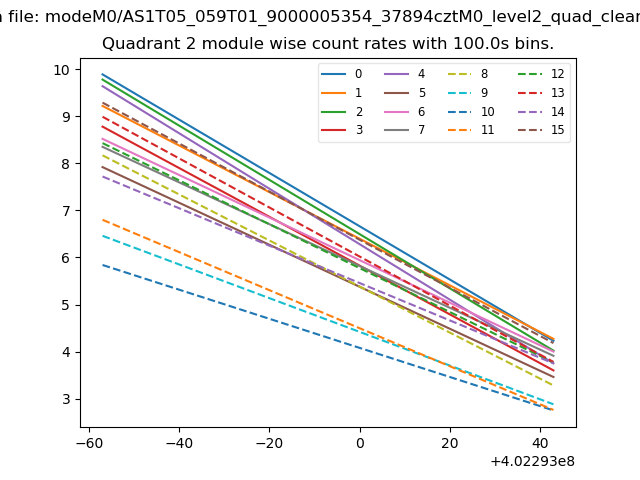
| Module-wise count rates for Quadrant B Data is divided into 100 sec bins |
 |
 |
| Module-wise count rates for Quadrant C Data is divided into 100 sec bins |
 |
 |
| Module-wise count rates for Quadrant D Data is divided into 100 sec bins |
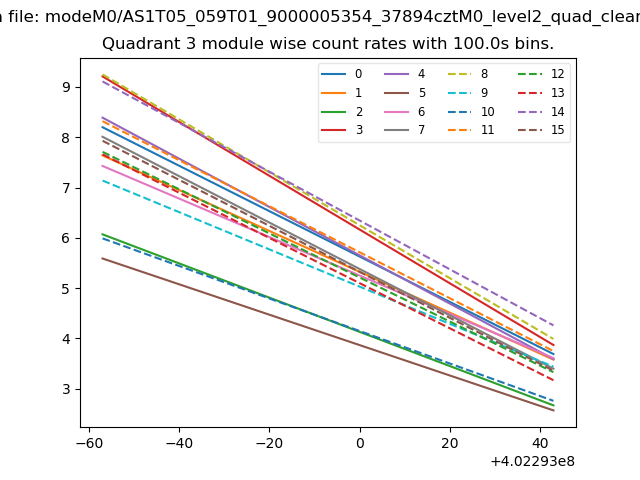 |
 |
| Parameter | Plot |
|---|---|
| CZT HV Monitor | 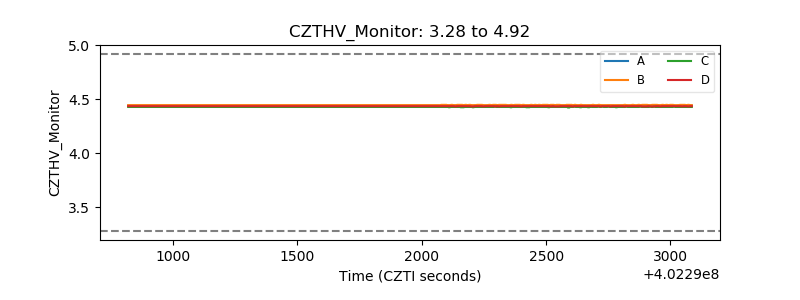 |
| D_VDD | 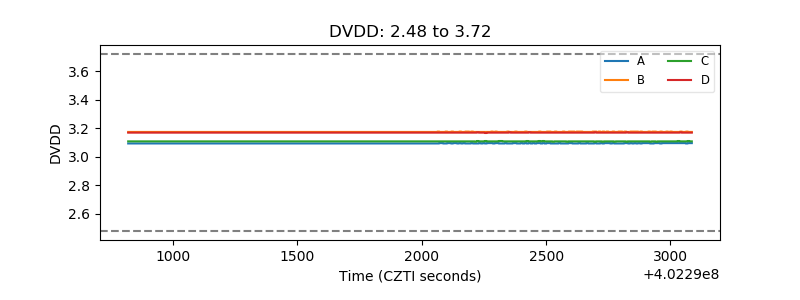 |
| Temperature 1 | 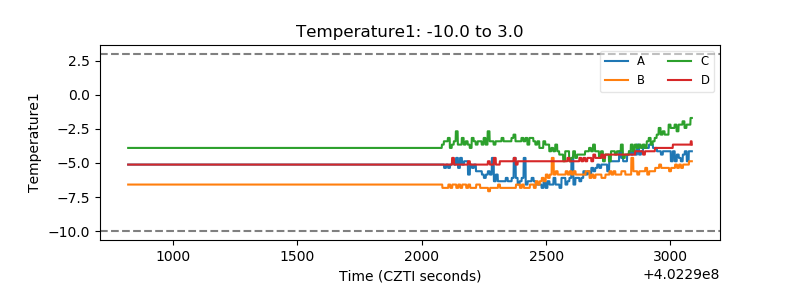 |
| Veto HV Monitor | 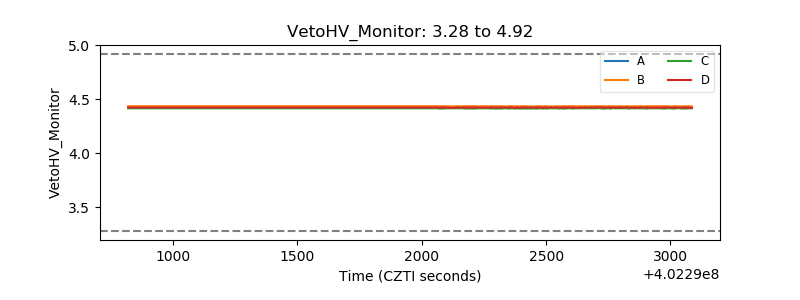 |
| Veto LLD | 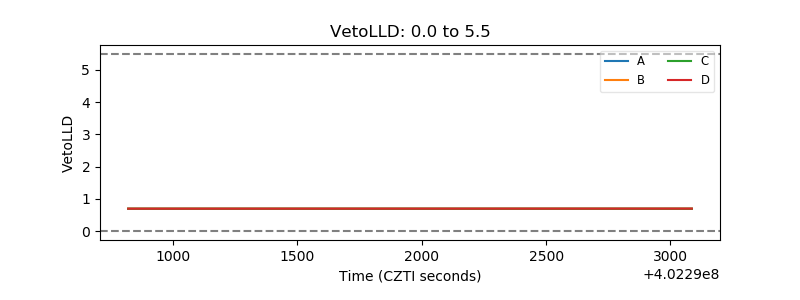 |
| Alpha Counter | 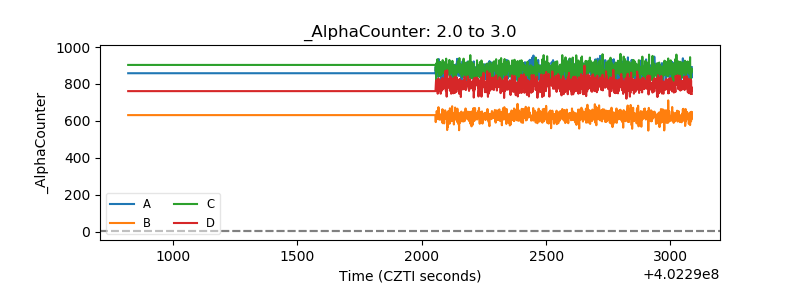 |
| _CPM_Rate | 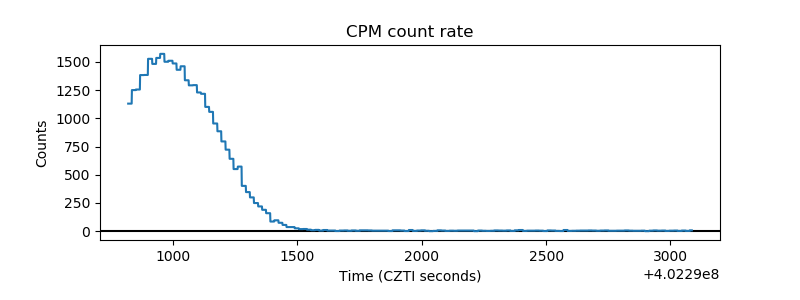 |
| CZT Counter | 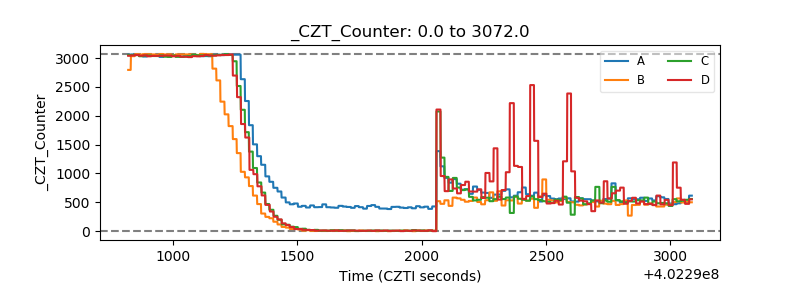 |
| +2.5 Volts monitor | 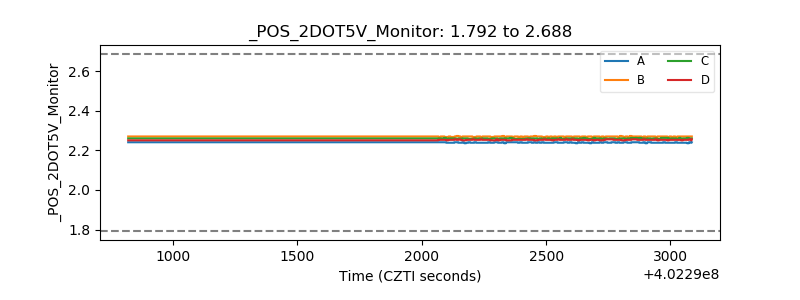 |
| +5 Volts monitor |  |
| _ROLL_ROT | 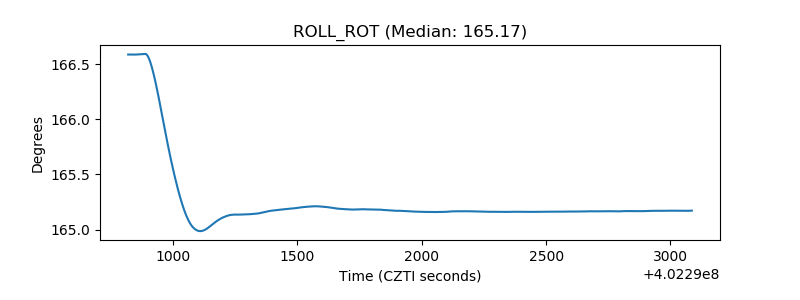 |
| _Roll_DEC | 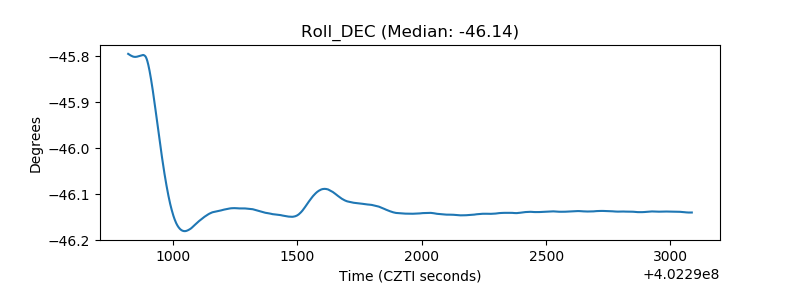 |
| _Roll_RA | 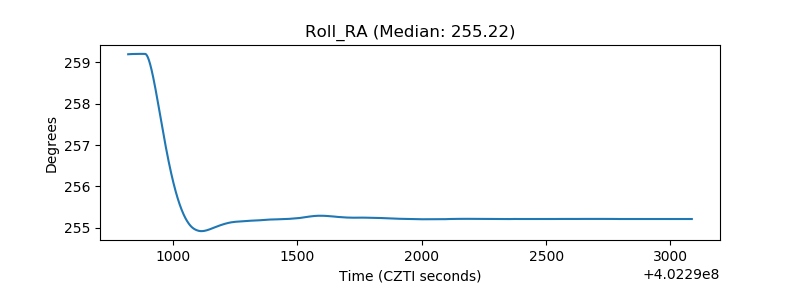 |
| Veto Counter | 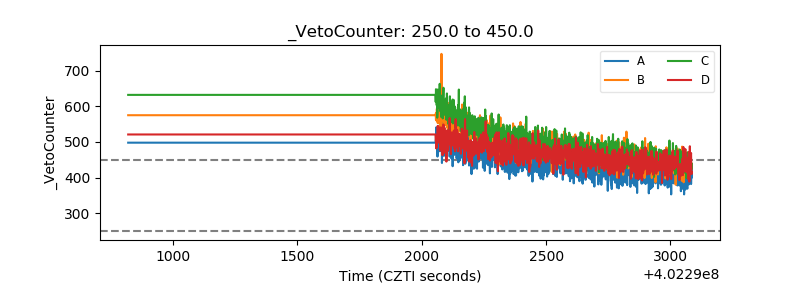 |