| Param | Original file | Final file |
|---|---|---|
| Filename | modeM0/AS1T05_059T01_9000005354_37895cztM0_level2.evt | modeM0/AS1T05_059T01_9000005354_37895cztM0_level2_quad_clean.evt |
| Size (bytes) | 437,054,400 | 65,030,400 |
| Size | 416.8 MB | 62.0 MB |
| Events in quadrant A | 3,088,603 | 412,747 |
| Events in quadrant B | 2,659,863 | 421,969 |
| Events in quadrant C | 3,145,546 | 407,777 |
| Events in quadrant D | 3,993,603 | 366,581 |
| Mode M0 | |||
|---|---|---|---|
| Quadrant | BADHDUFLAG | Total packets | Discarded packets |
| A | 0 | 12429 | 3 |
| B | 0 | 11047 | 2 |
| C | 0 | 12432 | 2 |
| D | 0 | 15266 | 2 |
| Mode SS | |||
|---|---|---|---|
| Quadrant | BADHDUFLAG | Total packets | Discarded packets |
| A | 0 | 104 | 0 |
| B | 0 | 104 | 0 |
| C | 0 | 104 | 0 |
| D | 0 | 104 | 0 |
| Mode M9 | |||
|---|---|---|---|
| Quadrant | BADHDUFLAG | Total packets | Discarded packets |
| A | 0 | 19 | 0 |
| B | 0 | 19 | 0 |
| C | 0 | 19 | 0 |
| D | 0 | 20 | 0 |
| Quadrant | Total seconds | Saturated seconds | Saturation percentage |
|---|---|---|---|
| A | 5140 | 19 | 0.369650% |
| B | 5140 | 32 | 0.622568% |
| C | 5140 | 84 | 1.634241% |
| D | 5140 | 196 | 3.813230% |
Noise dominated data is calculated using 1-second bins in cleaned event files. If a bin has >2000 counts, and if more than 50% of those come from <1% of pixels, then it is considered to be noise-dominated and hence unusable.
| Quadrant | # 1 sec bins | Bins with >0 counts | Bins with >2000 counts | High rate bins dominated by noise | Noise dominated (total time) | Noise dominated (detector-on time) | Marked lightcurve |
|---|---|---|---|---|---|---|---|
| A | 7023 | 5141 | 3 | 3 | 0.04% | 0.06% | 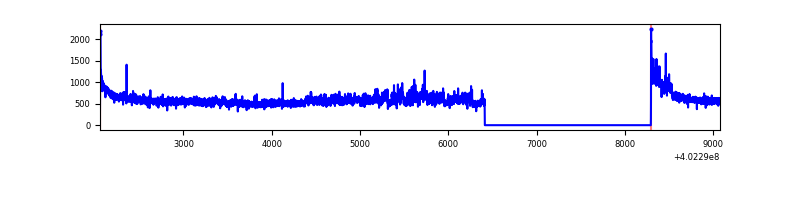 |
| B | 7023 | 5141 | 19 | 19 | 0.27% | 0.37% | 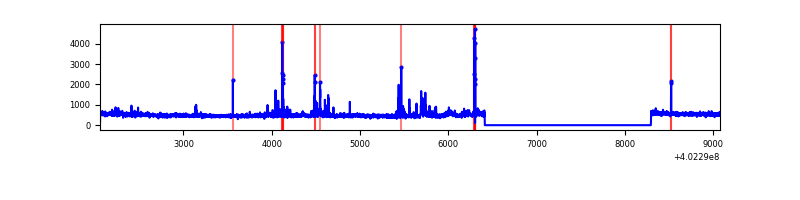 |
| C | 7023 | 5141 | 57 | 57 | 0.81% | 1.11% | 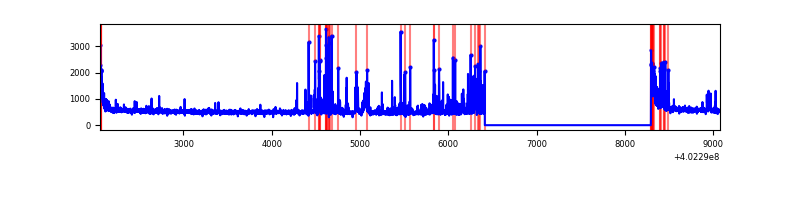 |
| D | 7023 | 5141 | 172 | 172 | 2.45% | 3.35% | 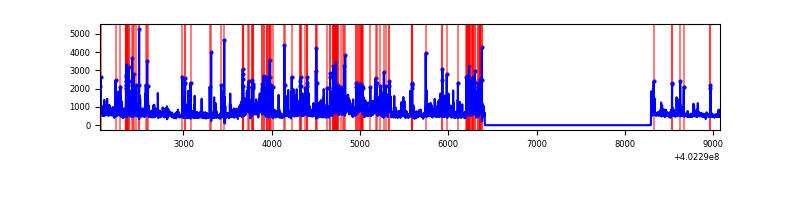 |
Top three noisy pixels from each quadrant. If the there are fewer than three noisy pixels in the level2.evt file, extra rows are filled as -1
| Pixel properties | Quadrant properties | ||||||
|---|---|---|---|---|---|---|---|
| Quadrant | DetID | PixID | Counts | Sigma | Mean | Median | Sigma |
| A | 10 | 83 | 352470 | 2820.25 | 621 | 611 | 124.8 |
| A | 15 | 222 | 296945 | 2375.2 | 621 | 611 | 124.8 |
| A | 13 | 6 | 15836 | 122.03 | 621 | 611 | 124.8 |
| B | 5 | 172 | 105946 | 905.83 | 614 | 602 | 116.3 |
| B | 0 | 213 | 57812 | 491.94 | 614 | 602 | 116.3 |
| B | 0 | 229 | 32211 | 271.8 | 614 | 602 | 116.3 |
| C | 14 | 254 | 432325 | 3117.47 | 602 | 607 | 138.5 |
| C | 15 | 214 | 220691 | 1589.24 | 602 | 607 | 138.5 |
| C | 0 | 10 | 128536 | 923.78 | 602 | 607 | 138.5 |
| D | 1 | 52 | 436047 | 2942.96 | 600 | 584 | 148.0 |
| D | 9 | 49 | 378861 | 2556.49 | 600 | 584 | 148.0 |
| D | 2 | 249 | 326536 | 2202.86 | 600 | 584 | 148.0 |
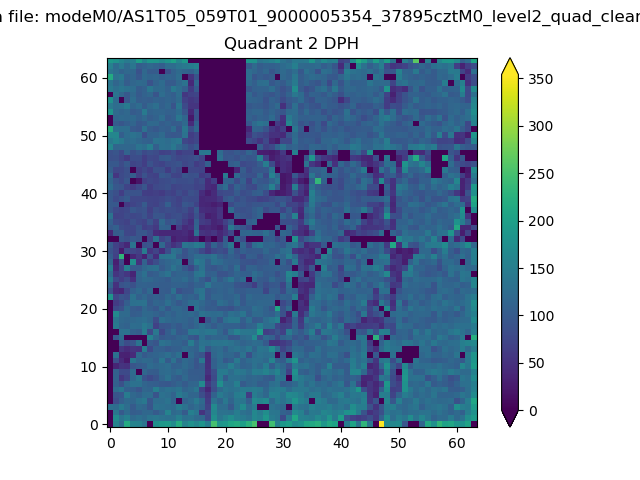
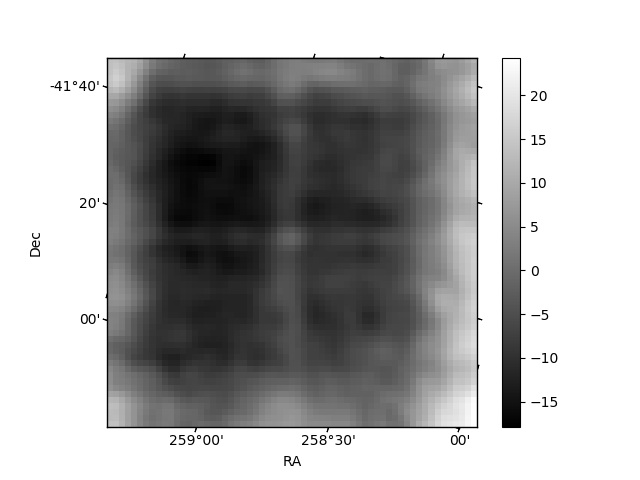
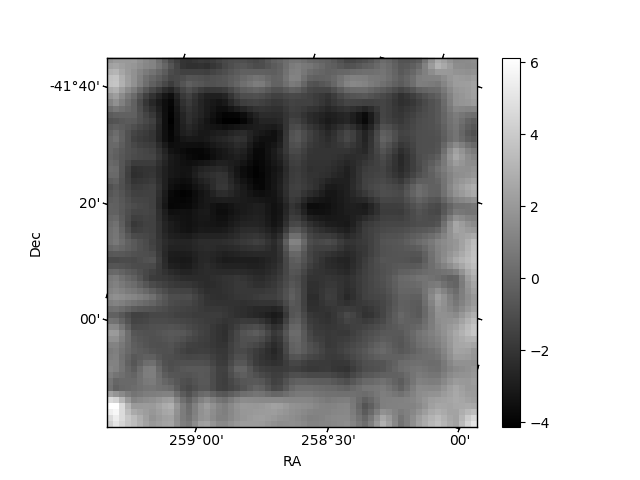
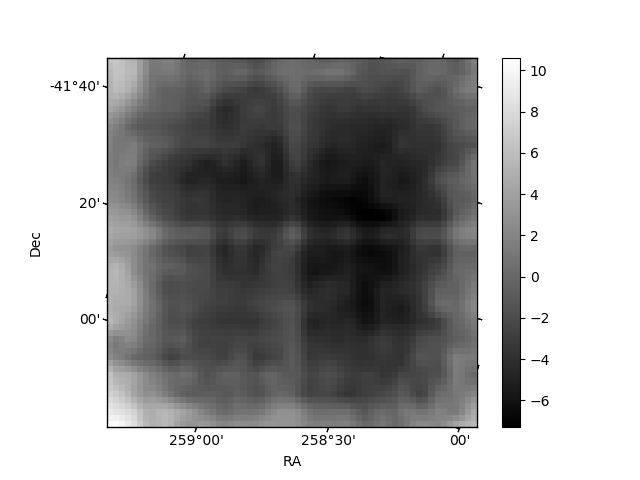
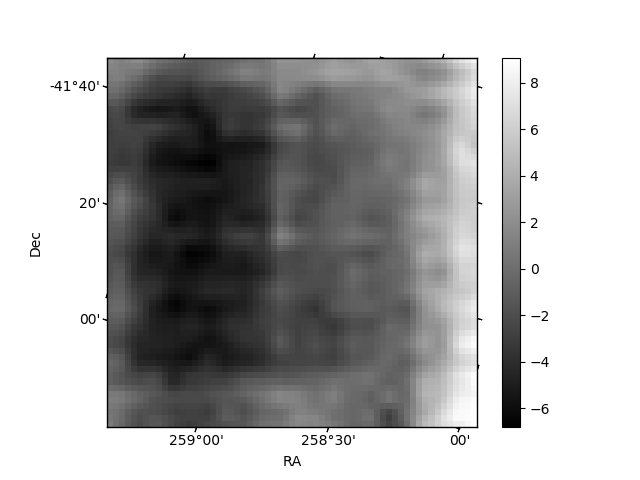
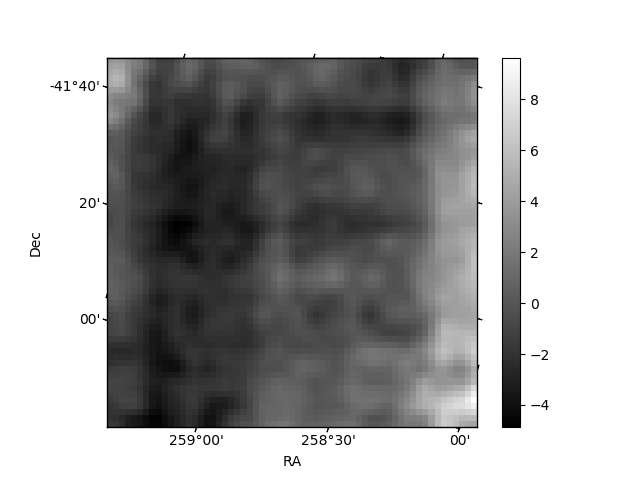
Histogram calculated using DETX and DETY for each event in the final _common_clean file
| Quadrant A | 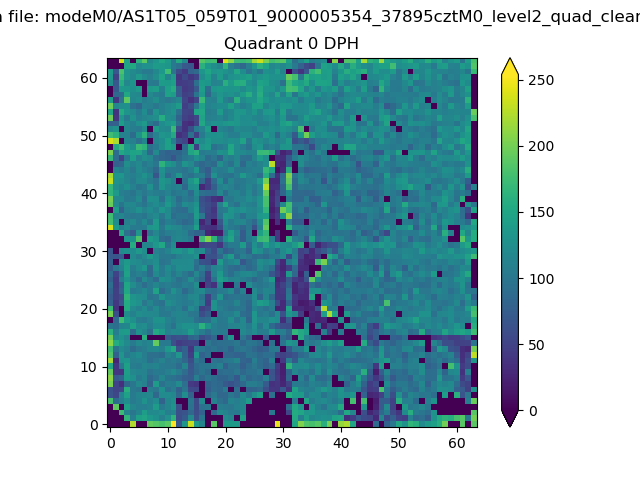 |
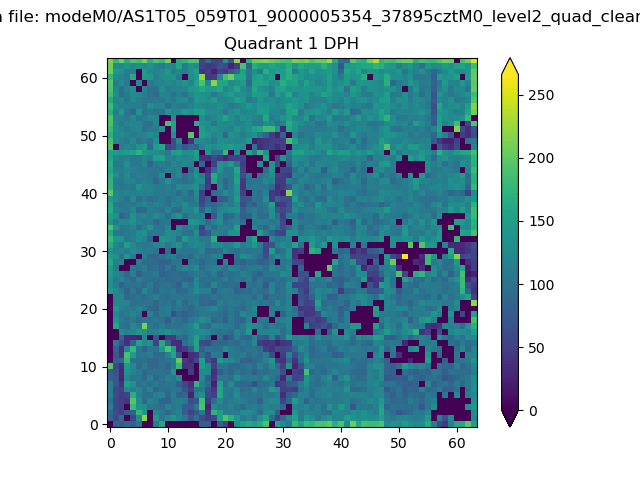 |
Quadrant B |
|---|---|---|---|
| Quadrant D | 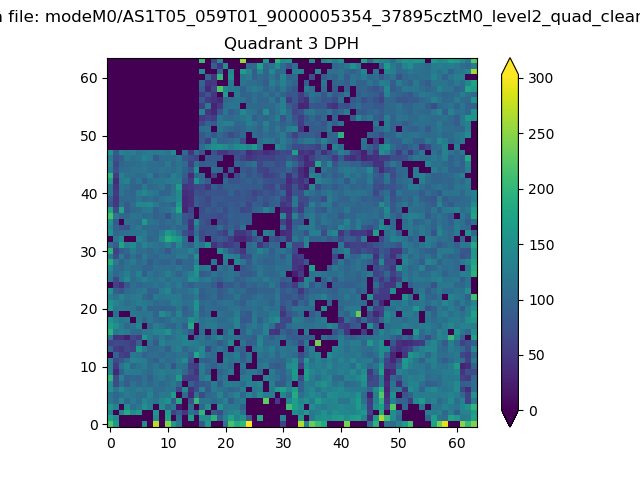 |
 |
Quadrant C |
| Plot type | Count rate plots | Images |
|---|---|---|
| Comparison with Poisson distribution Blue bars denote a histogram of data divided into 1 sec bins. Red curve is a Poisson curve with rate = median count rate of data. |
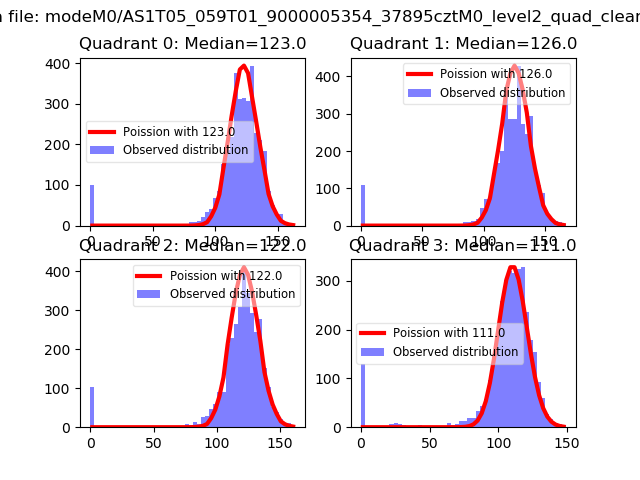 |
 |
| Quadrant-wise count rates Data is divided into 100 sec bins |
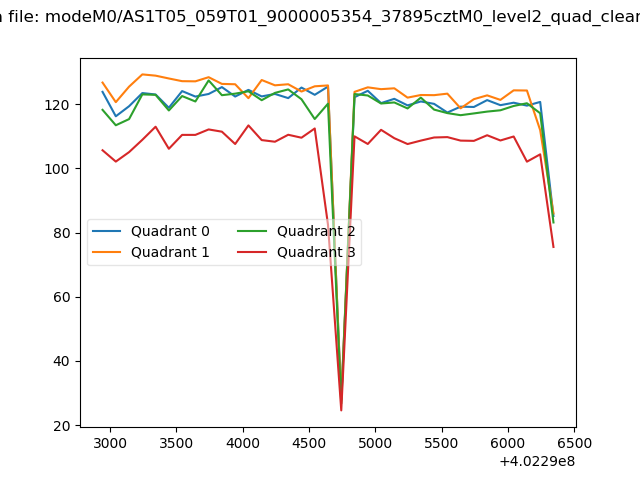 |
|
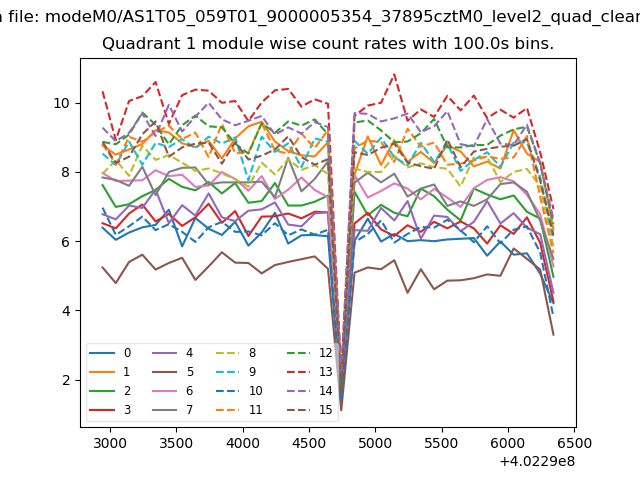
| Module-wise count rates for Quadrant A Data is divided into 100 sec bins |
 |
 |
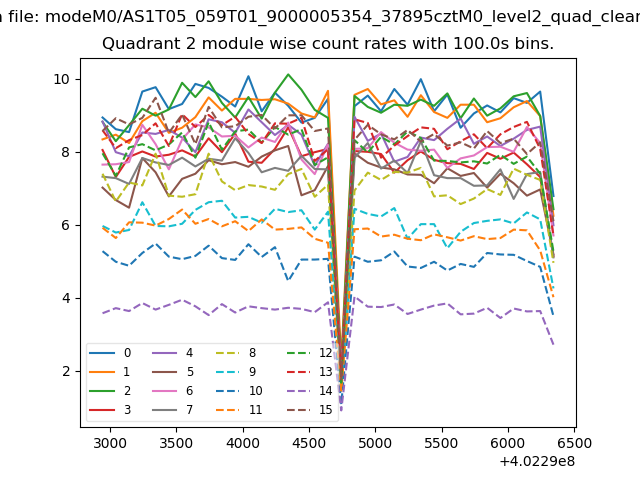
| Module-wise count rates for Quadrant B Data is divided into 100 sec bins |
 |
 |
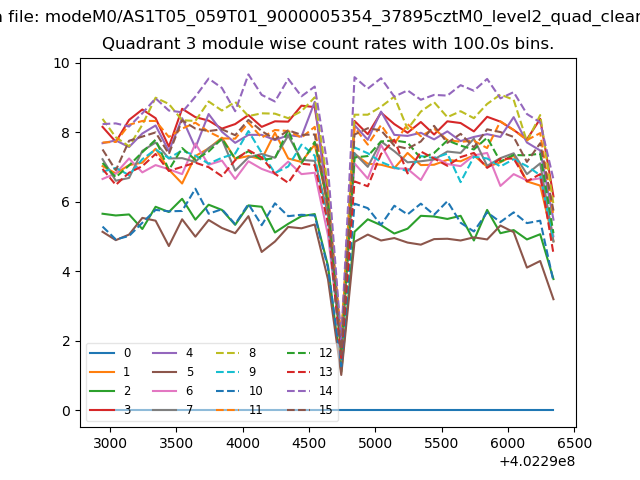
| Module-wise count rates for Quadrant C Data is divided into 100 sec bins |
 |
 |
| Module-wise count rates for Quadrant D Data is divided into 100 sec bins |
 |
 |
| Parameter | Plot |
|---|---|
| CZT HV Monitor | 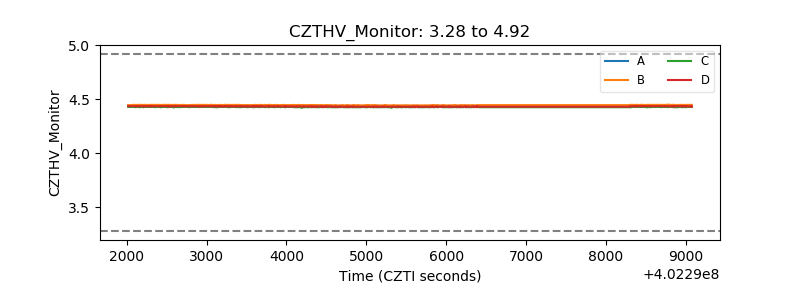 |
| D_VDD | 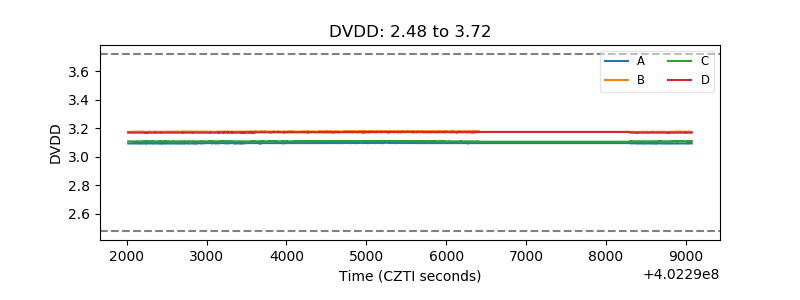 |
| Temperature 1 | 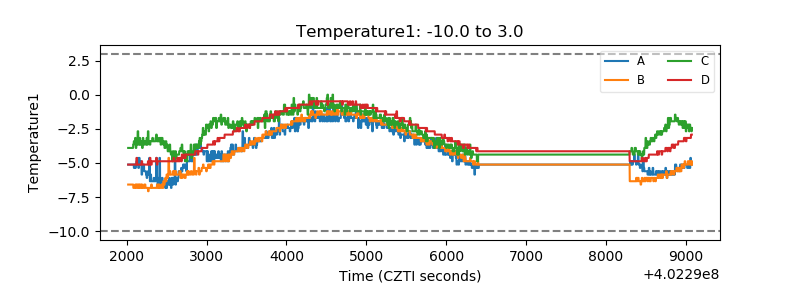 |
| Veto HV Monitor |  |
| Veto LLD | 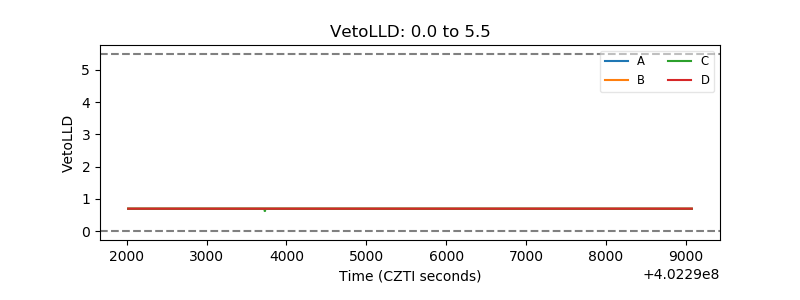 |
| Alpha Counter | 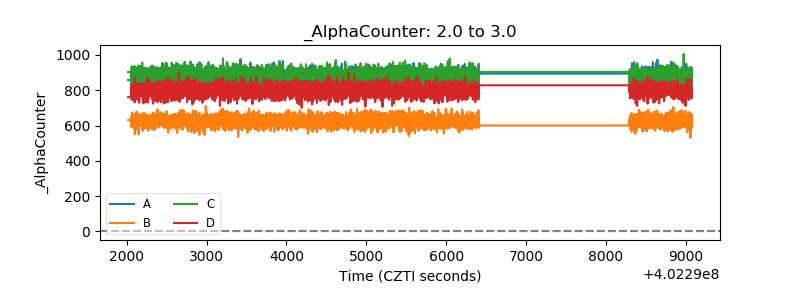 |
| _CPM_Rate | 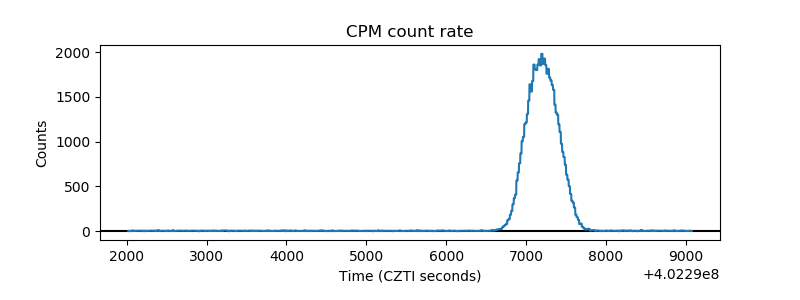 |
| CZT Counter | 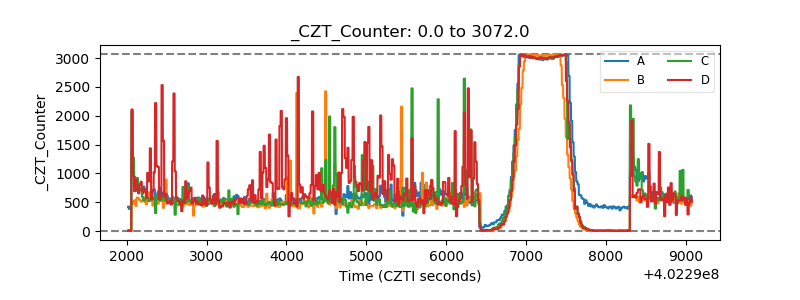 |
| +2.5 Volts monitor |  |
| +5 Volts monitor | 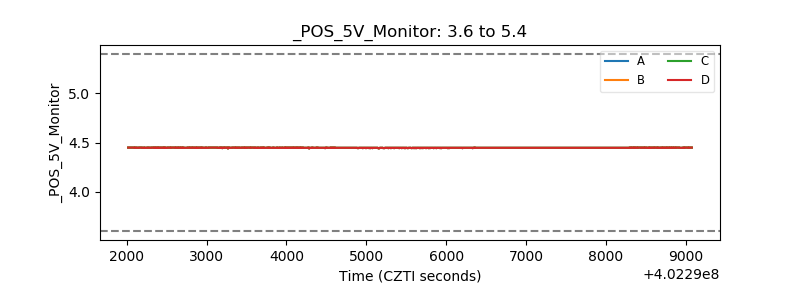 |
| _ROLL_ROT | 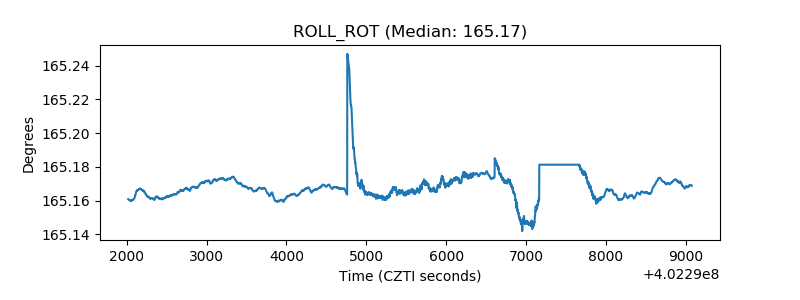 |
| _Roll_DEC | 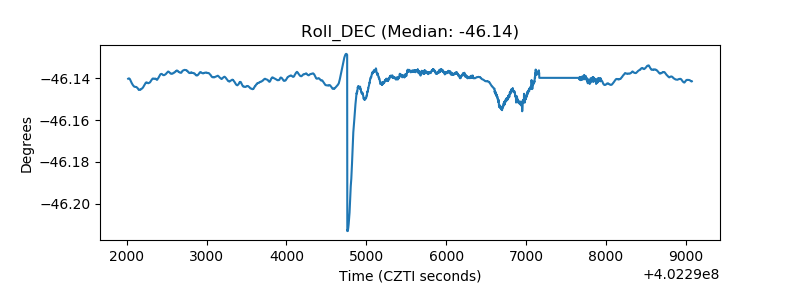 |
| _Roll_RA | 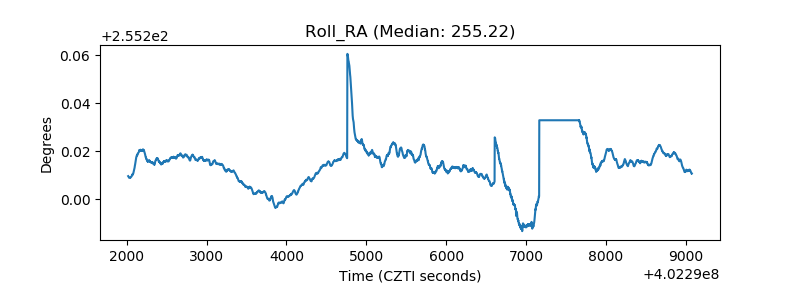 |
| Veto Counter | 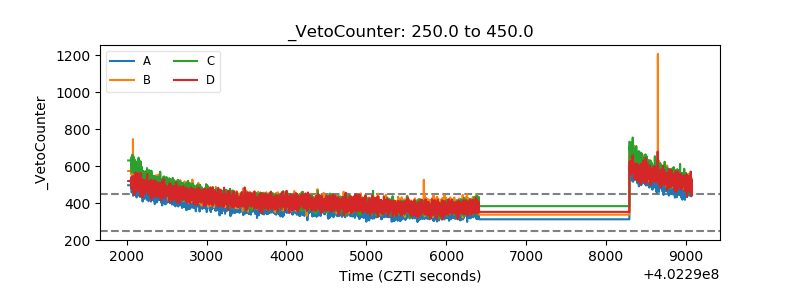 |