| Param | Original file | Final file |
|---|---|---|
| Filename | modeM0/AS1T05_059T01_9000005354_37896cztM0_level2.evt | modeM0/AS1T05_059T01_9000005354_37896cztM0_level2_quad_clean.evt |
| Size (bytes) | 419,330,880 | 57,332,160 |
| Size | 399.9 MB | 54.7 MB |
| Events in quadrant A | 2,948,881 | 355,140 |
| Events in quadrant B | 3,050,563 | 353,351 |
| Events in quadrant C | 2,916,284 | 351,611 |
| Events in quadrant D | 3,439,898 | 320,853 |
| Mode M0 | |||
|---|---|---|---|
| Quadrant | BADHDUFLAG | Total packets | Discarded packets |
| A | 0 | 11755 | 3 |
| B | 0 | 12056 | 2 |
| C | 0 | 11724 | 2 |
| D | 0 | 13423 | 2 |
| Mode SS | |||
|---|---|---|---|
| Quadrant | BADHDUFLAG | Total packets | Discarded packets |
| A | 0 | 104 | 0 |
| B | 0 | 104 | 0 |
| C | 0 | 104 | 0 |
| D | 0 | 104 | 0 |
| Mode M9 | |||
|---|---|---|---|
| Quadrant | BADHDUFLAG | Total packets | Discarded packets |
| A | 0 | 25 | 0 |
| B | 0 | 25 | 0 |
| C | 0 | 25 | 0 |
| D | 0 | 26 | 0 |
| Quadrant | Total seconds | Saturated seconds | Saturation percentage |
|---|---|---|---|
| A | 5063 | 20 | 0.395023% |
| B | 5063 | 92 | 1.817104% |
| C | 5063 | 57 | 1.125815% |
| D | 5063 | 128 | 2.528145% |
Noise dominated data is calculated using 1-second bins in cleaned event files. If a bin has >2000 counts, and if more than 50% of those come from <1% of pixels, then it is considered to be noise-dominated and hence unusable.
| Quadrant | # 1 sec bins | Bins with >0 counts | Bins with >2000 counts | High rate bins dominated by noise | Noise dominated (total time) | Noise dominated (detector-on time) | Marked lightcurve |
|---|---|---|---|---|---|---|---|
| A | 7065 | 5064 | 7 | 7 | 0.10% | 0.14% | 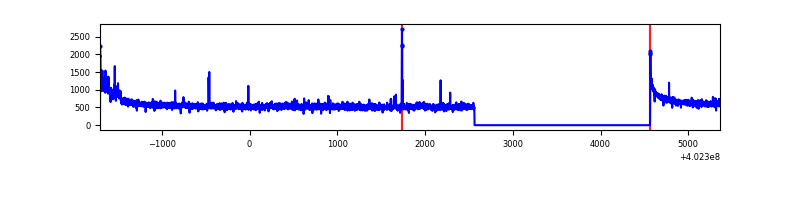 |
| B | 7065 | 5064 | 72 | 72 | 1.02% | 1.42% | 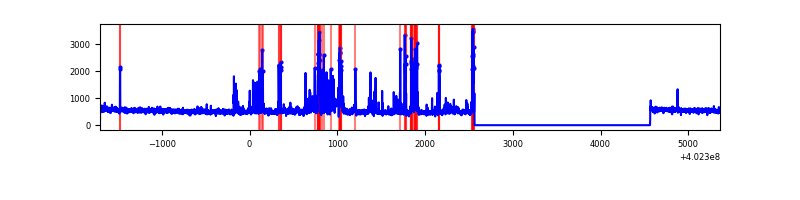 |
| C | 7065 | 5064 | 31 | 31 | 0.44% | 0.61% | 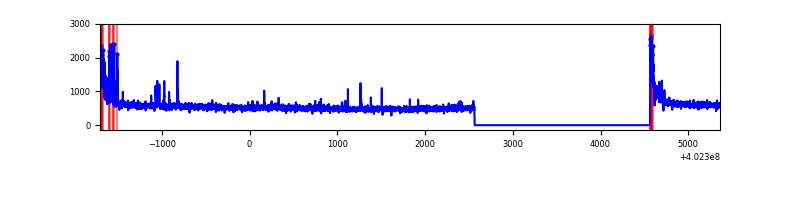 |
| D | 7065 | 5064 | 105 | 105 | 1.49% | 2.07% | 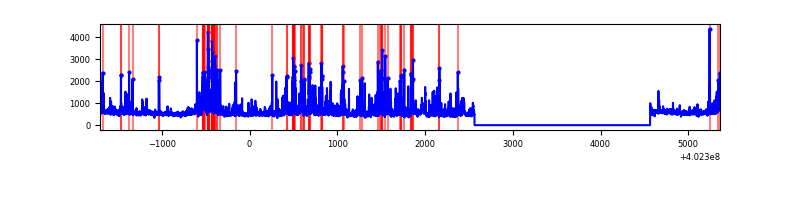 |
Top three noisy pixels from each quadrant. If the there are fewer than three noisy pixels in the level2.evt file, extra rows are filled as -1
| Pixel properties | Quadrant properties | ||||||
|---|---|---|---|---|---|---|---|
| Quadrant | DetID | PixID | Counts | Sigma | Mean | Median | Sigma |
| A | 10 | 83 | 341559 | 2674.28 | 639 | 629 | 127.5 |
| A | 15 | 222 | 66307 | 515.18 | 639 | 629 | 127.5 |
| A | 7 | 3 | 26130 | 200.03 | 639 | 629 | 127.5 |
| B | 5 | 172 | 436144 | 3678.1 | 628 | 612 | 118.4 |
| B | 0 | 213 | 34029 | 282.21 | 628 | 612 | 118.4 |
| B | 0 | 229 | 22769 | 187.12 | 628 | 612 | 118.4 |
| C | 15 | 214 | 217926 | 1533.01 | 619 | 626 | 141.7 |
| C | 0 | 10 | 177312 | 1246.49 | 619 | 626 | 141.7 |
| C | 14 | 254 | 92485 | 648.05 | 619 | 626 | 141.7 |
| D | 2 | 249 | 240843 | 1601.68 | 619 | 605 | 150.0 |
| D | 1 | 52 | 191629 | 1273.57 | 619 | 605 | 150.0 |
| D | 7 | 223 | 148866 | 988.46 | 619 | 605 | 150.0 |
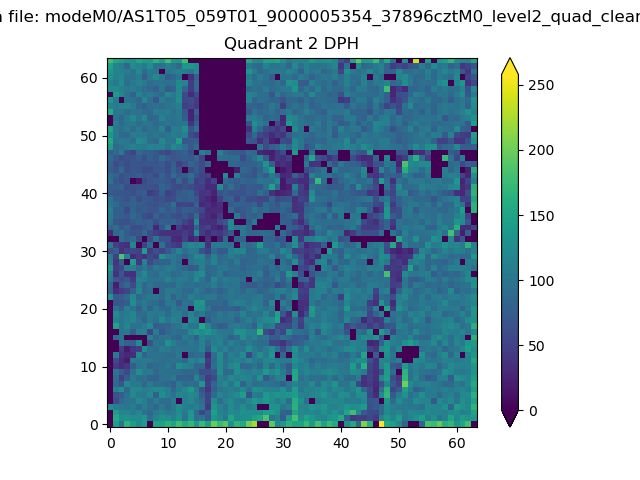
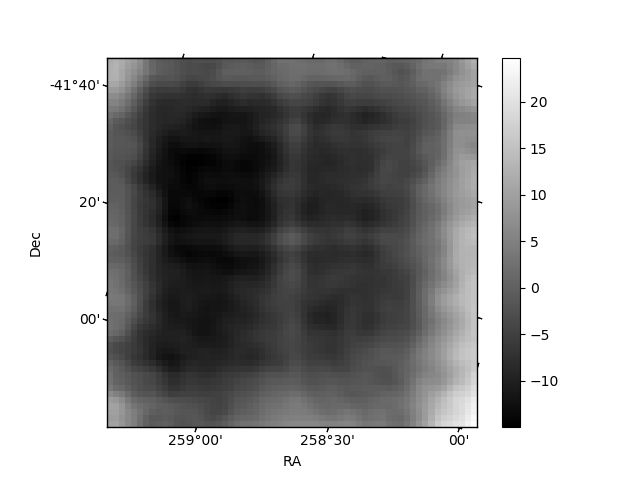
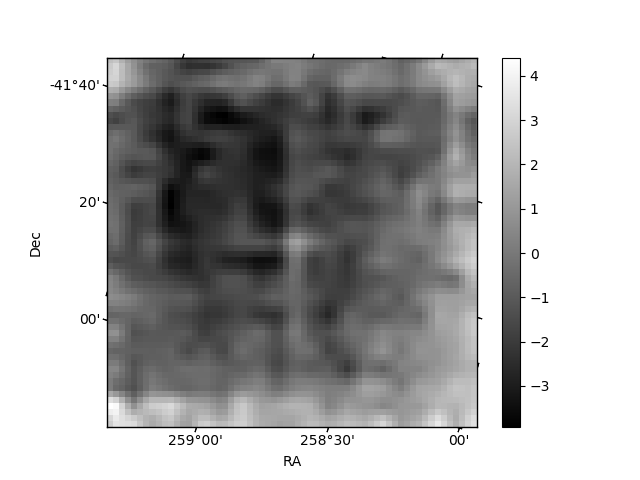
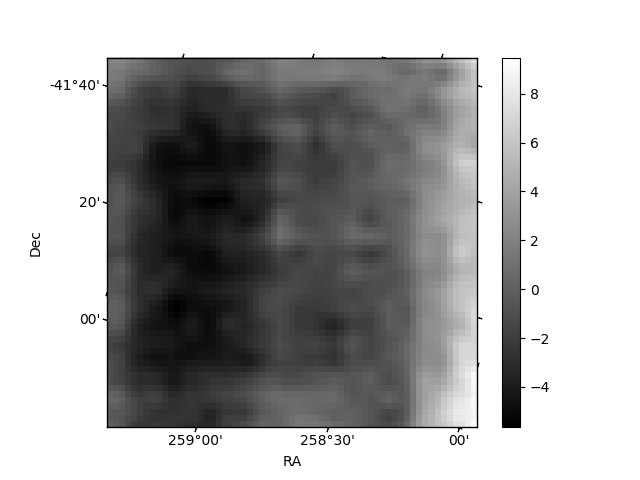
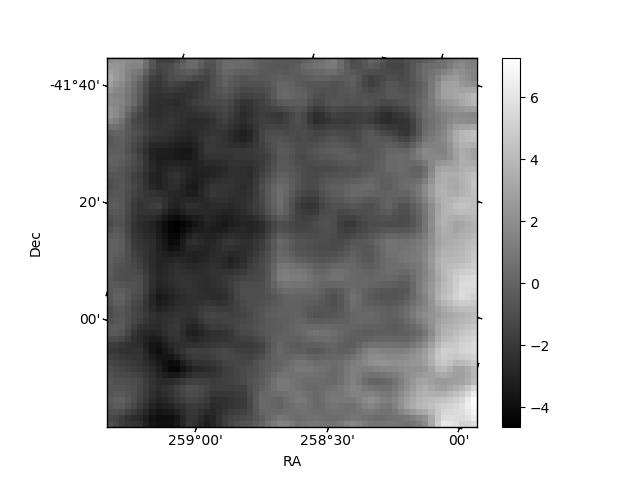
Histogram calculated using DETX and DETY for each event in the final _common_clean file
| Quadrant A | 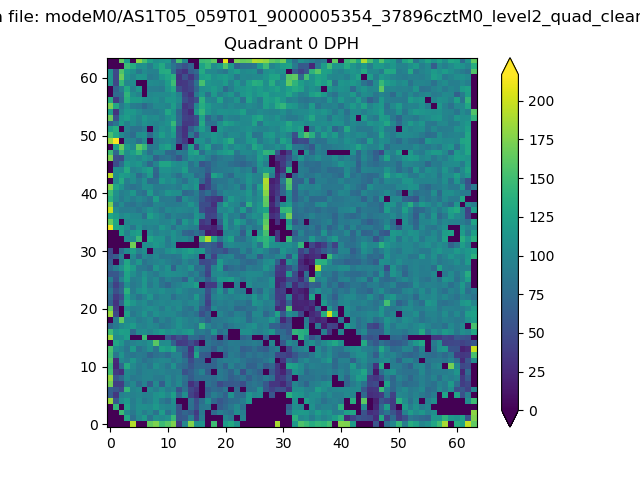 |
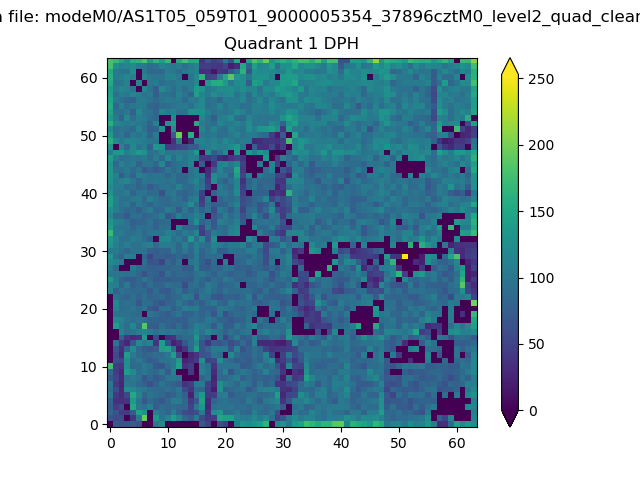 |
Quadrant B |
|---|---|---|---|
| Quadrant D | 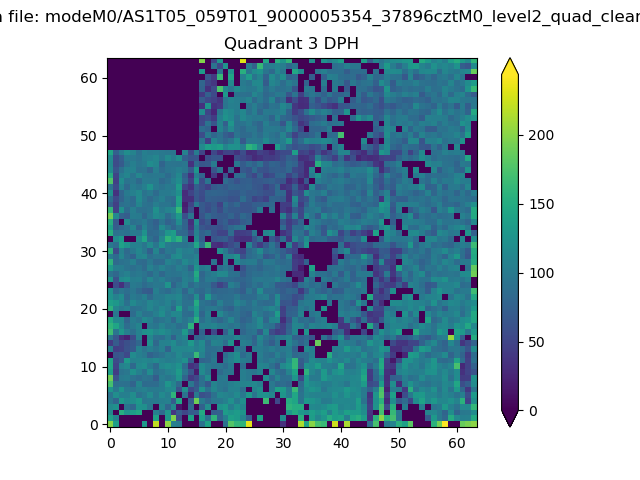 |
 |
Quadrant C |
| Plot type | Count rate plots | Images |
|---|---|---|
| Comparison with Poisson distribution Blue bars denote a histogram of data divided into 1 sec bins. Red curve is a Poisson curve with rate = median count rate of data. |
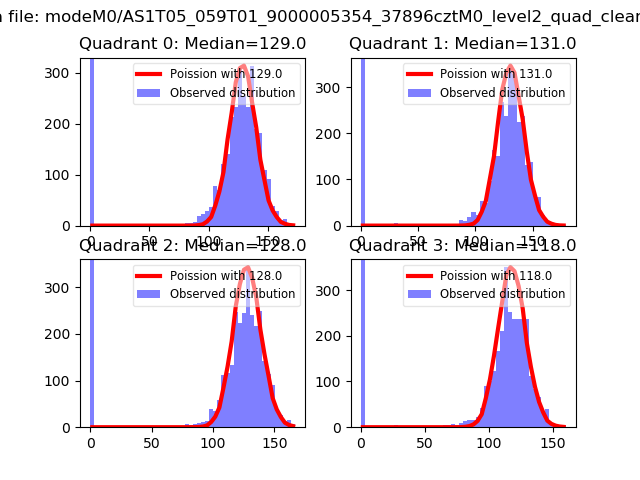 |
 |
| Quadrant-wise count rates Data is divided into 100 sec bins |
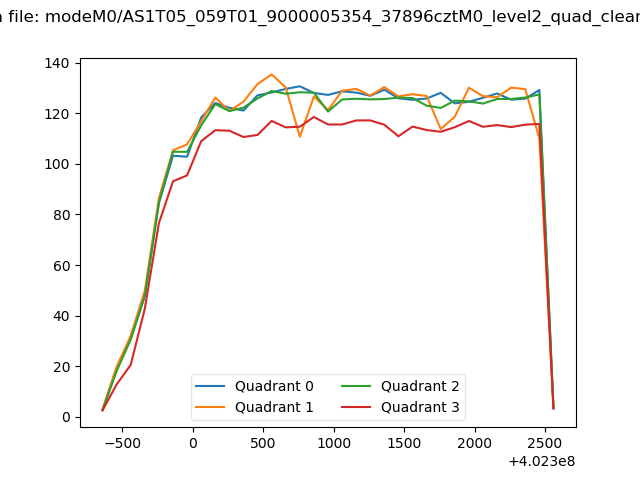 |
|
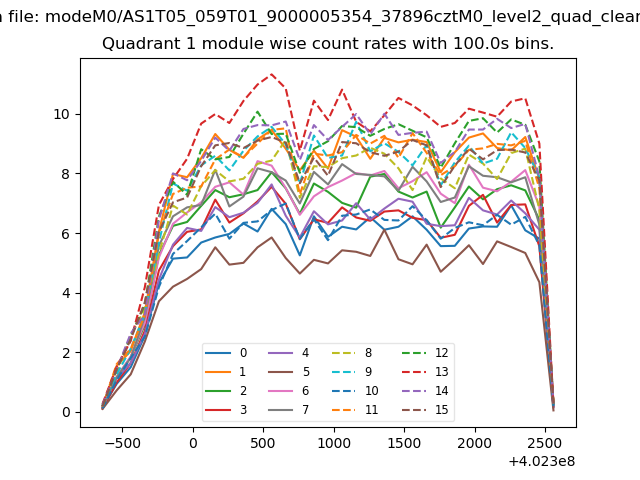
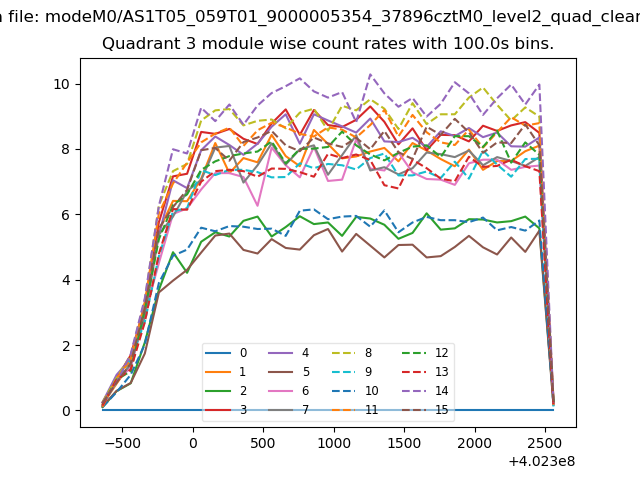
| Module-wise count rates for Quadrant A Data is divided into 100 sec bins |
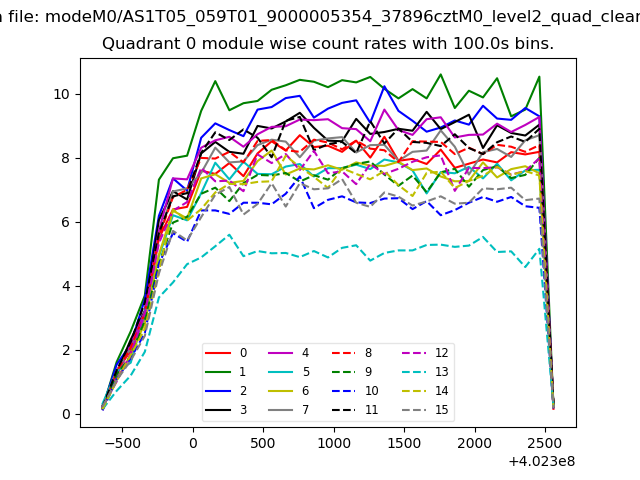 |
 |
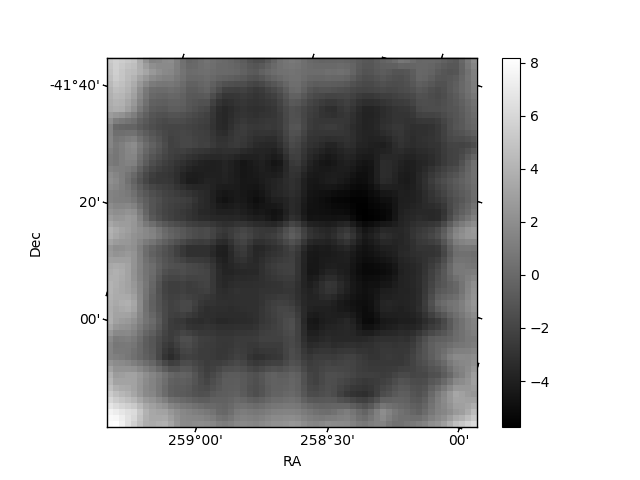
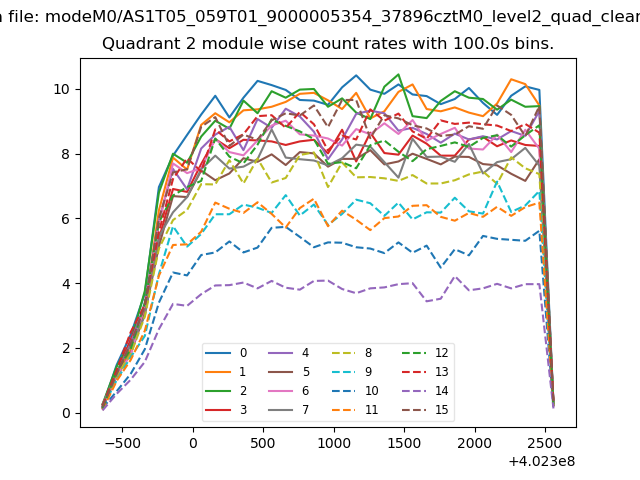
| Module-wise count rates for Quadrant B Data is divided into 100 sec bins |
 |
 |
| Module-wise count rates for Quadrant C Data is divided into 100 sec bins |
 |
 |
| Module-wise count rates for Quadrant D Data is divided into 100 sec bins |
 |
 |
| Parameter | Plot |
|---|---|
| CZT HV Monitor |  |
| D_VDD | 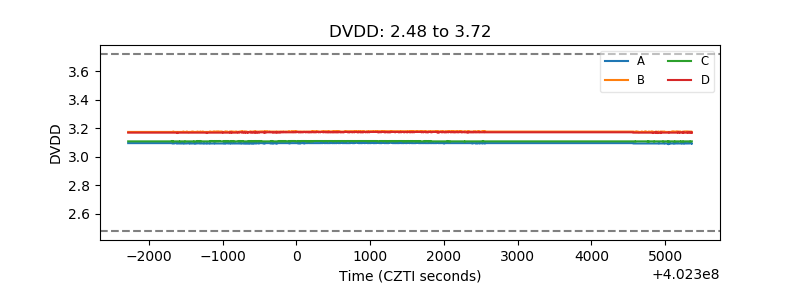 |
| Temperature 1 | 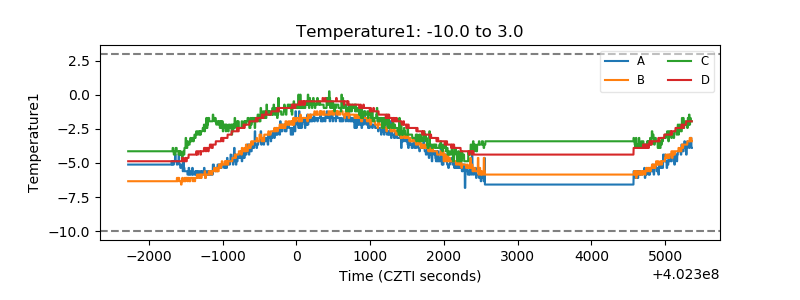 |
| Veto HV Monitor | 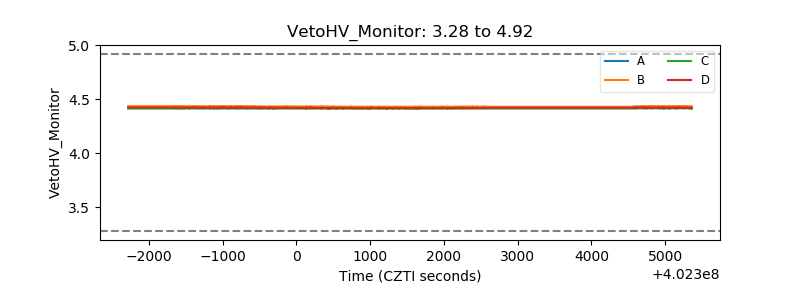 |
| Veto LLD | 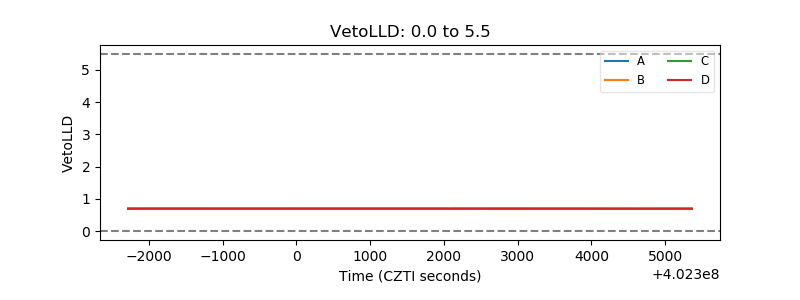 |
| Alpha Counter | 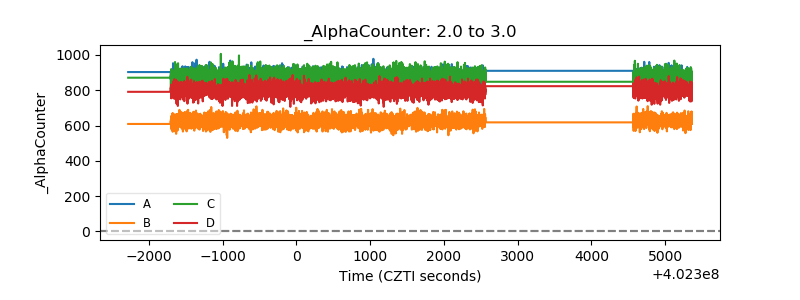 |
| _CPM_Rate | 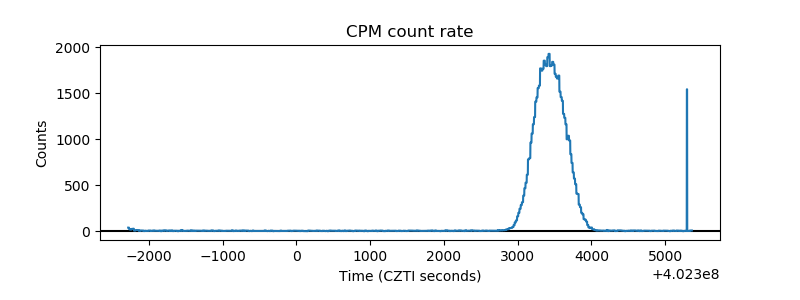 |
| CZT Counter | 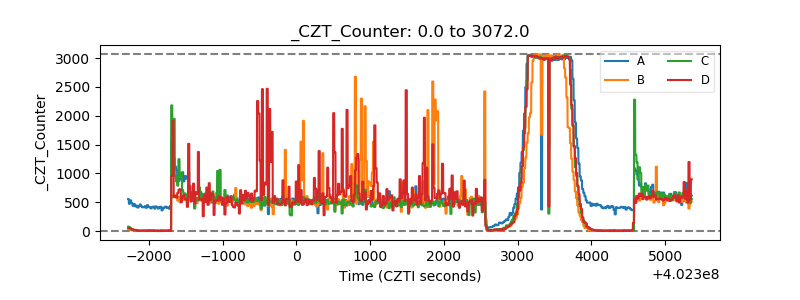 |
| +2.5 Volts monitor | 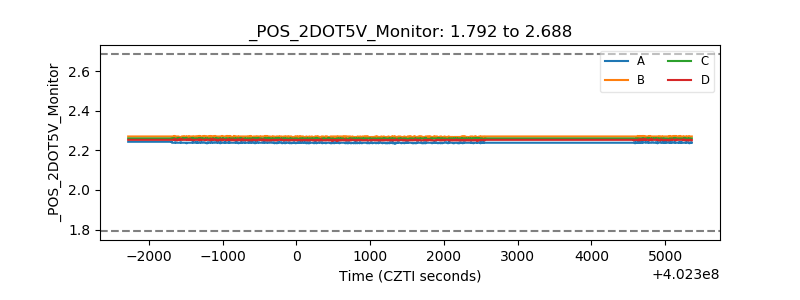 |
| +5 Volts monitor |  |
| _ROLL_ROT | 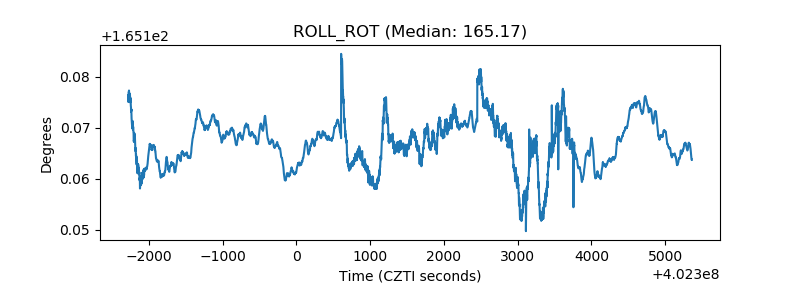 |
| _Roll_DEC | 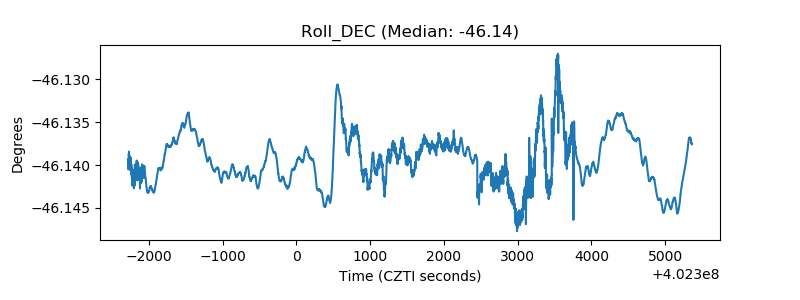 |
| _Roll_RA | 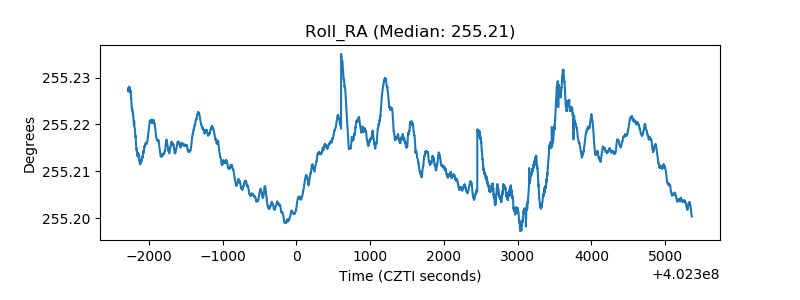 |
| Veto Counter | 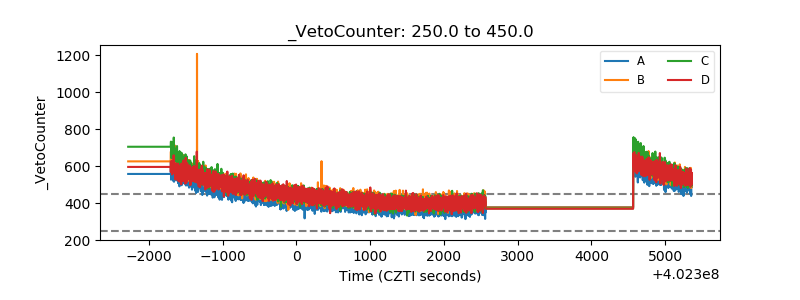 |