| Param | Original file | Final file |
|---|---|---|
| Filename | modeM0/AS1T05_059T01_9000005354_37897cztM0_level2.evt | modeM0/AS1T05_059T01_9000005354_37897cztM0_level2_quad_clean.evt |
| Size (bytes) | 416,525,760 | 51,364,800 |
| Size | 397.2 MB | 49.0 MB |
| Events in quadrant A | 2,917,500 | 312,115 |
| Events in quadrant B | 2,667,771 | 310,281 |
| Events in quadrant C | 2,906,780 | 305,413 |
| Events in quadrant D | 3,784,673 | 278,475 |
| Mode M0 | |||
|---|---|---|---|
| Quadrant | BADHDUFLAG | Total packets | Discarded packets |
| A | 0 | 11777 | 3 |
| B | 0 | 10860 | 2 |
| C | 0 | 11766 | 2 |
| D | 0 | 14585 | 2 |
| Mode SS | |||
|---|---|---|---|
| Quadrant | BADHDUFLAG | Total packets | Discarded packets |
| A | 0 | 102 | 0 |
| B | 0 | 102 | 0 |
| C | 0 | 102 | 0 |
| D | 0 | 102 | 0 |
| Mode M9 | |||
|---|---|---|---|
| Quadrant | BADHDUFLAG | Total packets | Discarded packets |
| A | 0 | 29 | 0 |
| B | 0 | 29 | 0 |
| C | 0 | 29 | 0 |
| D | 0 | 30 | 0 |
| Quadrant | Total seconds | Saturated seconds | Saturation percentage |
|---|---|---|---|
| A | 4973 | 17 | 0.341846% |
| B | 4973 | 50 | 1.005429% |
| C | 4973 | 55 | 1.105972% |
| D | 4973 | 184 | 3.699980% |
Noise dominated data is calculated using 1-second bins in cleaned event files. If a bin has >2000 counts, and if more than 50% of those come from <1% of pixels, then it is considered to be noise-dominated and hence unusable.
| Quadrant | # 1 sec bins | Bins with >0 counts | Bins with >2000 counts | High rate bins dominated by noise | Noise dominated (total time) | Noise dominated (detector-on time) | Marked lightcurve |
|---|---|---|---|---|---|---|---|
| A | 7065 | 4974 | 7 | 7 | 0.10% | 0.14% | 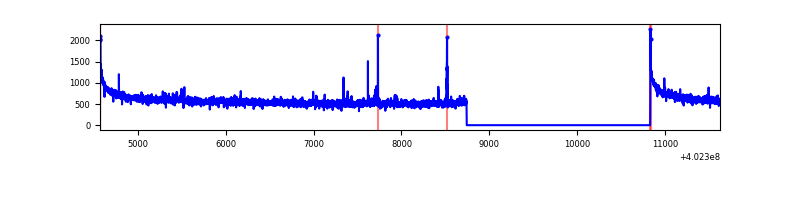 |
| B | 7065 | 4974 | 33 | 33 | 0.47% | 0.66% | 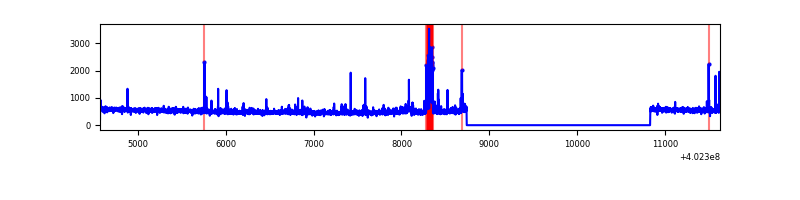 |
| C | 7065 | 4974 | 35 | 35 | 0.50% | 0.70% | 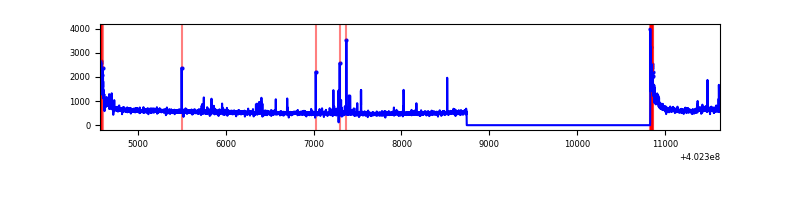 |
| D | 7065 | 4974 | 167 | 167 | 2.36% | 3.36% | 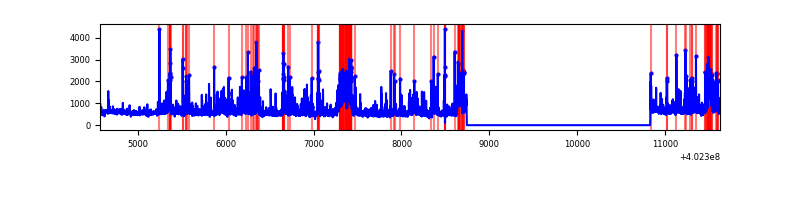 |
Top three noisy pixels from each quadrant. If the there are fewer than three noisy pixels in the level2.evt file, extra rows are filled as -1
| Pixel properties | Quadrant properties | ||||||
|---|---|---|---|---|---|---|---|
| Quadrant | DetID | PixID | Counts | Sigma | Mean | Median | Sigma |
| A | 10 | 83 | 342320 | 2712.47 | 634 | 625 | 126.0 |
| A | 15 | 222 | 37265 | 290.86 | 634 | 625 | 126.0 |
| A | 13 | 6 | 26950 | 208.98 | 634 | 625 | 126.0 |
| B | 5 | 172 | 155762 | 1339.34 | 621 | 606 | 115.8 |
| B | 0 | 213 | 30395 | 257.14 | 621 | 606 | 115.8 |
| B | 12 | 111 | 13408 | 110.51 | 621 | 606 | 115.8 |
| C | 0 | 10 | 215976 | 1546.96 | 609 | 615 | 139.2 |
| C | 15 | 214 | 213543 | 1529.48 | 609 | 615 | 139.2 |
| C | 14 | 254 | 65740 | 467.8 | 609 | 615 | 139.2 |
| D | 1 | 52 | 357052 | 2397.53 | 611 | 597 | 148.7 |
| D | 2 | 249 | 219704 | 1473.72 | 611 | 597 | 148.7 |
| D | 7 | 223 | 204741 | 1373.08 | 611 | 597 | 148.7 |
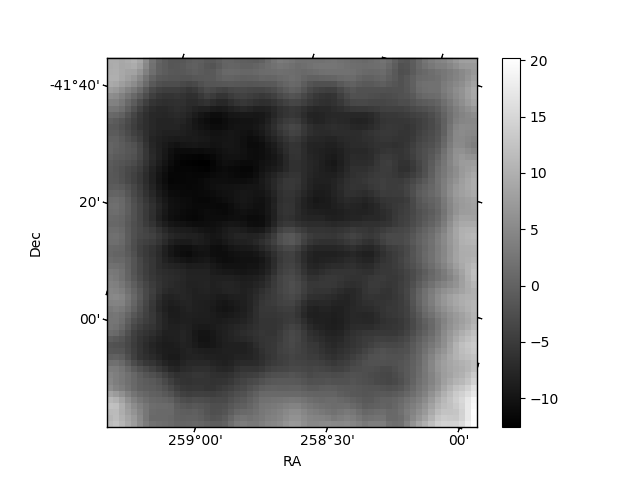
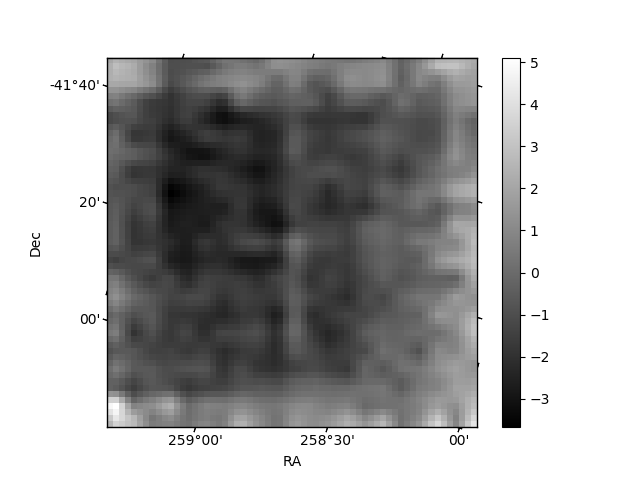
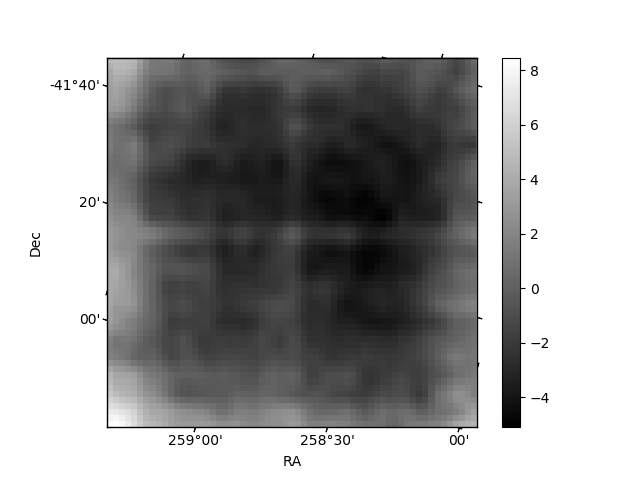
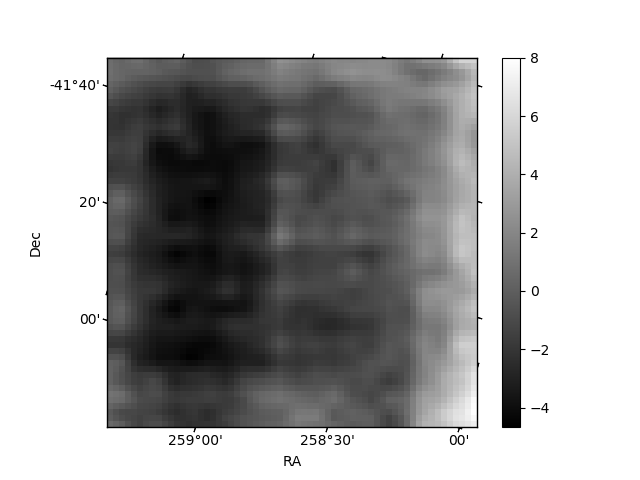
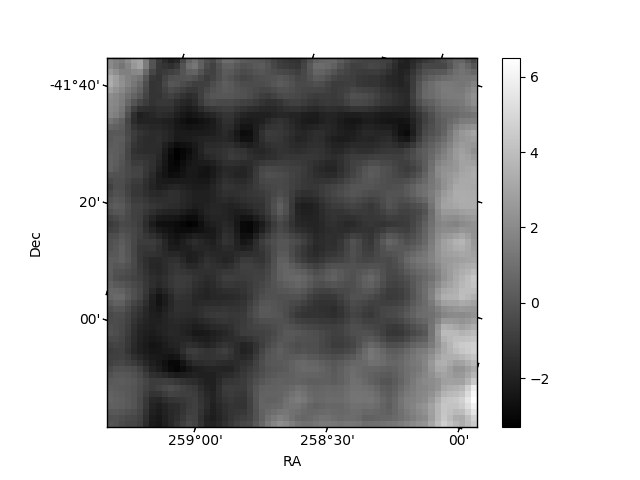
Histogram calculated using DETX and DETY for each event in the final _common_clean file
| Quadrant A | 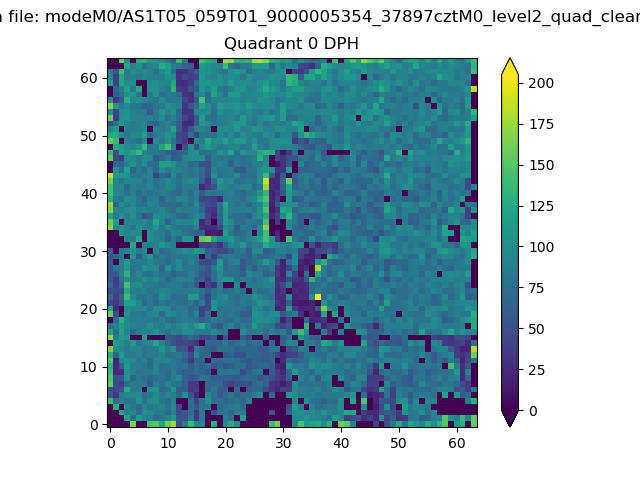 |
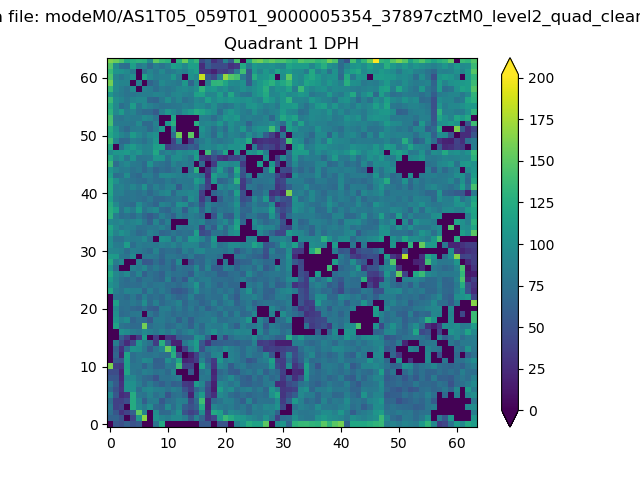 |
Quadrant B |
|---|---|---|---|
| Quadrant D | 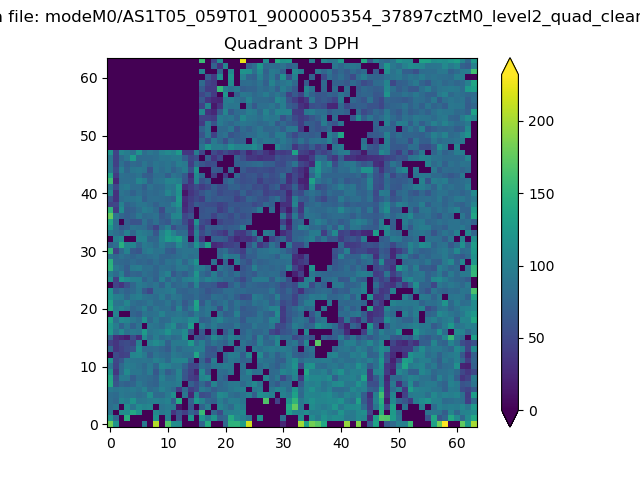 |
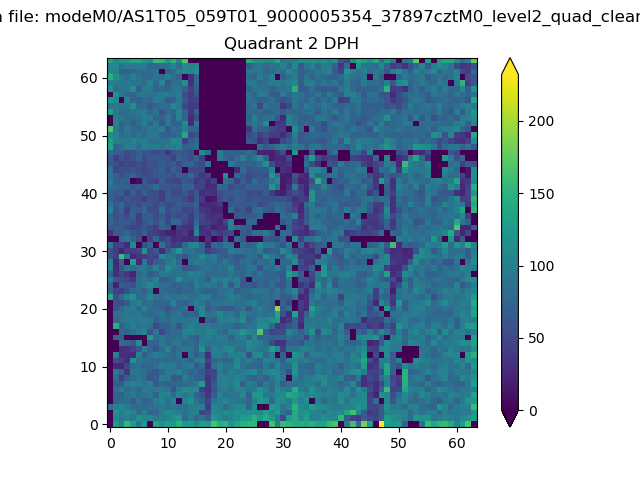 |
Quadrant C |
| Plot type | Count rate plots | Images |
|---|---|---|
| Comparison with Poisson distribution Blue bars denote a histogram of data divided into 1 sec bins. Red curve is a Poisson curve with rate = median count rate of data. |
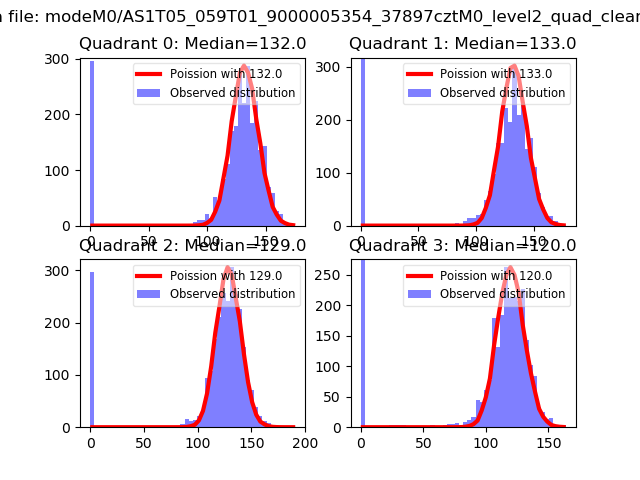 |
 |
| Quadrant-wise count rates Data is divided into 100 sec bins |
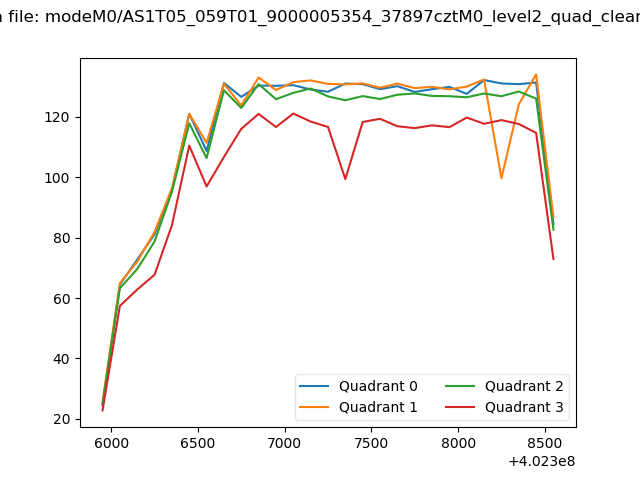 |
|
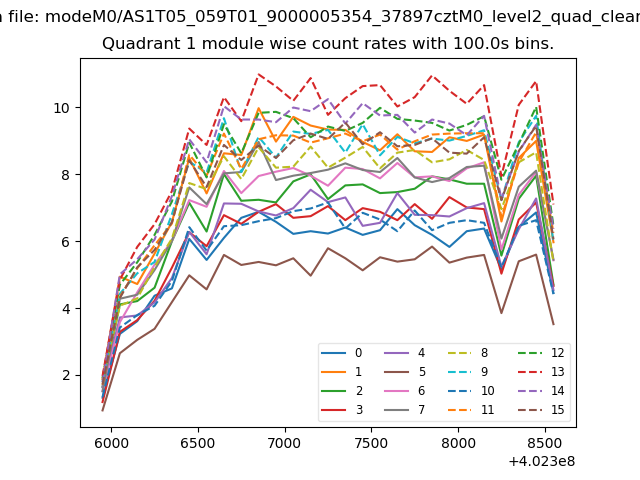
| Module-wise count rates for Quadrant A Data is divided into 100 sec bins |
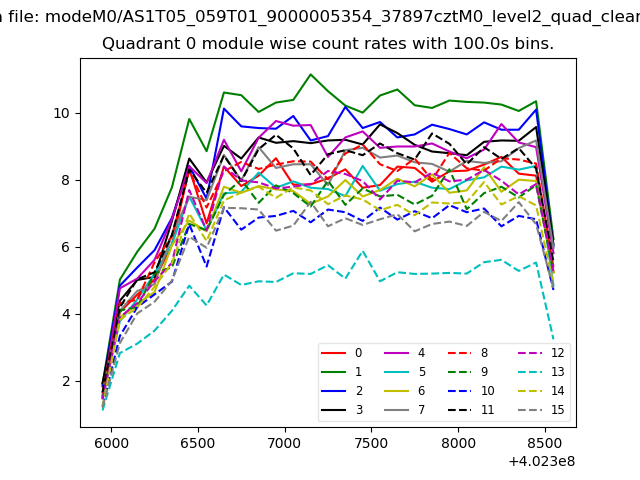 |
 |
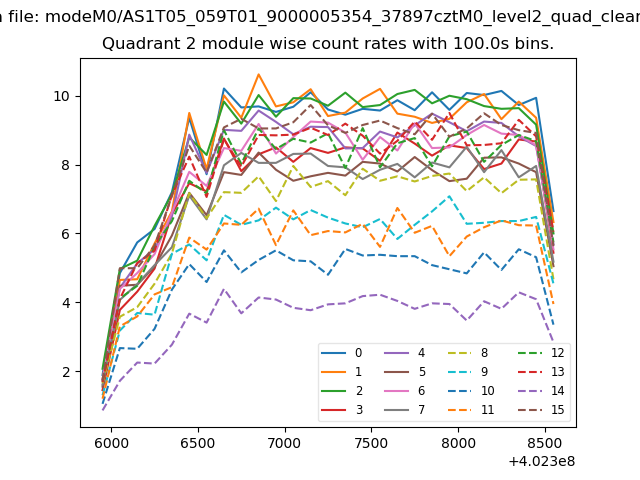
| Module-wise count rates for Quadrant B Data is divided into 100 sec bins |
 |
 |
| Module-wise count rates for Quadrant C Data is divided into 100 sec bins |
 |
 |
| Module-wise count rates for Quadrant D Data is divided into 100 sec bins |
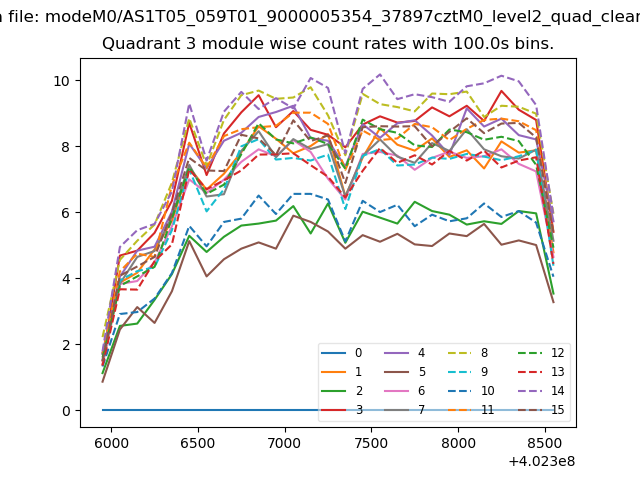 |
 |
| Parameter | Plot |
|---|---|
| CZT HV Monitor | 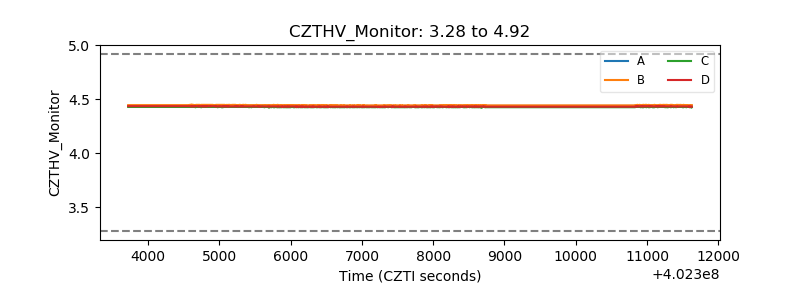 |
| D_VDD | 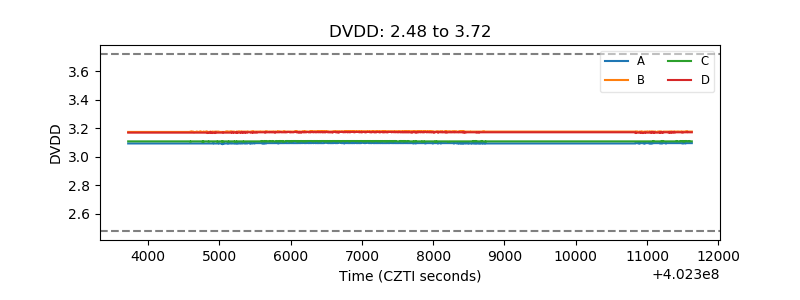 |
| Temperature 1 | 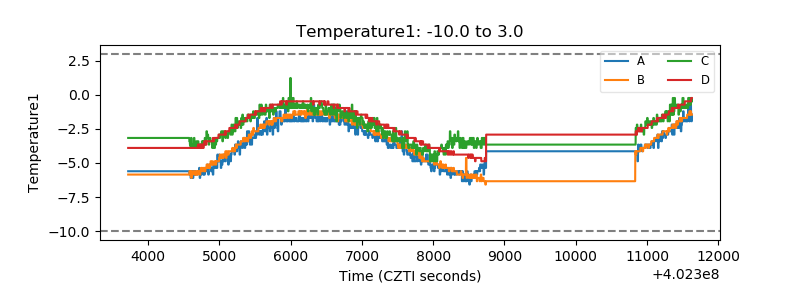 |
| Veto HV Monitor | 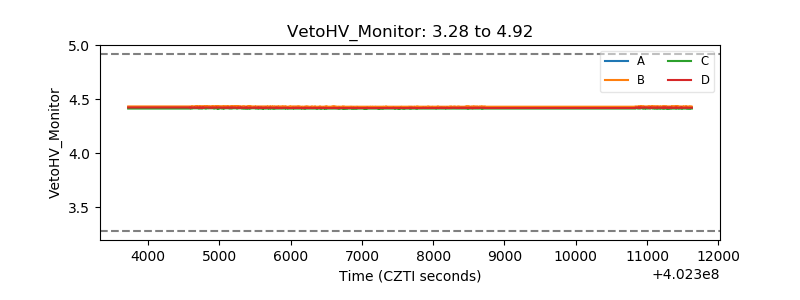 |
| Veto LLD | 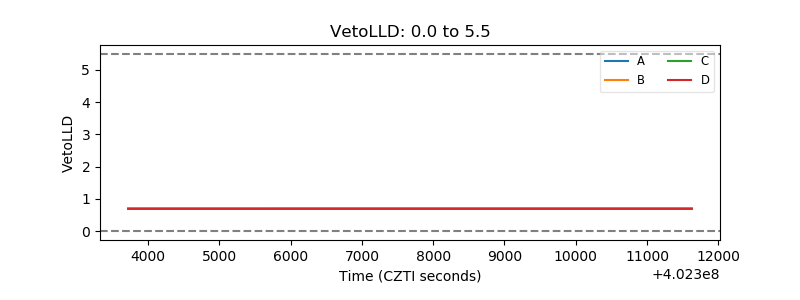 |
| Alpha Counter | 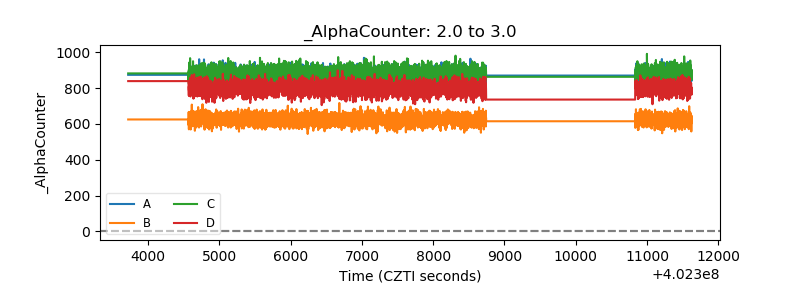 |
| _CPM_Rate | 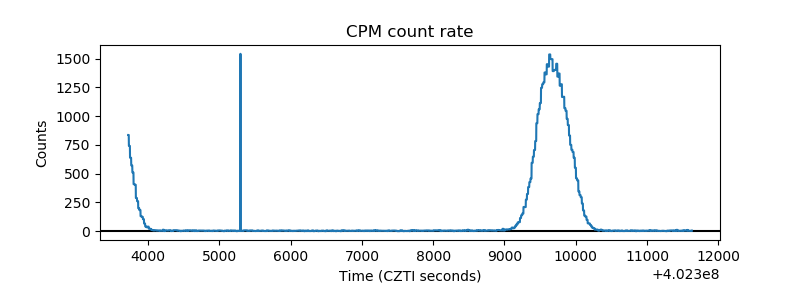 |
| CZT Counter | 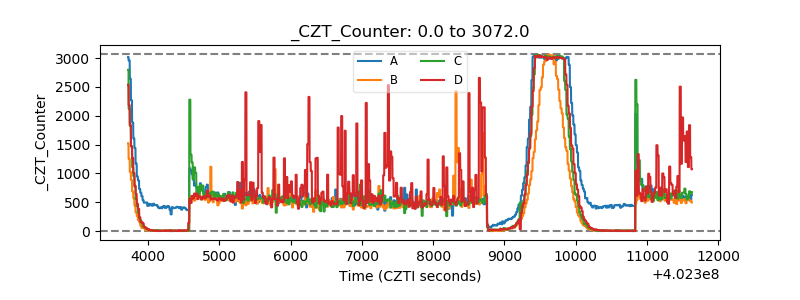 |
| +2.5 Volts monitor |  |
| +5 Volts monitor | 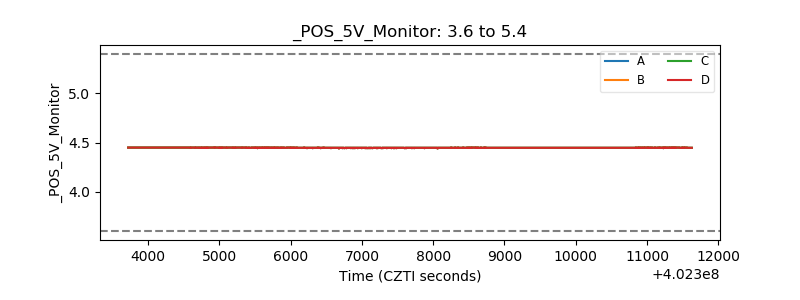 |
| _ROLL_ROT | 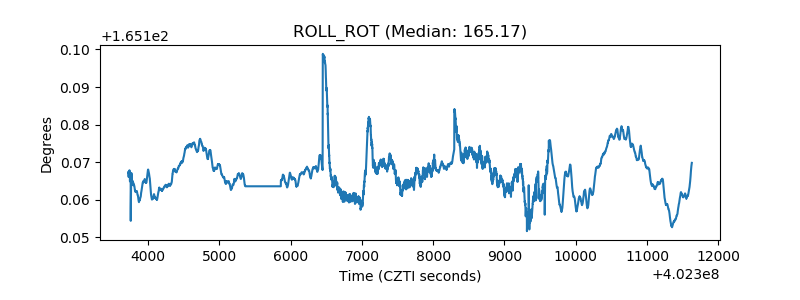 |
| _Roll_DEC | 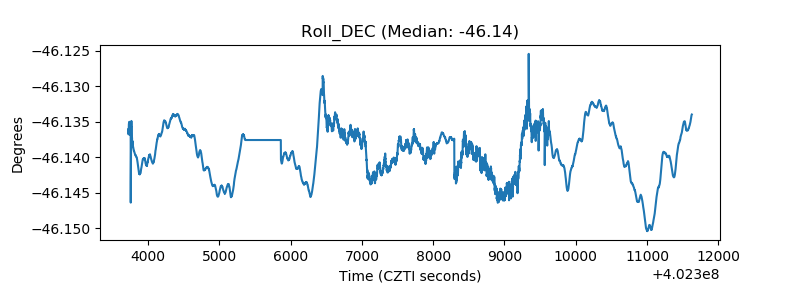 |
| _Roll_RA | 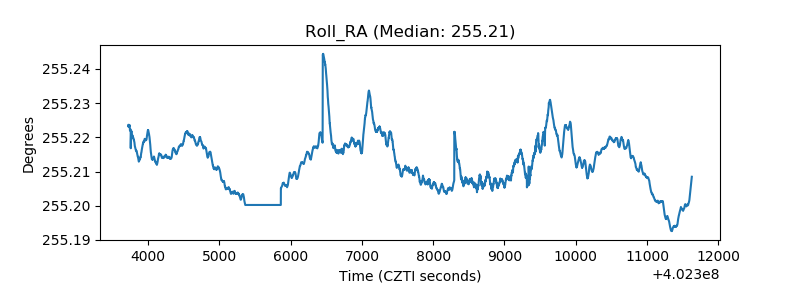 |
| Veto Counter |  |