| Param | Original file | Final file |
|---|---|---|
| Filename | modeM0/AS1T05_059T01_9000005354_37898cztM0_level2.evt | modeM0/AS1T05_059T01_9000005354_37898cztM0_level2_quad_clean.evt |
| Size (bytes) | 477,014,400 | 99,322,560 |
| Size | 454.9 MB | 94.7 MB |
| Events in quadrant A | 3,053,072 | 684,193 |
| Events in quadrant B | 3,247,082 | 678,194 |
| Events in quadrant C | 3,071,585 | 678,017 |
| Events in quadrant D | 4,717,273 | 598,521 |
| Mode M0 | |||
|---|---|---|---|
| Quadrant | BADHDUFLAG | Total packets | Discarded packets |
| A | 0 | 12245 | 3 |
| B | 0 | 12800 | 2 |
| C | 0 | 12353 | 2 |
| D | 0 | 17582 | 2 |
| Mode SS | |||
|---|---|---|---|
| Quadrant | BADHDUFLAG | Total packets | Discarded packets |
| A | 0 | 108 | 0 |
| B | 0 | 108 | 0 |
| C | 0 | 108 | 0 |
| D | 0 | 108 | 0 |
| Mode M9 | |||
|---|---|---|---|
| Quadrant | BADHDUFLAG | Total packets | Discarded packets |
| A | 0 | 32 | 0 |
| B | 0 | 32 | 0 |
| C | 0 | 32 | 0 |
| D | 0 | 33 | 0 |
| Quadrant | Total seconds | Saturated seconds | Saturation percentage |
|---|---|---|---|
| A | 5265 | 21 | 0.398860% |
| B | 5265 | 158 | 3.000950% |
| C | 5265 | 71 | 1.348528% |
| D | 5265 | 639 | 12.136752% |
Noise dominated data is calculated using 1-second bins in cleaned event files. If a bin has >2000 counts, and if more than 50% of those come from <1% of pixels, then it is considered to be noise-dominated and hence unusable.
| Quadrant | # 1 sec bins | Bins with >0 counts | Bins with >2000 counts | High rate bins dominated by noise | Noise dominated (total time) | Noise dominated (detector-on time) | Marked lightcurve |
|---|---|---|---|---|---|---|---|
| A | 7387 | 5266 | 10 | 10 | 0.14% | 0.19% | 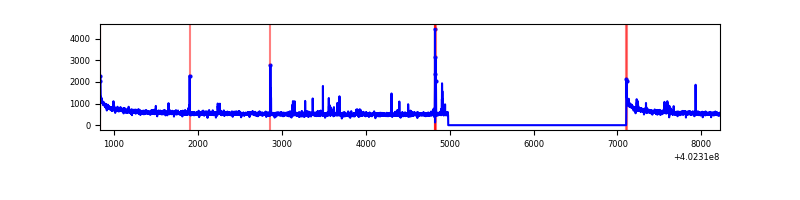 |
| B | 7387 | 5266 | 110 | 110 | 1.49% | 2.09% | 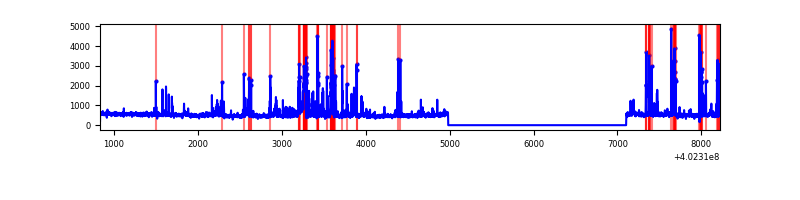 |
| C | 7387 | 5266 | 51 | 51 | 0.69% | 0.97% | 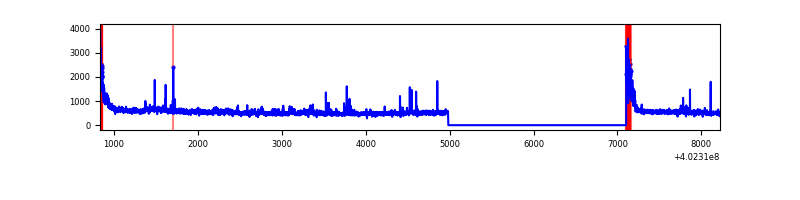 |
| D | 7387 | 5266 | 507 | 507 | 6.86% | 9.63% | 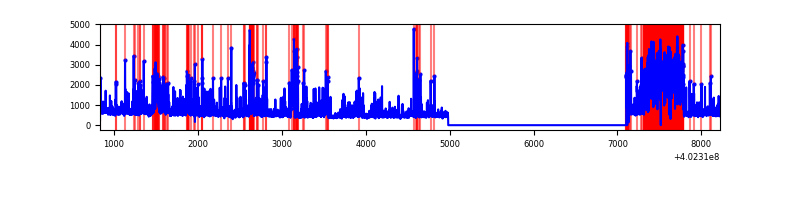 |
Top three noisy pixels from each quadrant. If the there are fewer than three noisy pixels in the level2.evt file, extra rows are filled as -1
| Pixel properties | Quadrant properties | ||||||
|---|---|---|---|---|---|---|---|
| Quadrant | DetID | PixID | Counts | Sigma | Mean | Median | Sigma |
| A | 10 | 83 | 377576 | 2888.66 | 648 | 637 | 130.5 |
| A | 7 | 3 | 43003 | 324.67 | 648 | 637 | 130.5 |
| A | 12 | 16 | 36399 | 274.06 | 648 | 637 | 130.5 |
| B | 5 | 172 | 442007 | 3744.21 | 630 | 616 | 117.9 |
| B | 4 | 171 | 153946 | 1300.66 | 630 | 616 | 117.9 |
| B | 0 | 229 | 74343 | 625.41 | 630 | 616 | 117.9 |
| C | 0 | 10 | 275127 | 1933.31 | 616 | 621 | 142.0 |
| C | 15 | 214 | 225694 | 1585.16 | 616 | 621 | 142.0 |
| C | 14 | 67 | 91547 | 640.38 | 616 | 621 | 142.0 |
| D | 2 | 249 | 1234635 | 8661.24 | 585 | 572 | 142.5 |
| D | 1 | 52 | 375222 | 2629.47 | 585 | 572 | 142.5 |
| D | 10 | 199 | 204386 | 1430.46 | 585 | 572 | 142.5 |
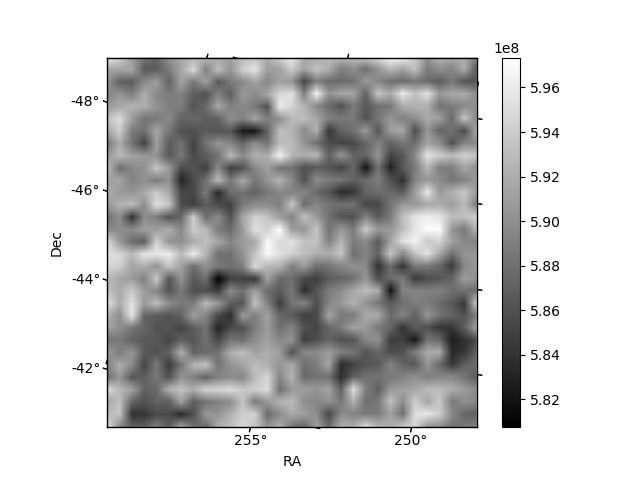
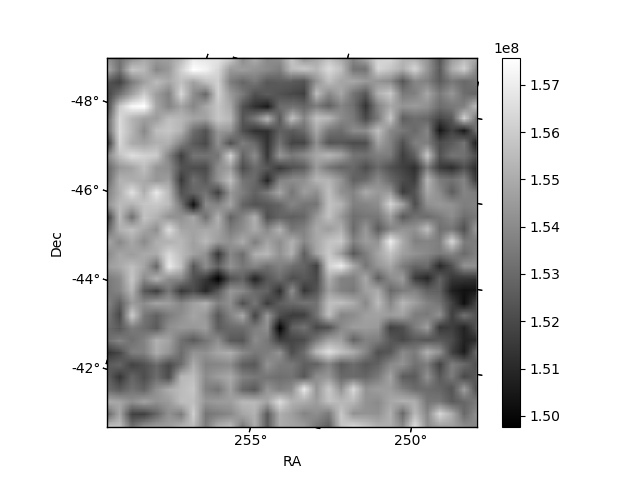
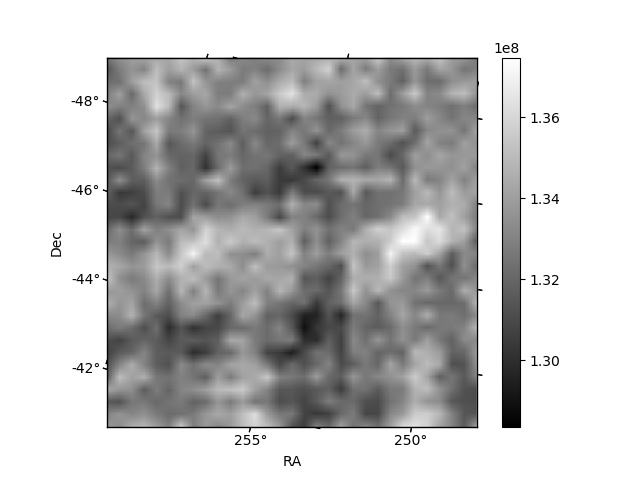
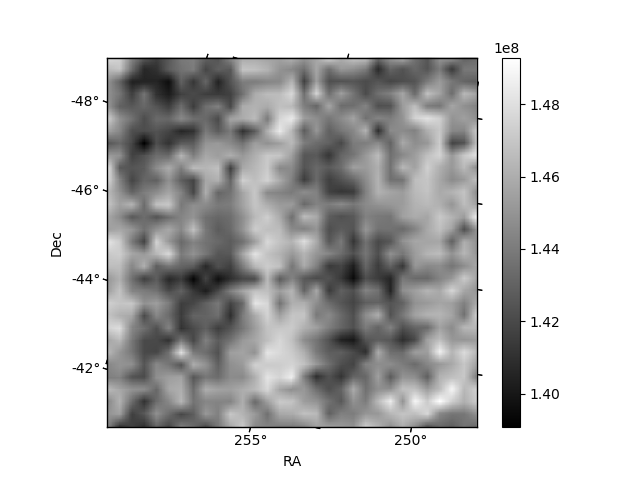
Histogram calculated using DETX and DETY for each event in the final _common_clean file
| Quadrant A | 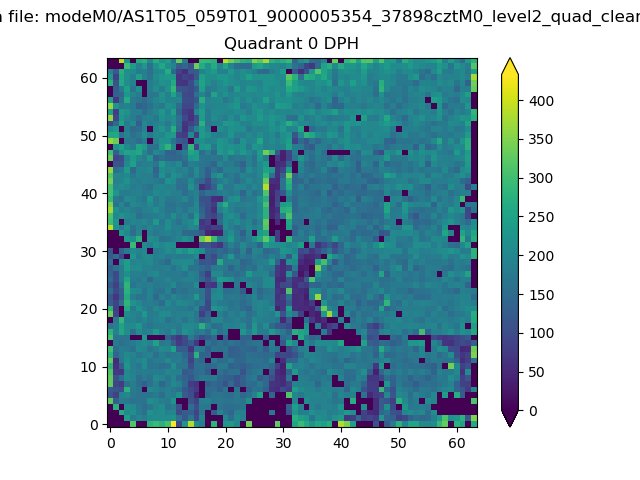 |
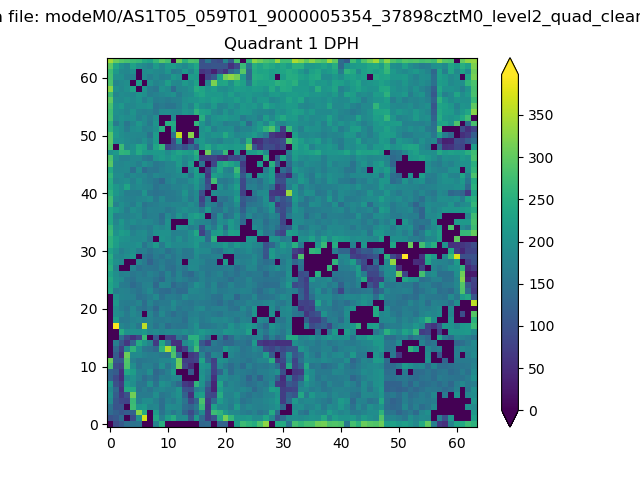 |
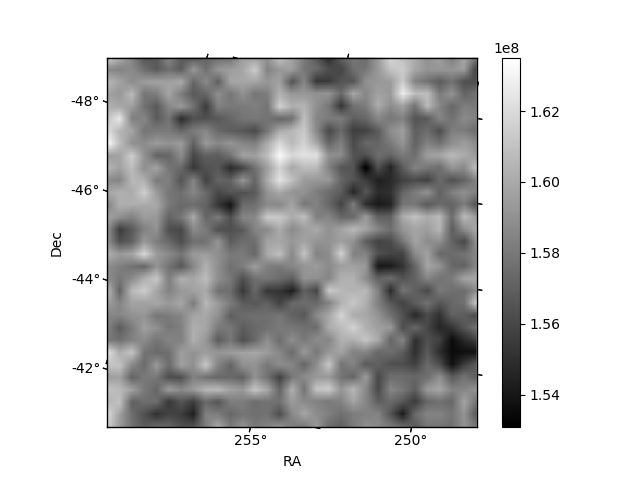
Quadrant B |
|---|---|---|---|
| Quadrant D | 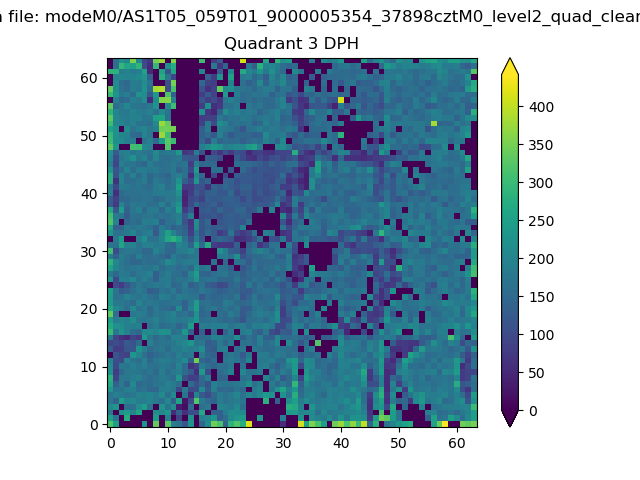 |
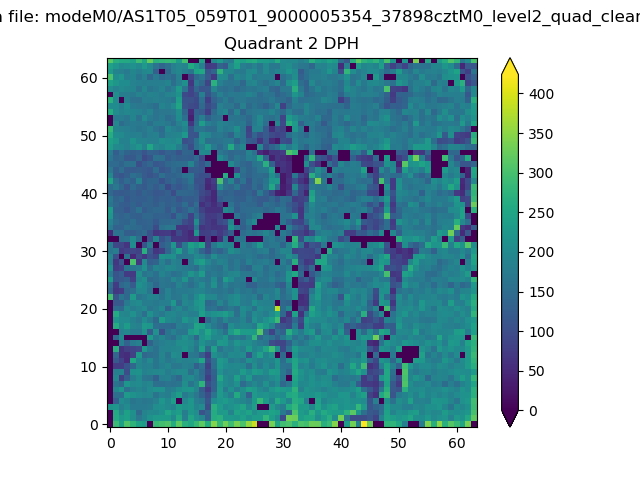 |
Quadrant C |
| Plot type | Count rate plots | Images |
|---|---|---|
| Comparison with Poisson distribution Blue bars denote a histogram of data divided into 1 sec bins. Red curve is a Poisson curve with rate = median count rate of data. |
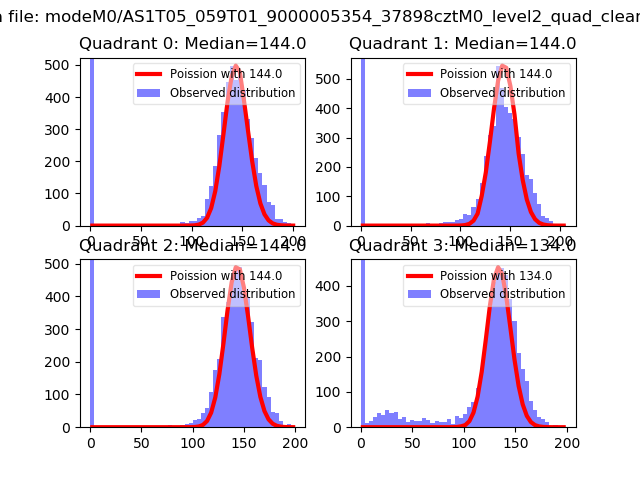 |
 |
| Quadrant-wise count rates Data is divided into 100 sec bins |
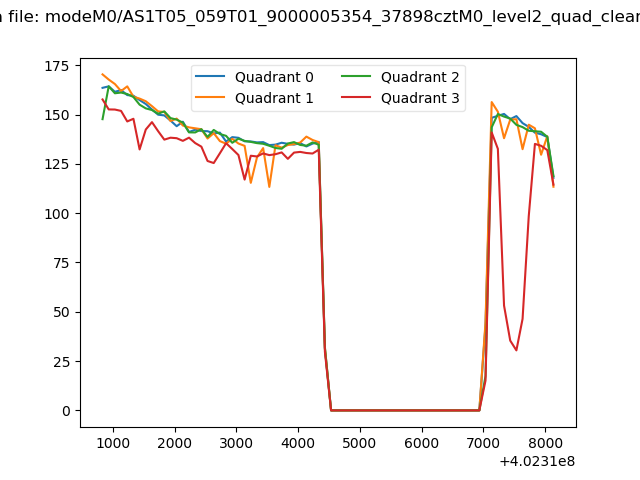 |
|
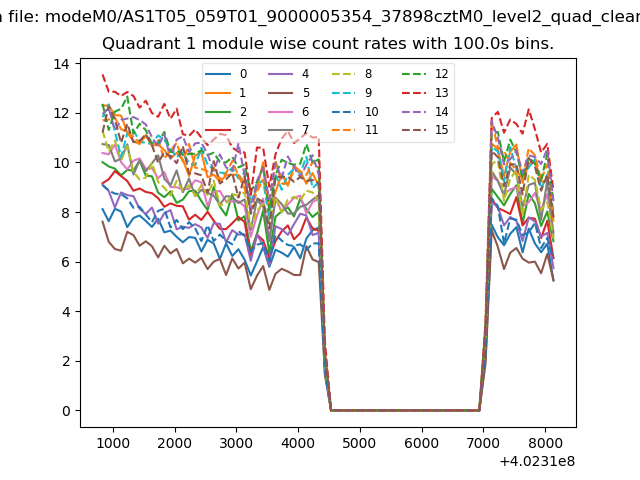
| Module-wise count rates for Quadrant A Data is divided into 100 sec bins |
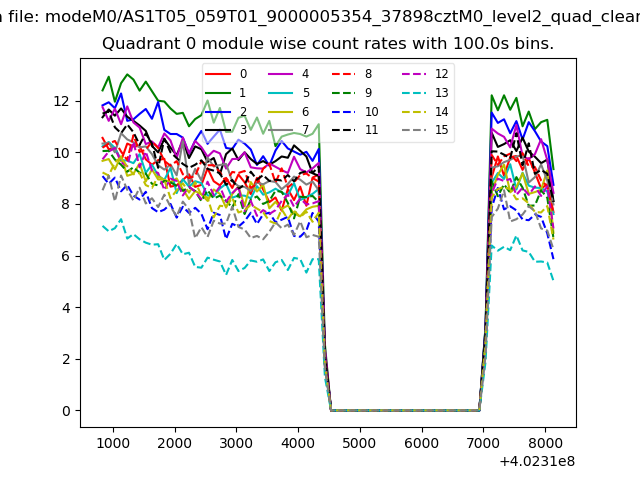 |
 |
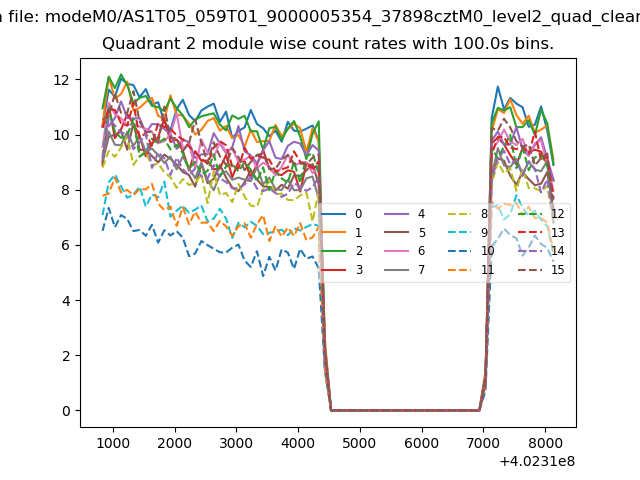
| Module-wise count rates for Quadrant B Data is divided into 100 sec bins |
 |
 |
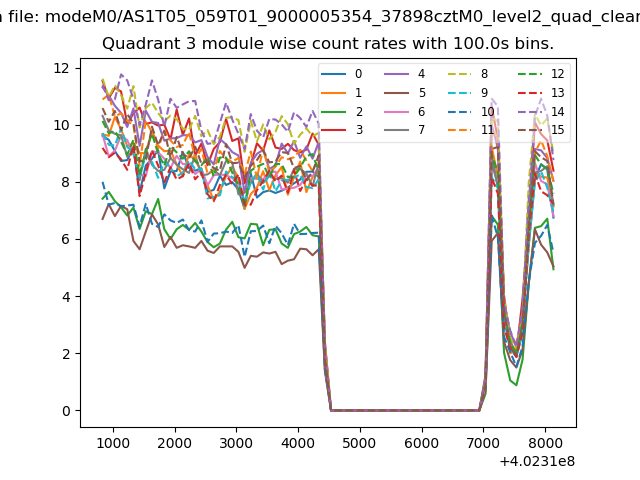
| Module-wise count rates for Quadrant C Data is divided into 100 sec bins |
 |
 |
| Module-wise count rates for Quadrant D Data is divided into 100 sec bins |
 |
 |
| Parameter | Plot |
|---|---|
| CZT HV Monitor |  |
| D_VDD | 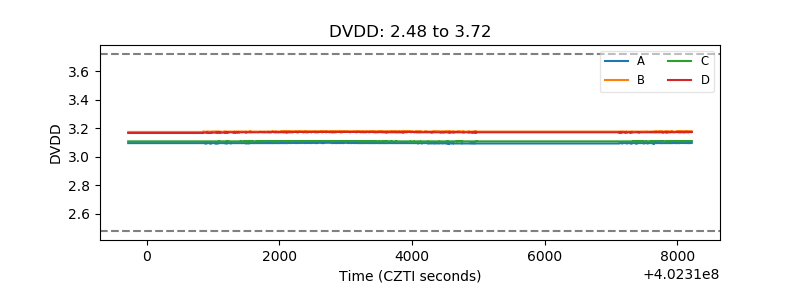 |
| Temperature 1 | 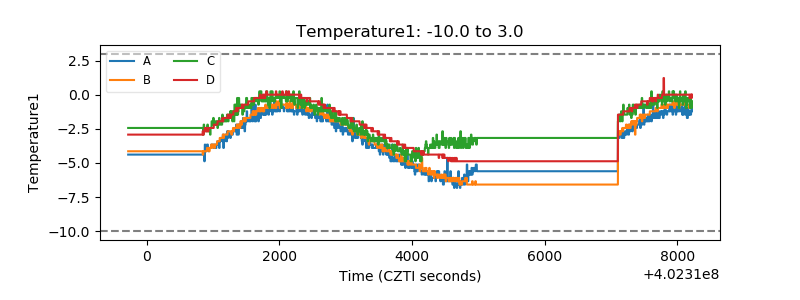 |
| Veto HV Monitor | 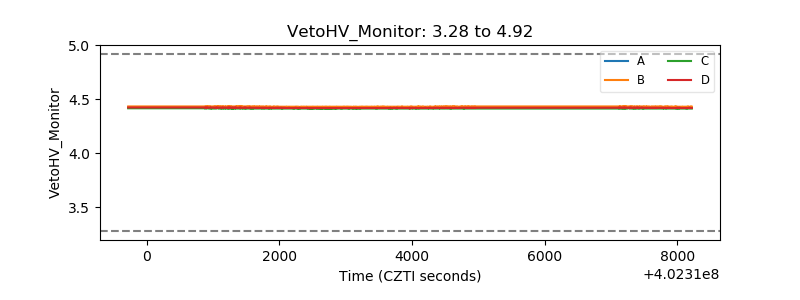 |
| Veto LLD | 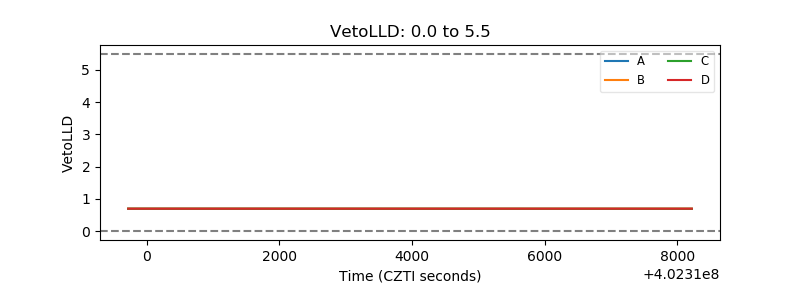 |
| Alpha Counter | 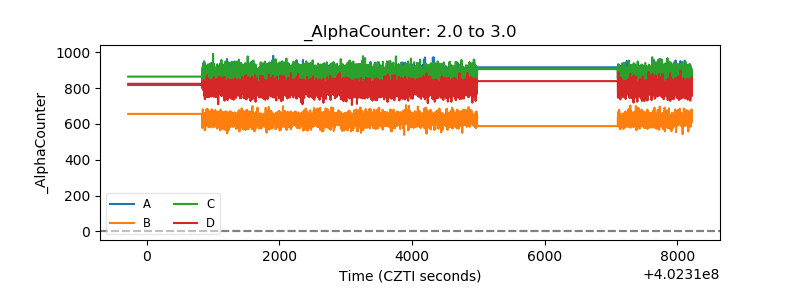 |
| _CPM_Rate | 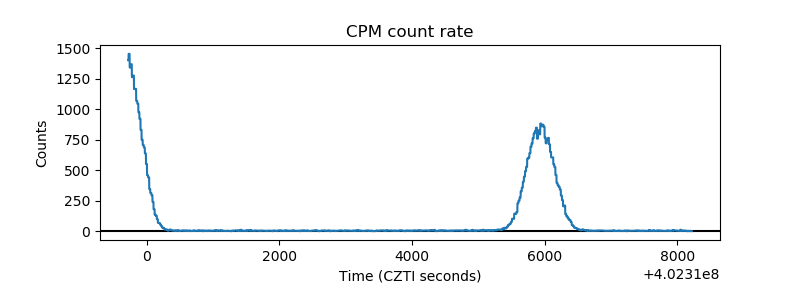 |
| CZT Counter | 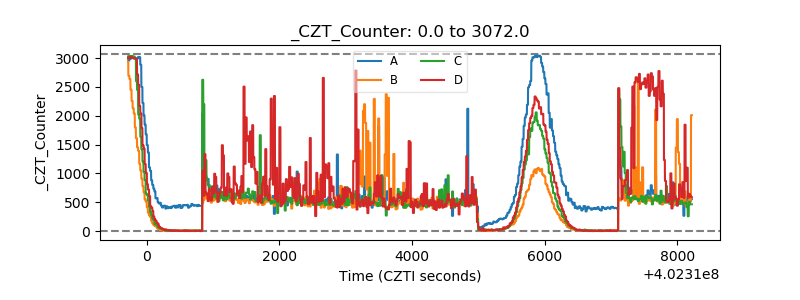 |
| +2.5 Volts monitor | 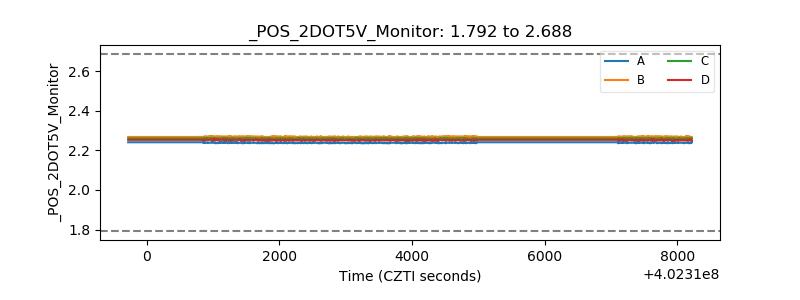 |
| +5 Volts monitor | 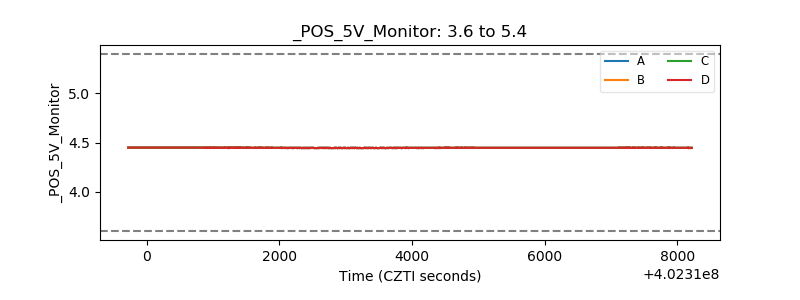 |
| _ROLL_ROT | 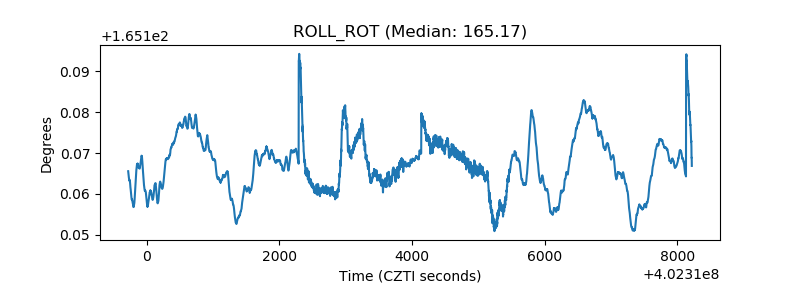 |
| _Roll_DEC | 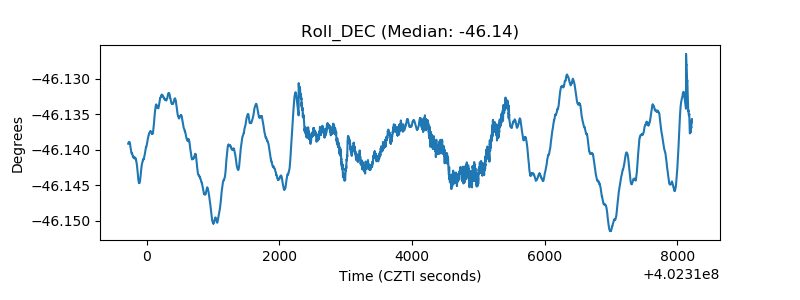 |
| _Roll_RA | 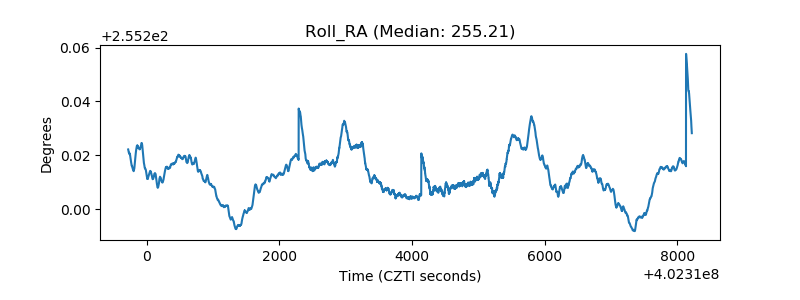 |
| Veto Counter | 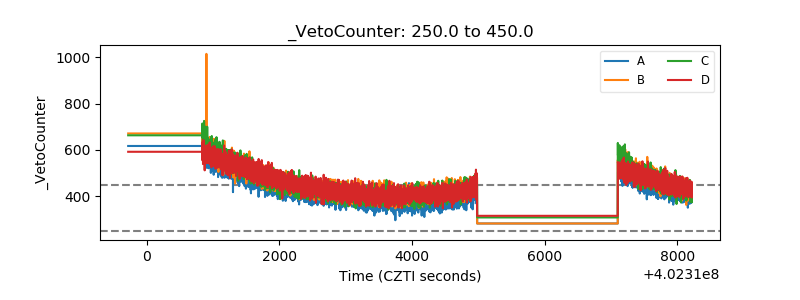 |