| Param | Original file | Final file |
|---|---|---|
| Filename | modeM0/AS1T05_059T01_9000005354_37899cztM0_level2.evt | modeM0/AS1T05_059T01_9000005354_37899cztM0_level2_quad_clean.evt |
| Size (bytes) | 455,304,960 | 81,103,680 |
| Size | 434.2 MB | 77.3 MB |
| Events in quadrant A | 2,832,771 | 548,217 |
| Events in quadrant B | 3,052,030 | 541,495 |
| Events in quadrant C | 2,848,757 | 543,172 |
| Events in quadrant D | 4,711,972 | 468,397 |
| Mode M0 | |||
|---|---|---|---|
| Quadrant | BADHDUFLAG | Total packets | Discarded packets |
| A | 0 | 11459 | 2 |
| B | 0 | 12268 | 1 |
| C | 0 | 11474 | 1 |
| D | 0 | 17390 | 1 |
| Mode SS | |||
|---|---|---|---|
| Quadrant | BADHDUFLAG | Total packets | Discarded packets |
| A | 0 | 104 | 0 |
| B | 0 | 104 | 0 |
| C | 0 | 104 | 0 |
| D | 0 | 104 | 0 |
| Mode M9 | |||
|---|---|---|---|
| Quadrant | BADHDUFLAG | Total packets | Discarded packets |
| A | 0 | 21 | 0 |
| B | 0 | 21 | 0 |
| C | 0 | 21 | 0 |
| D | 0 | 21 | 0 |
| Quadrant | Total seconds | Saturated seconds | Saturation percentage |
|---|---|---|---|
| A | 5053 | 10 | 0.197902% |
| B | 5053 | 154 | 3.047694% |
| C | 5053 | 99 | 1.959232% |
| D | 5053 | 715 | 14.150010% |
Noise dominated data is calculated using 1-second bins in cleaned event files. If a bin has >2000 counts, and if more than 50% of those come from <1% of pixels, then it is considered to be noise-dominated and hence unusable.
| Quadrant | # 1 sec bins | Bins with >0 counts | Bins with >2000 counts | High rate bins dominated by noise | Noise dominated (total time) | Noise dominated (detector-on time) | Marked lightcurve |
|---|---|---|---|---|---|---|---|
| A | 7146 | 5054 | 3 | 3 | 0.04% | 0.06% | 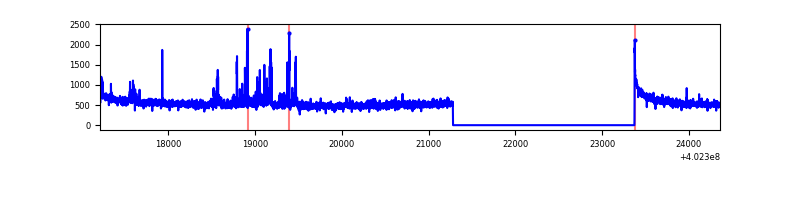 |
| B | 7146 | 5054 | 106 | 106 | 1.48% | 2.10% | 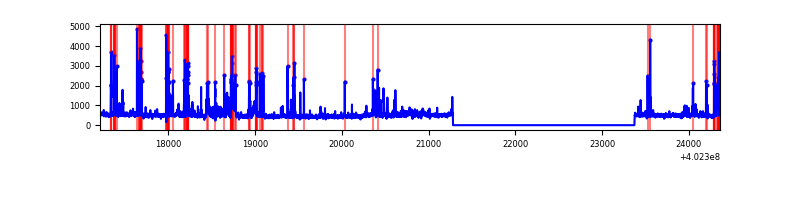 |
| C | 7146 | 5054 | 95 | 95 | 1.33% | 1.88% | 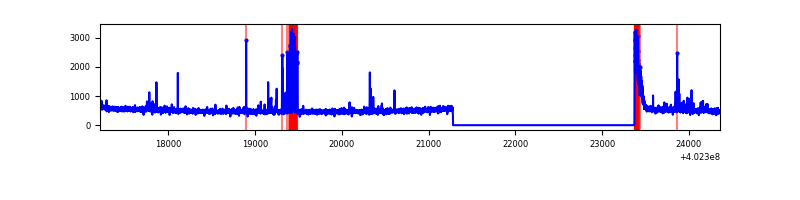 |
| D | 7146 | 5054 | 568 | 568 | 7.95% | 11.24% | 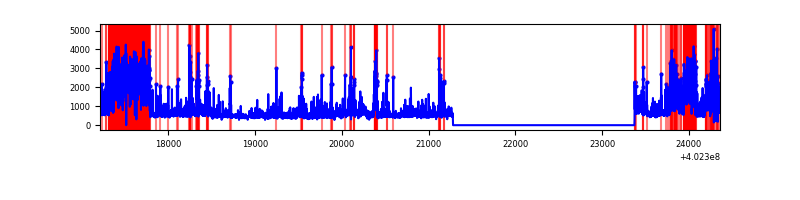 |
Top three noisy pixels from each quadrant. If the there are fewer than three noisy pixels in the level2.evt file, extra rows are filled as -1
| Pixel properties | Quadrant properties | ||||||
|---|---|---|---|---|---|---|---|
| Quadrant | DetID | PixID | Counts | Sigma | Mean | Median | Sigma |
| A | 10 | 83 | 328269 | 2767.47 | 590 | 580 | 118.4 |
| A | 12 | 16 | 94584 | 793.9 | 590 | 580 | 118.4 |
| A | 15 | 222 | 62972 | 526.93 | 590 | 580 | 118.4 |
| B | 5 | 172 | 490458 | 4487.99 | 575 | 562 | 109.2 |
| B | 0 | 189 | 67361 | 611.95 | 575 | 562 | 109.2 |
| B | 0 | 213 | 60344 | 547.67 | 575 | 562 | 109.2 |
| C | 15 | 214 | 214003 | 1656.07 | 559 | 563 | 128.9 |
| C | 0 | 10 | 193575 | 1497.57 | 559 | 563 | 128.9 |
| C | 12 | 175 | 186646 | 1443.8 | 559 | 563 | 128.9 |
| D | 2 | 249 | 1383242 | 10826.05 | 521 | 507 | 127.7 |
| D | 1 | 52 | 613083 | 4796.13 | 521 | 507 | 127.7 |
| D | 9 | 49 | 137991 | 1076.42 | 521 | 507 | 127.7 |
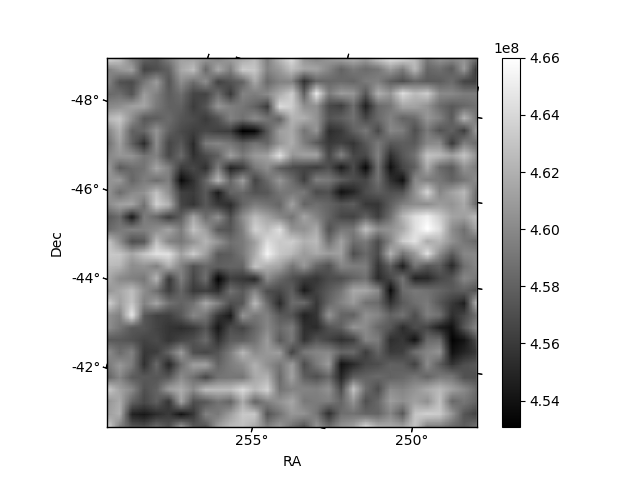
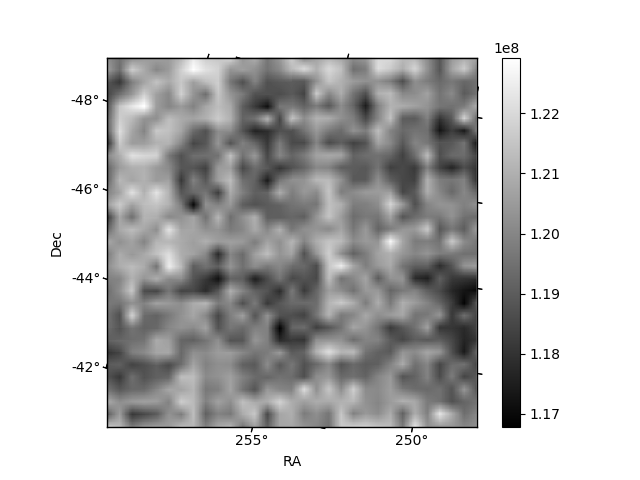
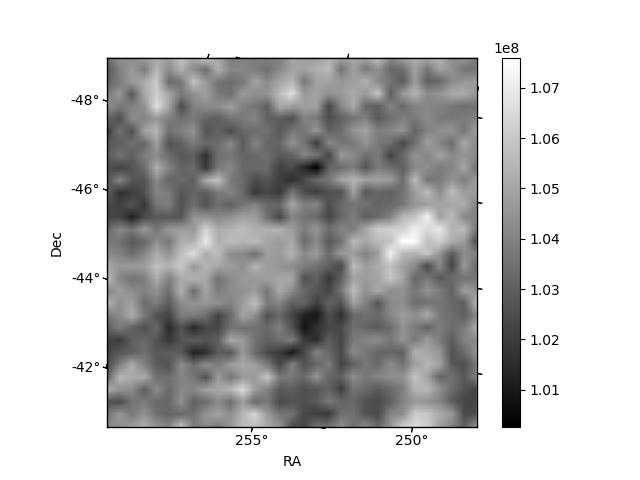
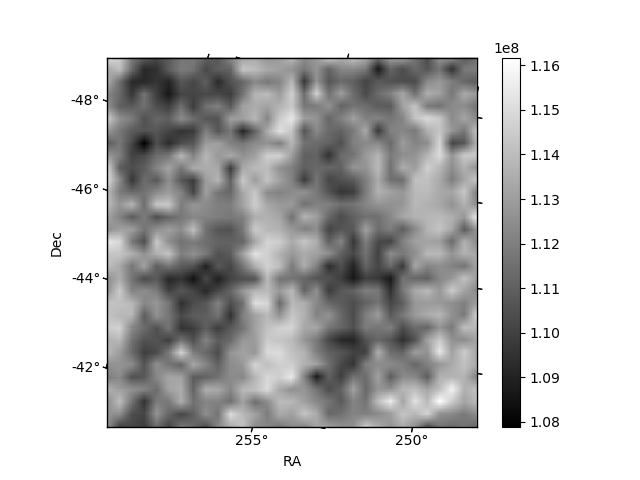
Histogram calculated using DETX and DETY for each event in the final _common_clean file
| Quadrant A | 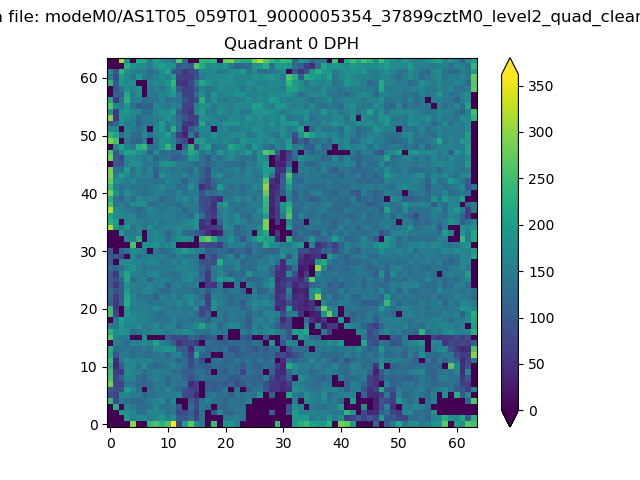 |
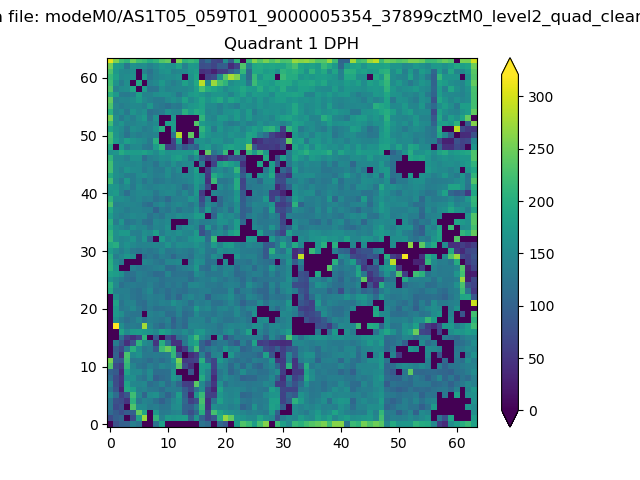 |
Quadrant B |
|---|---|---|---|
| Quadrant D | 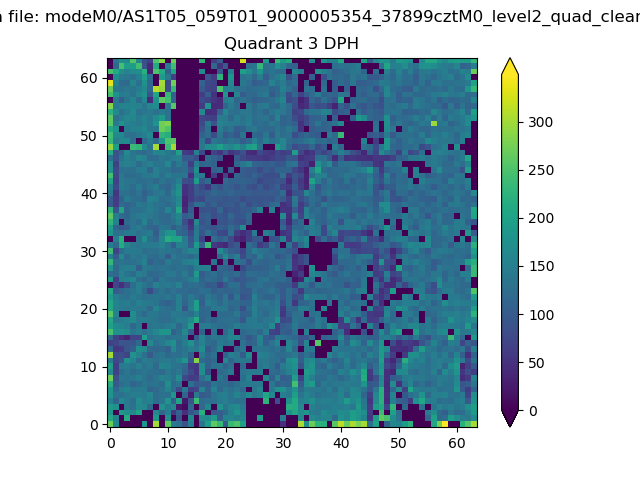 |
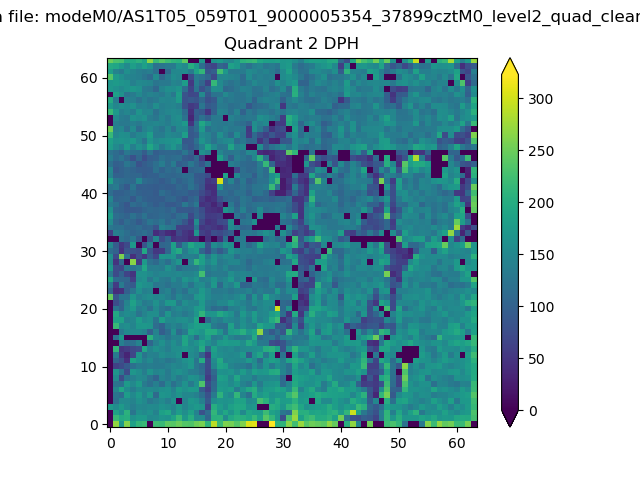 |
Quadrant C |
| Plot type | Count rate plots | Images |
|---|---|---|
| Comparison with Poisson distribution Blue bars denote a histogram of data divided into 1 sec bins. Red curve is a Poisson curve with rate = median count rate of data. |
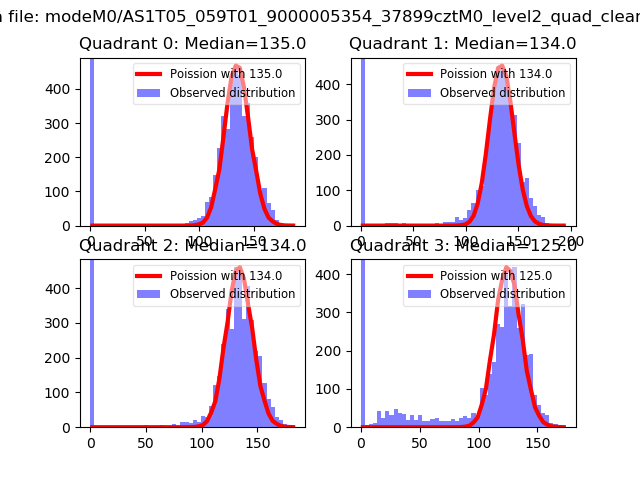 |
 |
| Quadrant-wise count rates Data is divided into 100 sec bins |
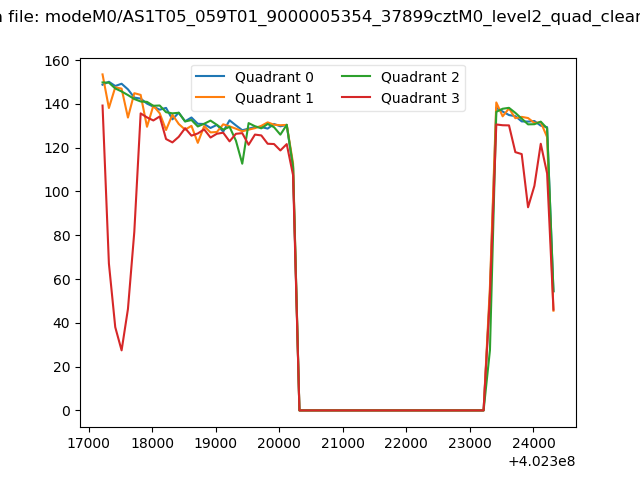 |
|
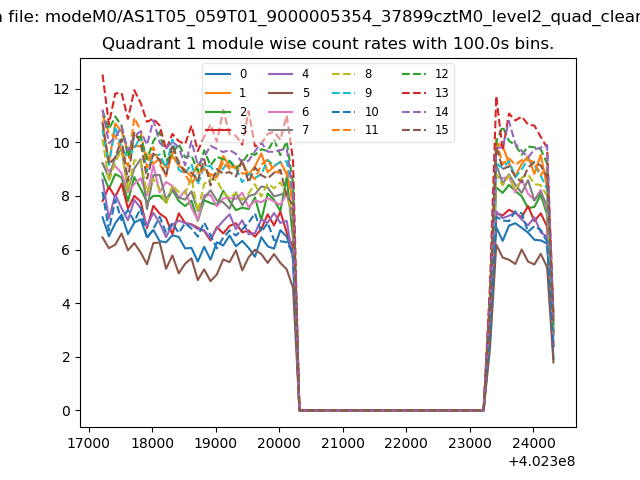
| Module-wise count rates for Quadrant A Data is divided into 100 sec bins |
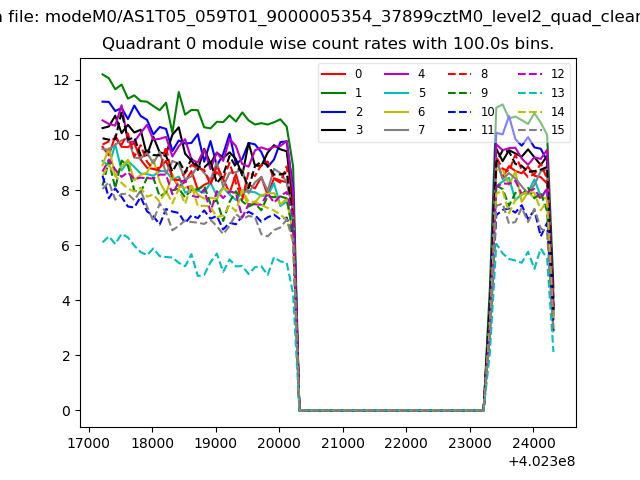 |
 |
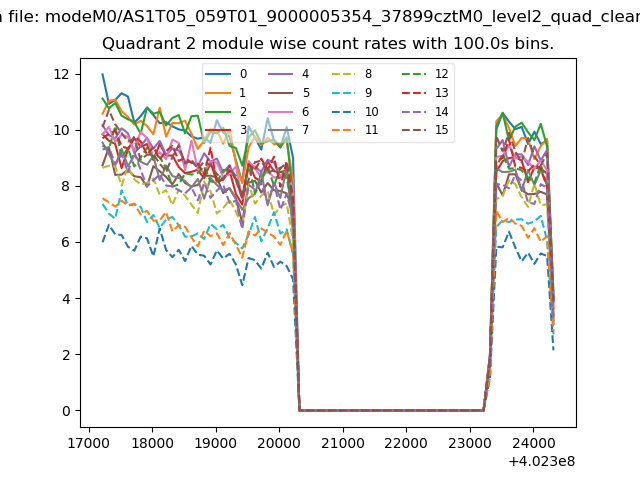
| Module-wise count rates for Quadrant B Data is divided into 100 sec bins |
 |
 |
| Module-wise count rates for Quadrant C Data is divided into 100 sec bins |
 |
 |
| Module-wise count rates for Quadrant D Data is divided into 100 sec bins |
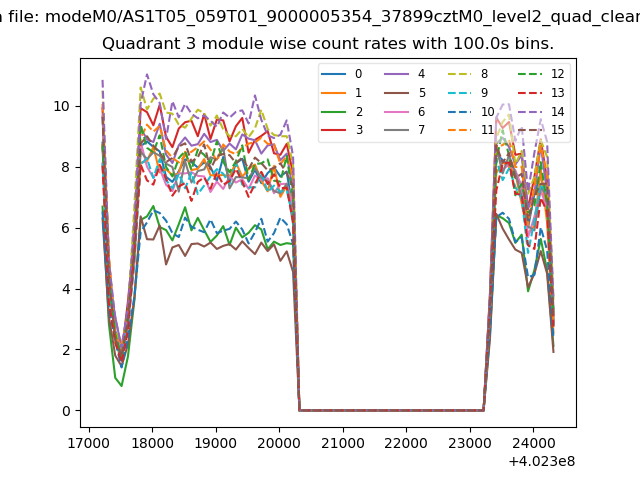 |
 |
| Parameter | Plot |
|---|---|
| CZT HV Monitor | 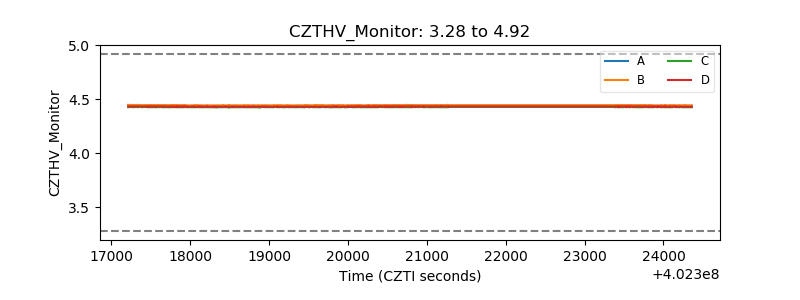 |
| D_VDD | 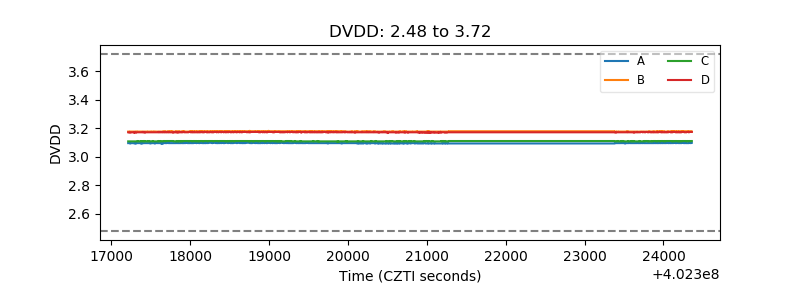 |
| Temperature 1 | 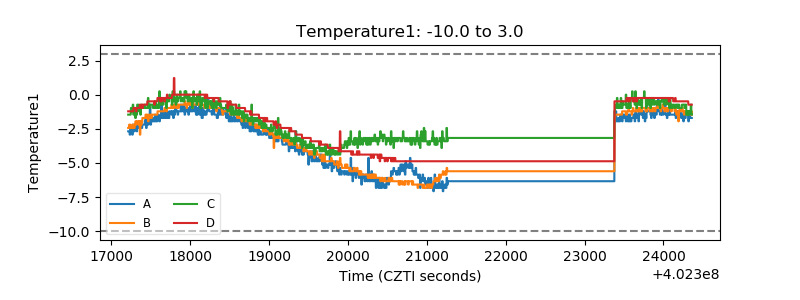 |
| Veto HV Monitor | 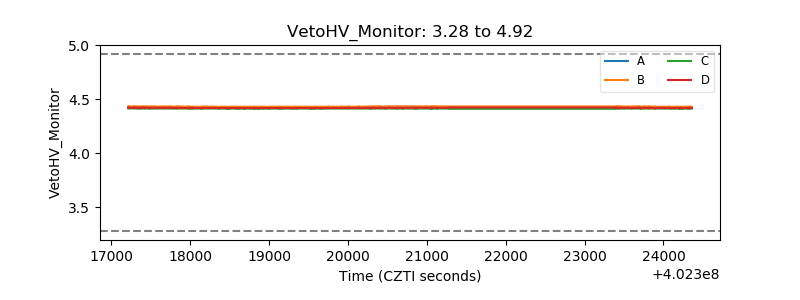 |
| Veto LLD | 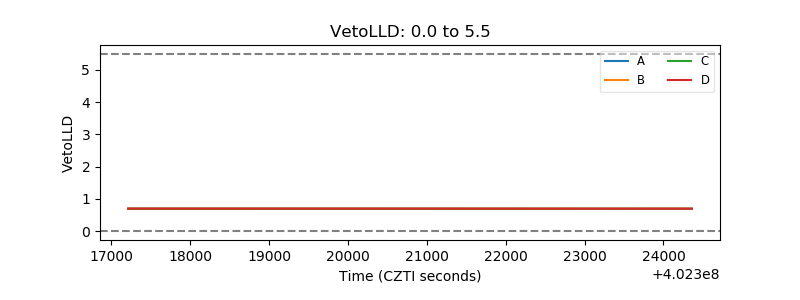 |
| Alpha Counter | 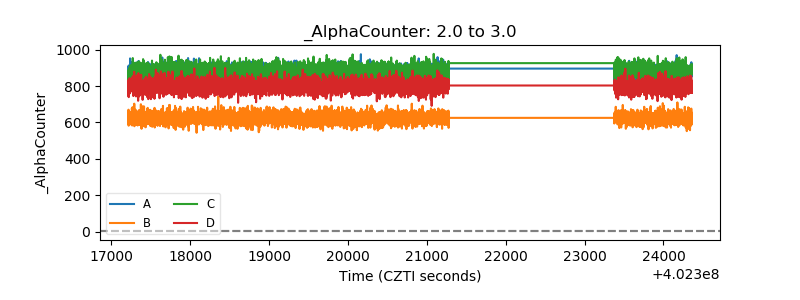 |
| _CPM_Rate | 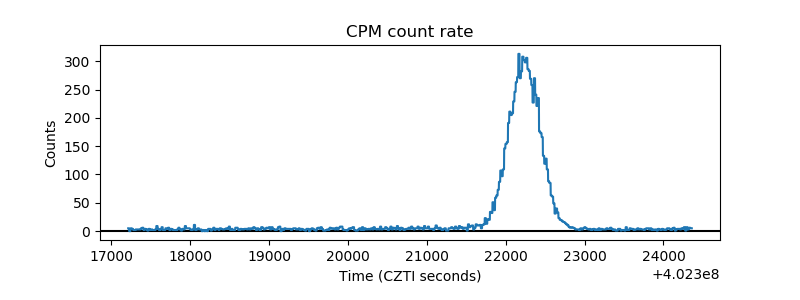 |
| CZT Counter | 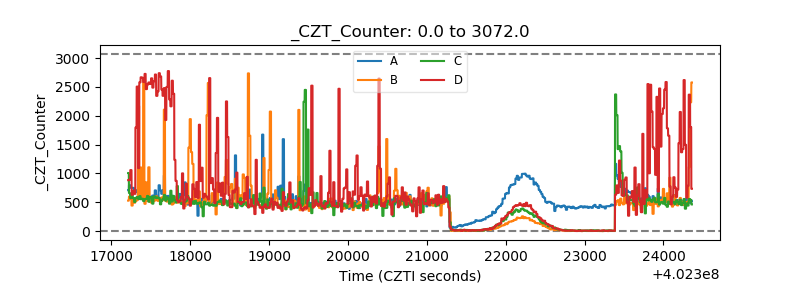 |
| +2.5 Volts monitor | 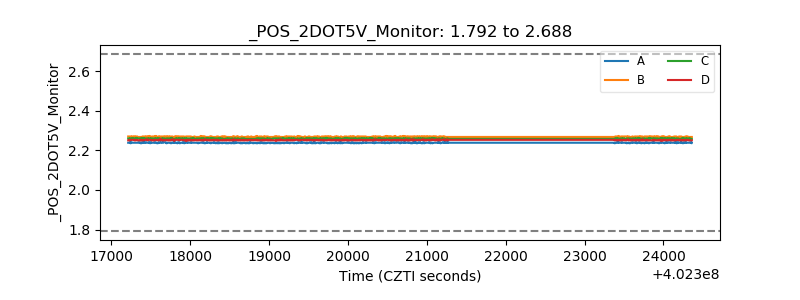 |
| +5 Volts monitor |  |
| _ROLL_ROT | 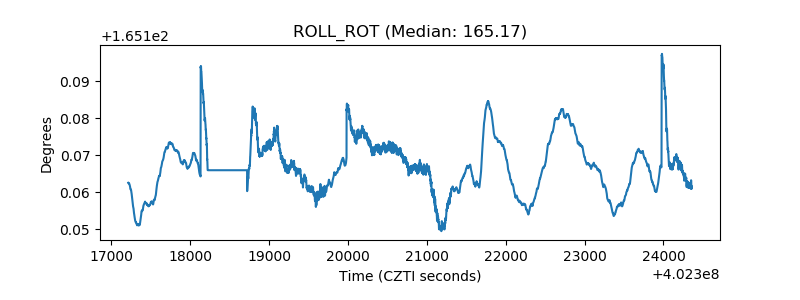 |
| _Roll_DEC | 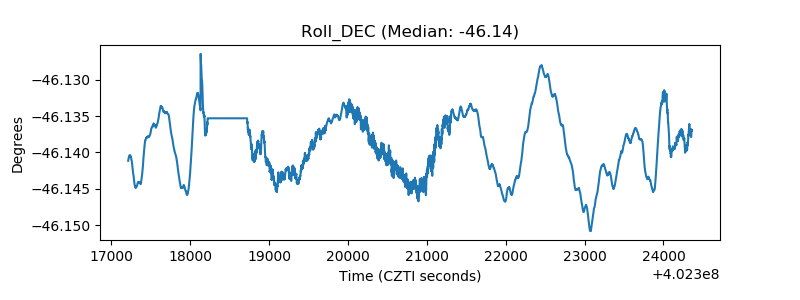 |
| _Roll_RA | 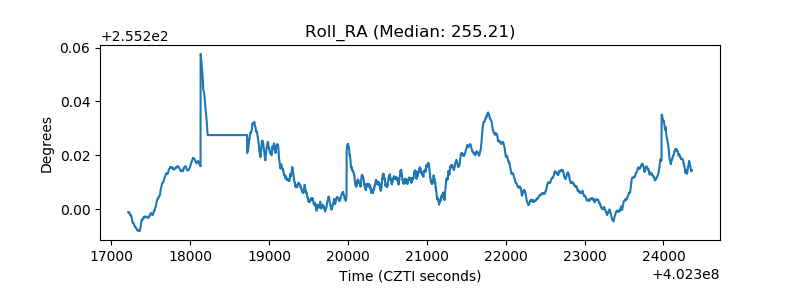 |
| Veto Counter | 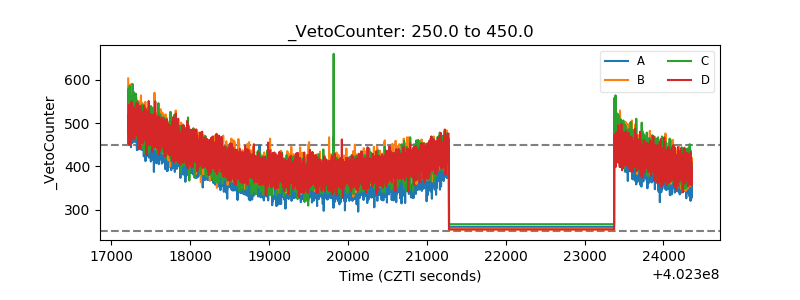 |