| Param | Original file | Final file |
|---|---|---|
| Filename | modeM0/AS1T05_059T01_9000005354_37900cztM0_level2.evt | modeM0/AS1T05_059T01_9000005354_37900cztM0_level2_quad_clean.evt |
| Size (bytes) | 461,448,000 | 73,808,640 |
| Size | 440.1 MB | 70.4 MB |
| Events in quadrant A | 2,821,227 | 478,201 |
| Events in quadrant B | 2,840,730 | 477,641 |
| Events in quadrant C | 2,908,498 | 475,323 |
| Events in quadrant D | 5,037,158 | 424,820 |
| Mode M0 | |||
|---|---|---|---|
| Quadrant | BADHDUFLAG | Total packets | Discarded packets |
| A | 0 | 11660 | 3 |
| B | 0 | 11982 | 2 |
| C | 0 | 12029 | 2 |
| D | 0 | 18705 | 2 |
| Mode SS | |||
|---|---|---|---|
| Quadrant | BADHDUFLAG | Total packets | Discarded packets |
| A | 0 | 110 | 0 |
| B | 0 | 110 | 0 |
| C | 0 | 110 | 0 |
| D | 0 | 110 | 0 |
| Mode M9 | |||
|---|---|---|---|
| Quadrant | BADHDUFLAG | Total packets | Discarded packets |
| A | 0 | 20 | 0 |
| B | 0 | 20 | 0 |
| C | 0 | 20 | 0 |
| D | 0 | 21 | 0 |
| Quadrant | Total seconds | Saturated seconds | Saturation percentage |
|---|---|---|---|
| A | 5411 | 13 | 0.240251% |
| B | 5411 | 70 | 1.293661% |
| C | 5411 | 81 | 1.496951% |
| D | 5411 | 593 | 10.959157% |
Noise dominated data is calculated using 1-second bins in cleaned event files. If a bin has >2000 counts, and if more than 50% of those come from <1% of pixels, then it is considered to be noise-dominated and hence unusable.
| Quadrant | # 1 sec bins | Bins with >0 counts | Bins with >2000 counts | High rate bins dominated by noise | Noise dominated (total time) | Noise dominated (detector-on time) | Marked lightcurve |
|---|---|---|---|---|---|---|---|
| A | 7263 | 5412 | 4 | 4 | 0.06% | 0.07% | 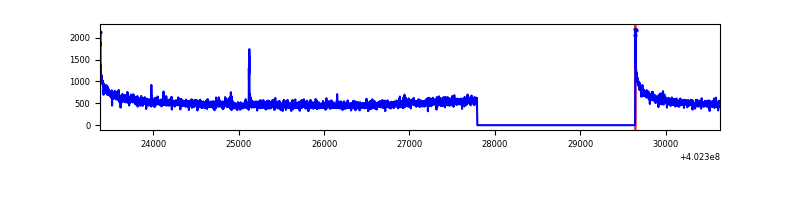 |
| B | 7263 | 5412 | 49 | 49 | 0.67% | 0.91% | 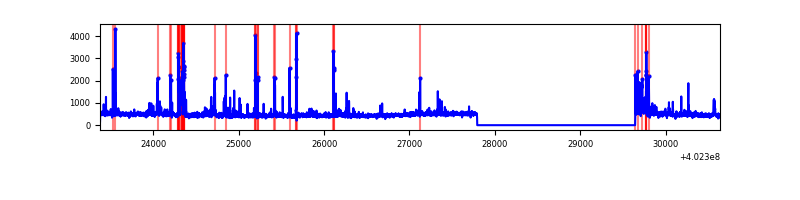 |
| C | 7263 | 5412 | 68 | 68 | 0.94% | 1.26% | 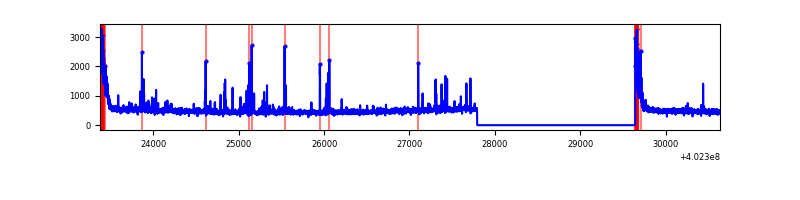 |
| D | 7263 | 5412 | 490 | 490 | 6.75% | 9.05% | 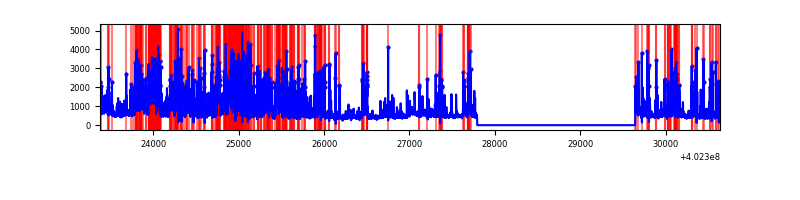 |
Top three noisy pixels from each quadrant. If the there are fewer than three noisy pixels in the level2.evt file, extra rows are filled as -1
| Pixel properties | Quadrant properties | ||||||
|---|---|---|---|---|---|---|---|
| Quadrant | DetID | PixID | Counts | Sigma | Mean | Median | Sigma |
| A | 10 | 83 | 383015 | 3093.24 | 609 | 598 | 123.6 |
| A | 13 | 6 | 22245 | 175.09 | 609 | 598 | 123.6 |
| A | 12 | 189 | 20990 | 164.94 | 609 | 598 | 123.6 |
| B | 5 | 172 | 318412 | 2762.6 | 603 | 587 | 115.0 |
| B | 4 | 171 | 35347 | 302.14 | 603 | 587 | 115.0 |
| B | 0 | 229 | 19186 | 161.67 | 603 | 587 | 115.0 |
| C | 0 | 10 | 273210 | 2012.33 | 581 | 585 | 135.5 |
| C | 15 | 214 | 228081 | 1679.22 | 581 | 585 | 135.5 |
| C | 14 | 254 | 128939 | 947.42 | 581 | 585 | 135.5 |
| D | 1 | 52 | 1012788 | 7330.5 | 563 | 548 | 138.1 |
| D | 13 | 200 | 604952 | 4377.01 | 563 | 548 | 138.1 |
| D | 2 | 249 | 325634 | 2354.23 | 563 | 548 | 138.1 |
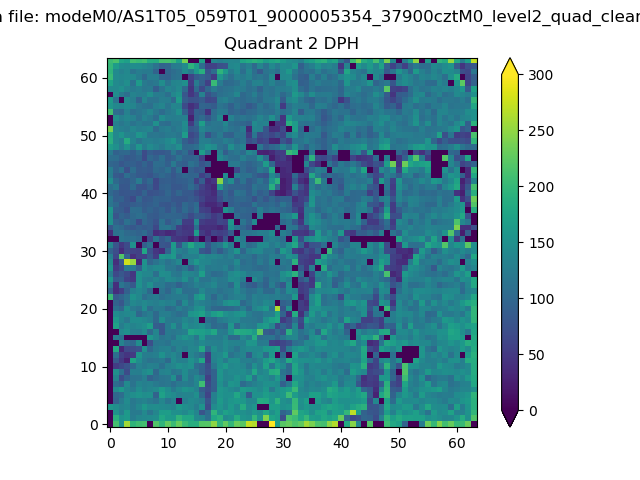
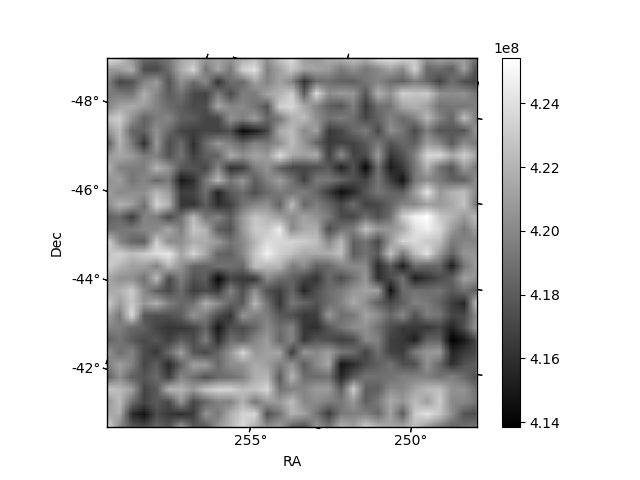
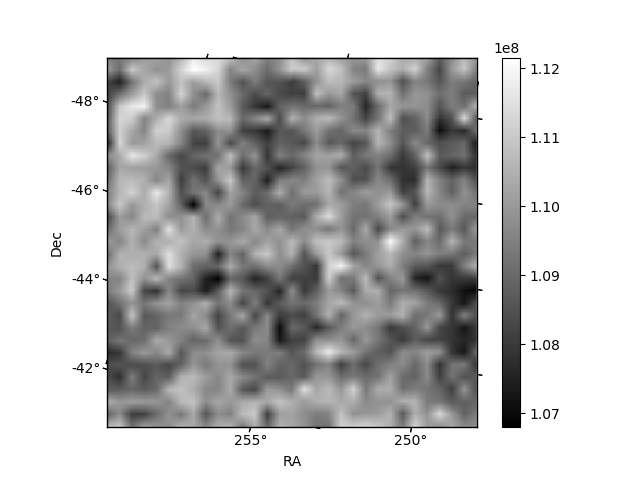
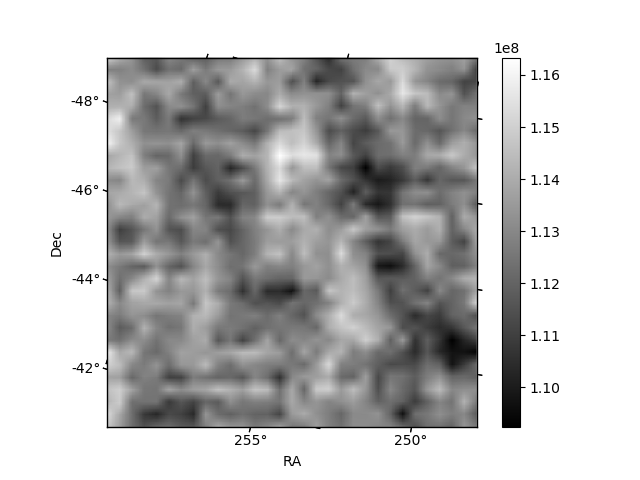
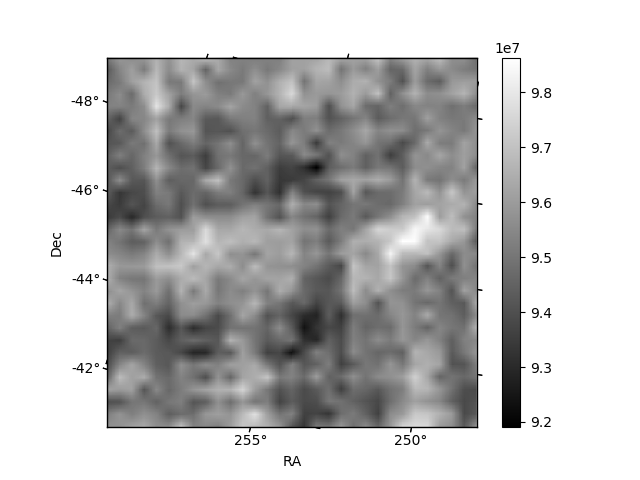
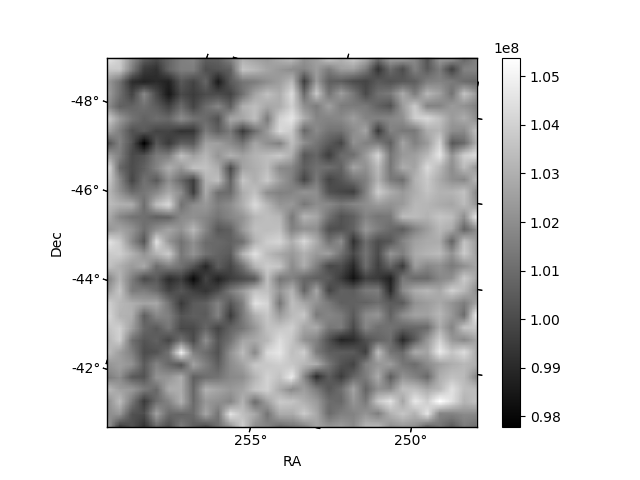
Histogram calculated using DETX and DETY for each event in the final _common_clean file
| Quadrant A | 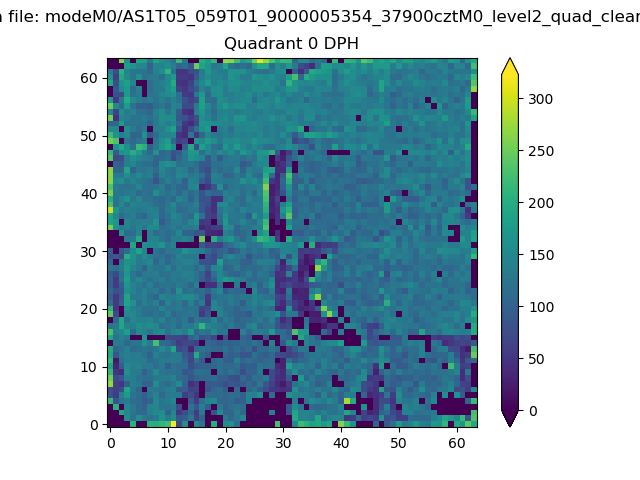 |
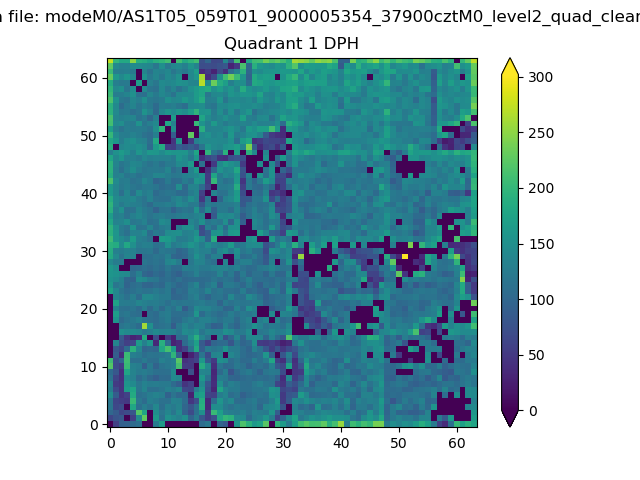 |
Quadrant B |
|---|---|---|---|
| Quadrant D | 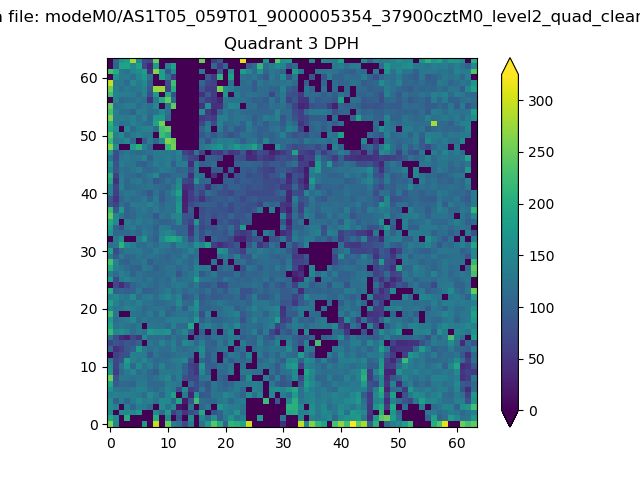 |
 |
Quadrant C |
| Plot type | Count rate plots | Images |
|---|---|---|
| Comparison with Poisson distribution Blue bars denote a histogram of data divided into 1 sec bins. Red curve is a Poisson curve with rate = median count rate of data. |
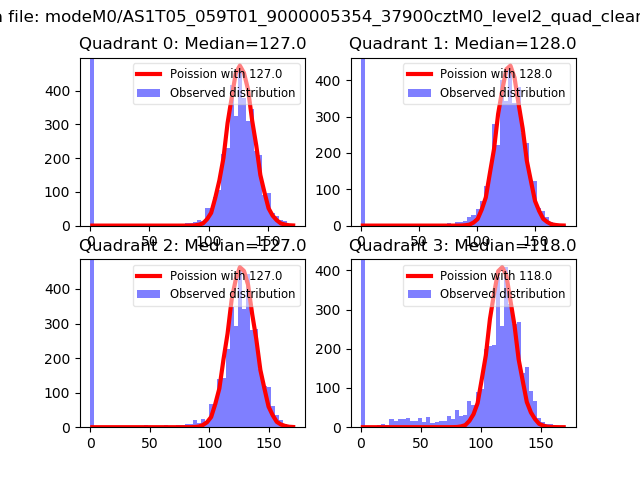 |
 |
| Quadrant-wise count rates Data is divided into 100 sec bins |
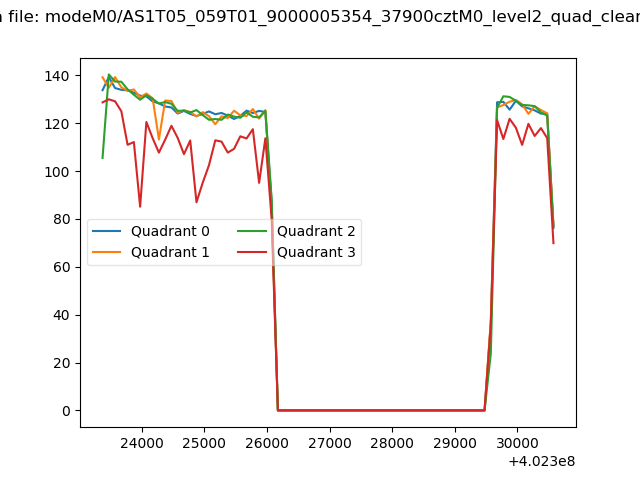 |
|
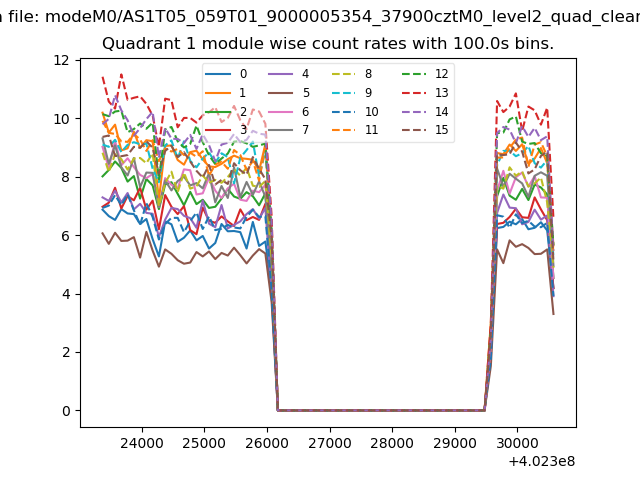
| Module-wise count rates for Quadrant A Data is divided into 100 sec bins |
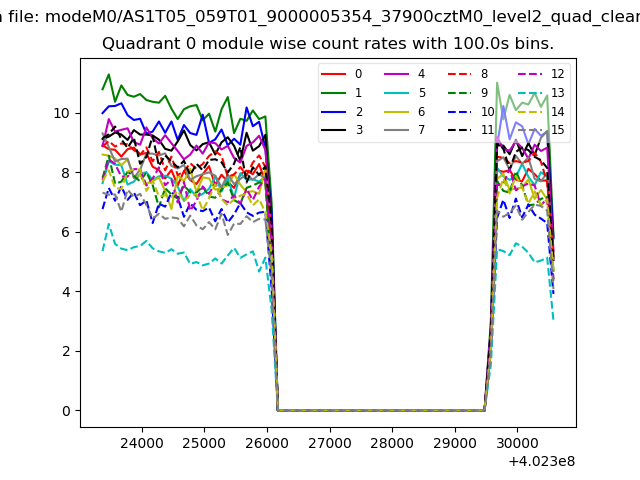 |
 |
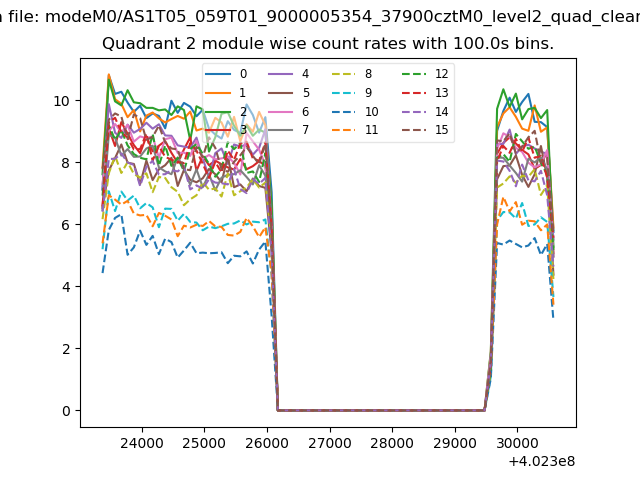
| Module-wise count rates for Quadrant B Data is divided into 100 sec bins |
 |
 |
| Module-wise count rates for Quadrant C Data is divided into 100 sec bins |
 |
 |
| Module-wise count rates for Quadrant D Data is divided into 100 sec bins |
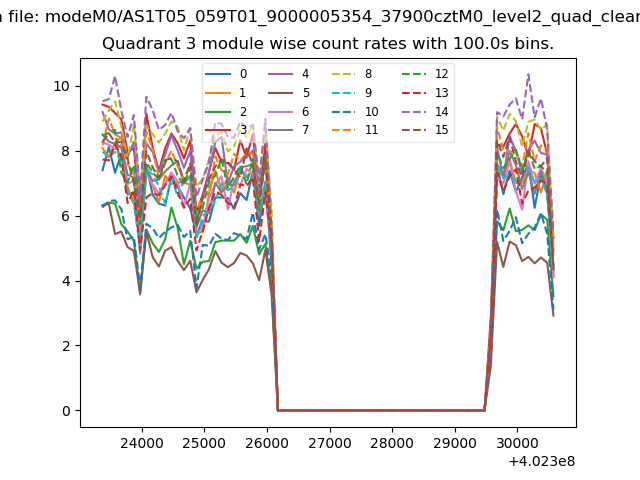 |
 |
| Parameter | Plot |
|---|---|
| CZT HV Monitor | 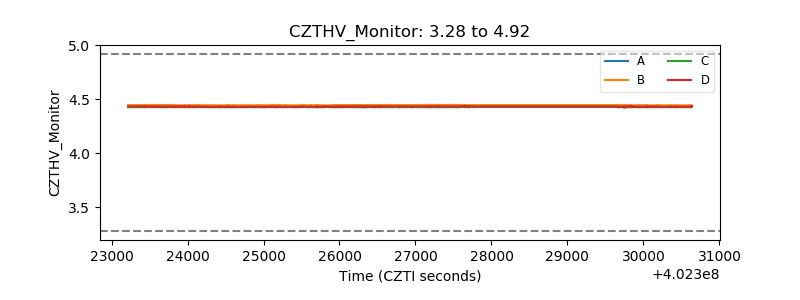 |
| D_VDD | 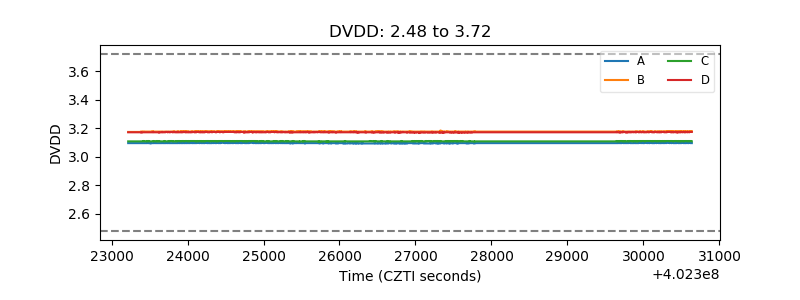 |
| Temperature 1 | 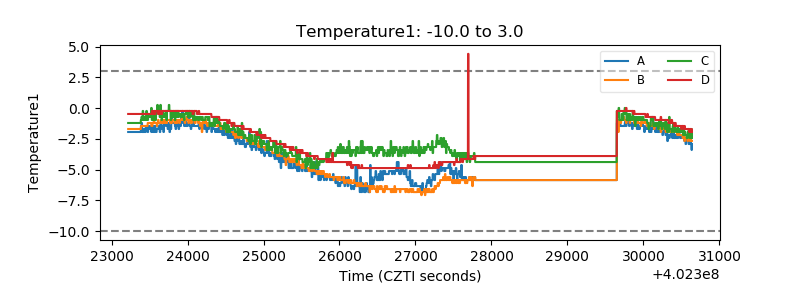 |
| Veto HV Monitor | 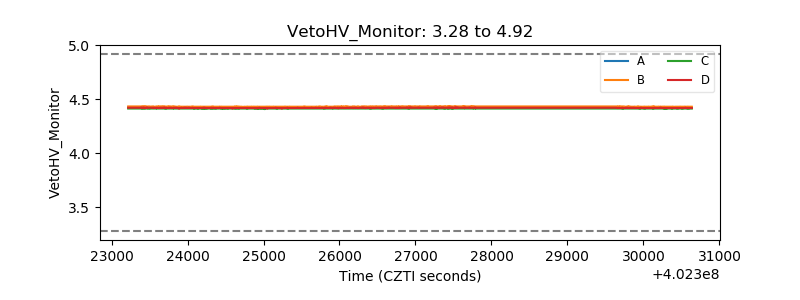 |
| Veto LLD | 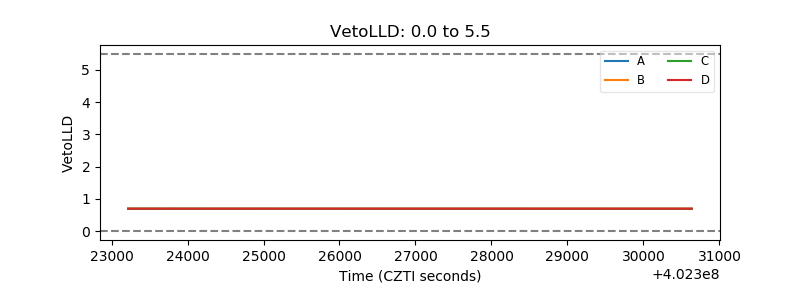 |
| Alpha Counter | 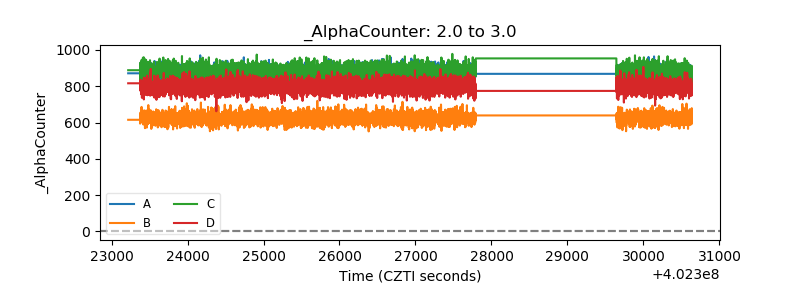 |
| _CPM_Rate | 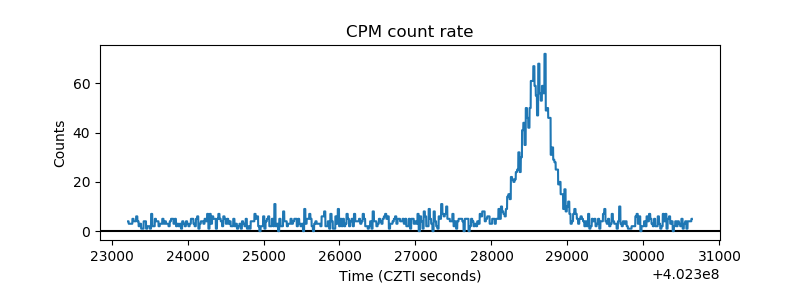 |
| CZT Counter | 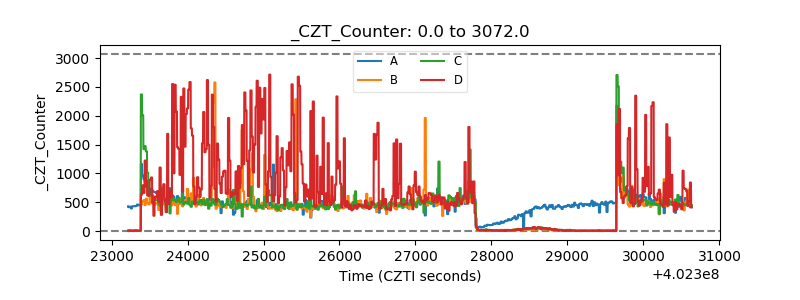 |
| +2.5 Volts monitor | 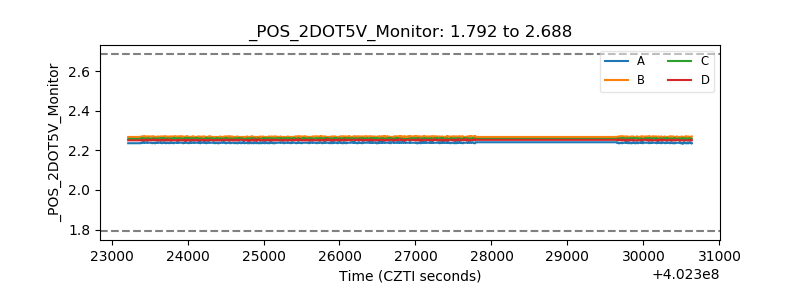 |
| +5 Volts monitor |  |
| _ROLL_ROT | 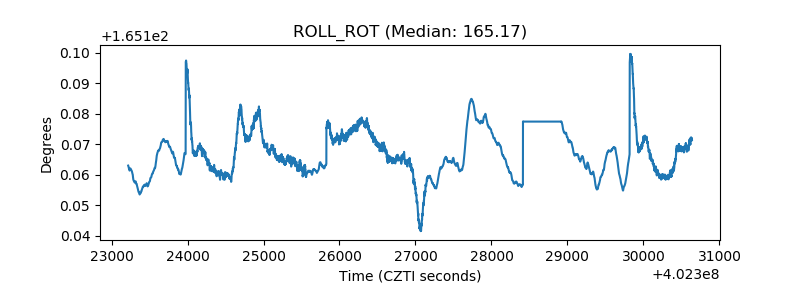 |
| _Roll_DEC | 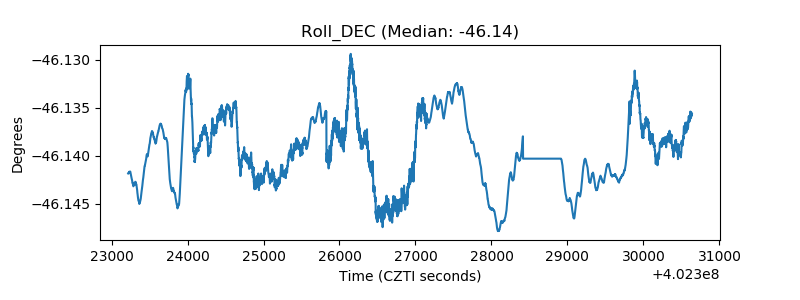 |
| _Roll_RA | 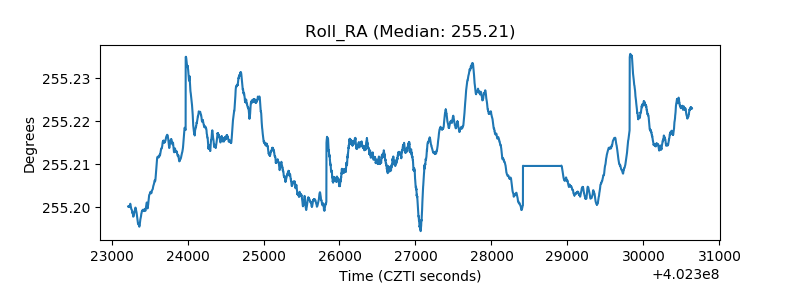 |
| Veto Counter | 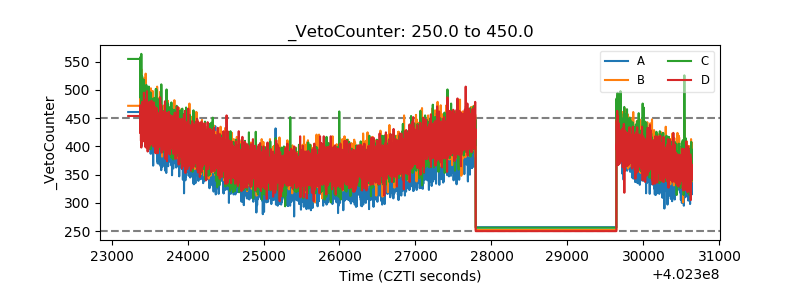 |