| Param | Original file | Final file |
|---|---|---|
| Filename | modeM0/AS1T05_059T01_9000005354_37901cztM0_level2.evt | modeM0/AS1T05_059T01_9000005354_37901cztM0_level2_quad_clean.evt |
| Size (bytes) | 478,621,440 | 71,536,320 |
| Size | 456.4 MB | 68.2 MB |
| Events in quadrant A | 4,280,180 | 428,884 |
| Events in quadrant B | 3,297,698 | 452,765 |
| Events in quadrant C | 2,931,060 | 462,662 |
| Events in quadrant D | 3,606,365 | 430,292 |
| Mode M0 | |||
|---|---|---|---|
| Quadrant | BADHDUFLAG | Total packets | Discarded packets |
| A | 0 | 16218 | 3 |
| B | 0 | 13484 | 2 |
| C | 0 | 12256 | 2 |
| D | 0 | 14584 | 2 |
| Mode SS | |||
|---|---|---|---|
| Quadrant | BADHDUFLAG | Total packets | Discarded packets |
| A | 0 | 114 | 0 |
| B | 0 | 114 | 0 |
| C | 0 | 114 | 0 |
| D | 0 | 114 | 0 |
| Mode M9 | |||
|---|---|---|---|
| Quadrant | BADHDUFLAG | Total packets | Discarded packets |
| A | 0 | 22 | 0 |
| B | 0 | 22 | 0 |
| C | 0 | 22 | 0 |
| D | 0 | 23 | 0 |
| Quadrant | Total seconds | Saturated seconds | Saturation percentage |
|---|---|---|---|
| A | 5589 | 660 | 11.808910% |
| B | 5589 | 218 | 3.900519% |
| C | 5589 | 85 | 1.520845% |
| D | 5589 | 321 | 5.743425% |
Noise dominated data is calculated using 1-second bins in cleaned event files. If a bin has >2000 counts, and if more than 50% of those come from <1% of pixels, then it is considered to be noise-dominated and hence unusable.
| Quadrant | # 1 sec bins | Bins with >0 counts | Bins with >2000 counts | High rate bins dominated by noise | Noise dominated (total time) | Noise dominated (detector-on time) | Marked lightcurve |
|---|---|---|---|---|---|---|---|
| A | 7111 | 5590 | 617 | 617 | 8.68% | 11.04% | 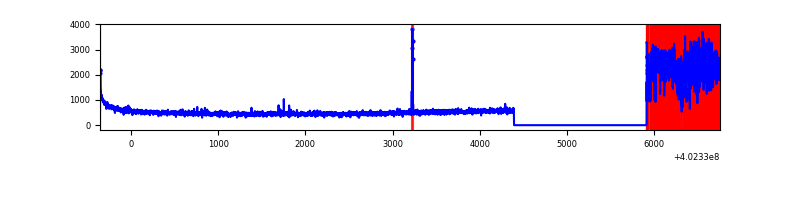 |
| B | 7111 | 5590 | 168 | 168 | 2.36% | 3.01% | 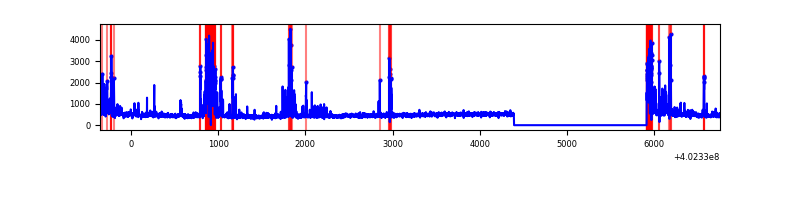 |
| C | 7111 | 5590 | 78 | 78 | 1.10% | 1.40% | 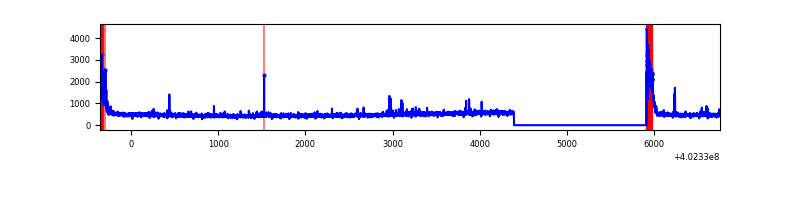 |
| D | 7111 | 5590 | 223 | 223 | 3.14% | 3.99% | 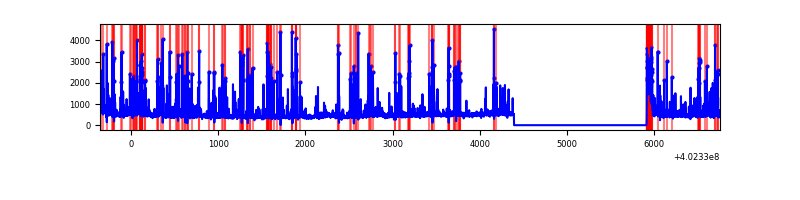 |
Top three noisy pixels from each quadrant. If the there are fewer than three noisy pixels in the level2.evt file, extra rows are filled as -1
| Pixel properties | Quadrant properties | ||||||
|---|---|---|---|---|---|---|---|
| Quadrant | DetID | PixID | Counts | Sigma | Mean | Median | Sigma |
| A | 15 | 222 | 1532638 | 12557.31 | 600 | 589 | 122.0 |
| A | 10 | 83 | 357995 | 2929.45 | 600 | 589 | 122.0 |
| A | 13 | 6 | 20911 | 166.57 | 600 | 589 | 122.0 |
| B | 5 | 172 | 624489 | 5236.07 | 613 | 596 | 119.2 |
| B | 4 | 81 | 45816 | 379.51 | 613 | 596 | 119.2 |
| B | 0 | 186 | 40180 | 332.21 | 613 | 596 | 119.2 |
| C | 0 | 10 | 293212 | 2085.78 | 600 | 604 | 140.3 |
| C | 15 | 214 | 235246 | 1672.58 | 600 | 604 | 140.3 |
| C | 14 | 254 | 46279 | 325.58 | 600 | 604 | 140.3 |
| D | 1 | 52 | 710526 | 4895.59 | 590 | 573 | 145.0 |
| D | 12 | 233 | 182749 | 1256.22 | 590 | 573 | 145.0 |
| D | 13 | 200 | 104740 | 718.3 | 590 | 573 | 145.0 |
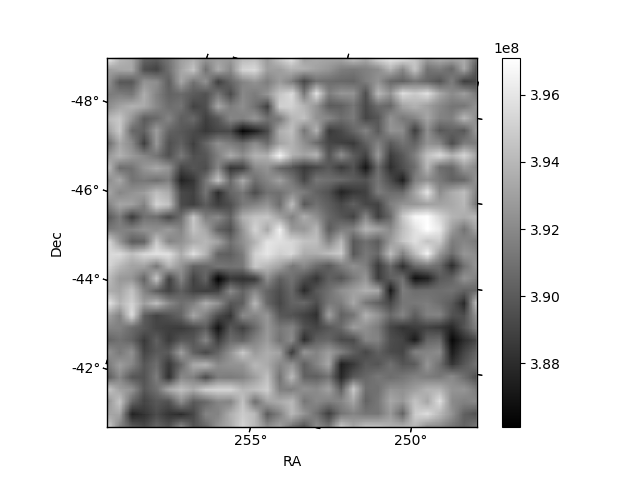
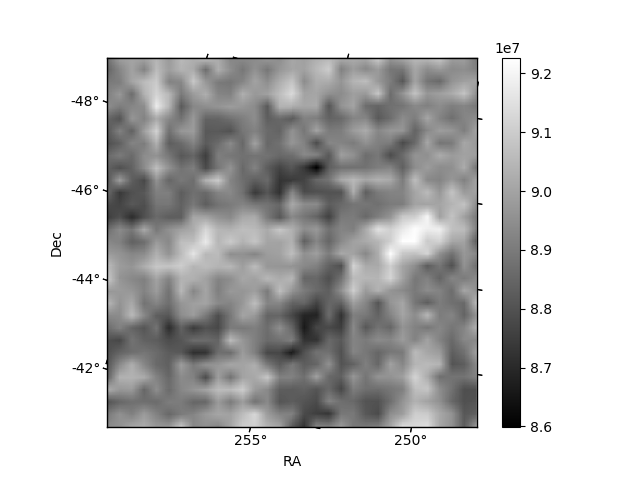
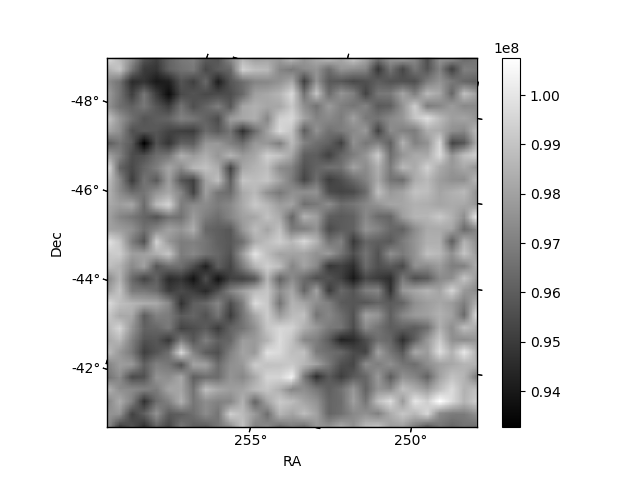
Histogram calculated using DETX and DETY for each event in the final _common_clean file
| Quadrant A | 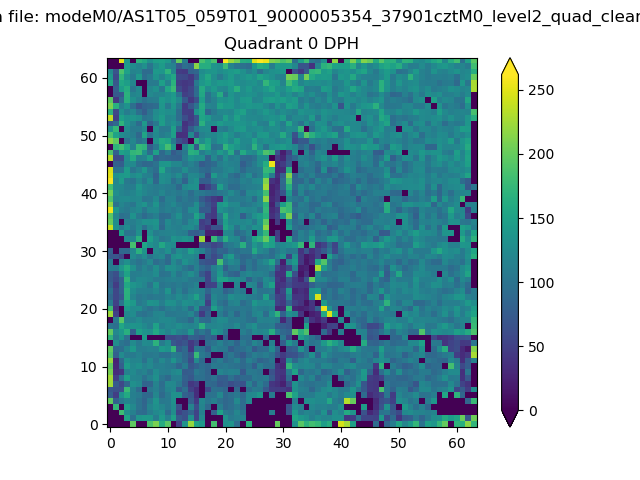 |
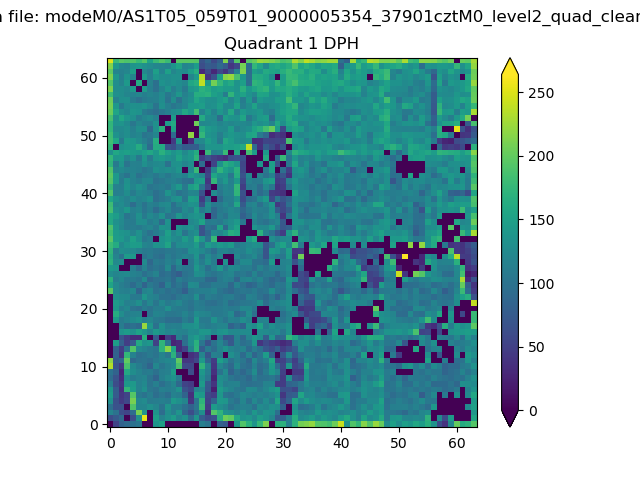 |
Quadrant B |
|---|---|---|---|
| Quadrant D | 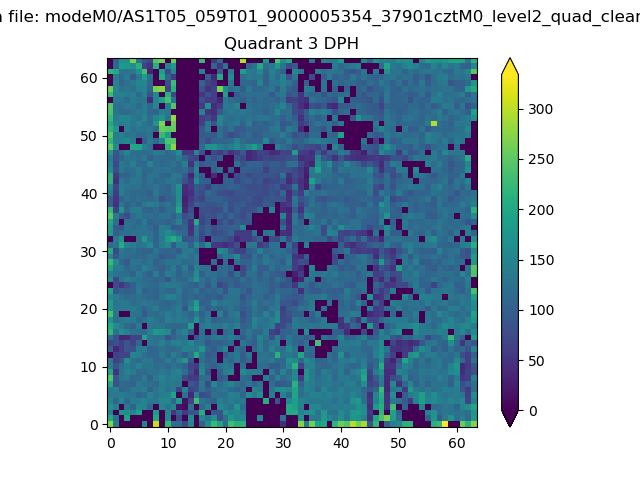 |
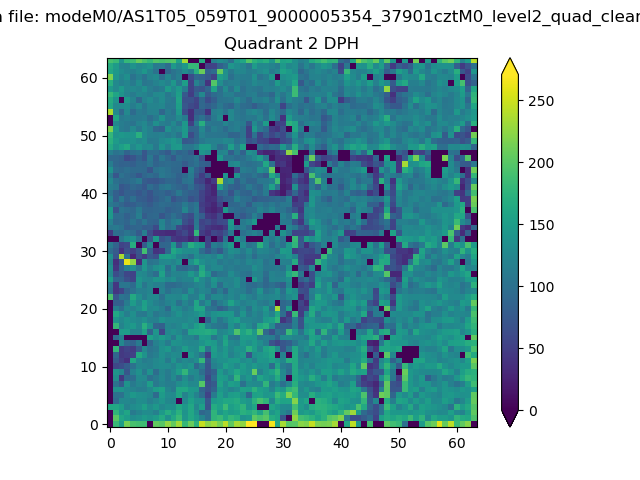 |
Quadrant C |
| Plot type | Count rate plots | Images |
|---|---|---|
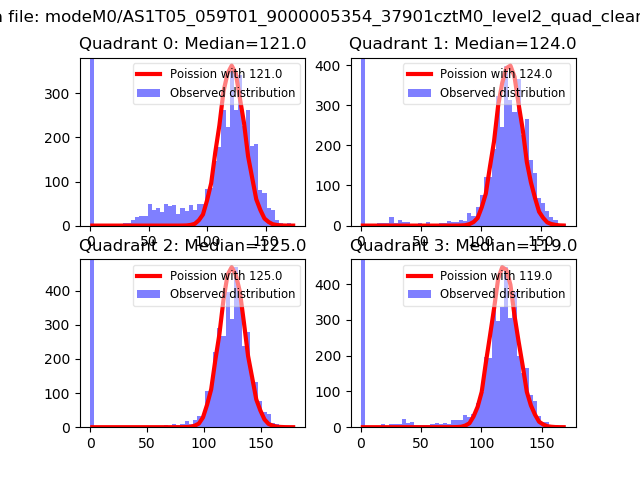
| Comparison with Poisson distribution Blue bars denote a histogram of data divided into 1 sec bins. Red curve is a Poisson curve with rate = median count rate of data. |
 |
 |
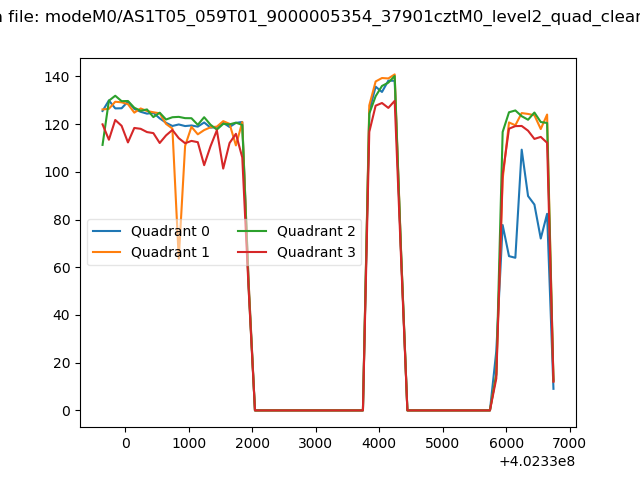
| Quadrant-wise count rates Data is divided into 100 sec bins |
 |
|
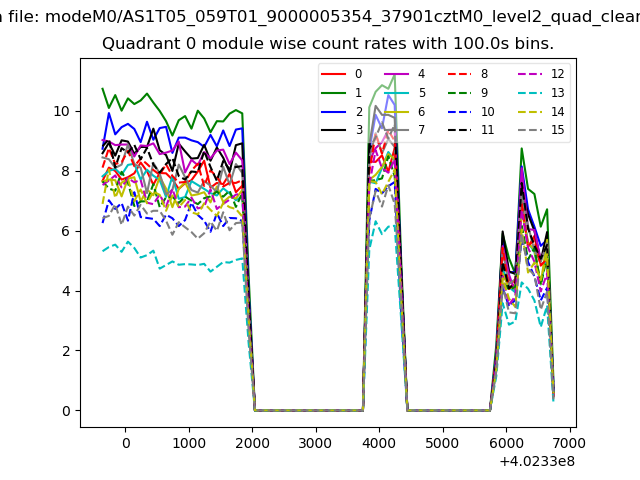
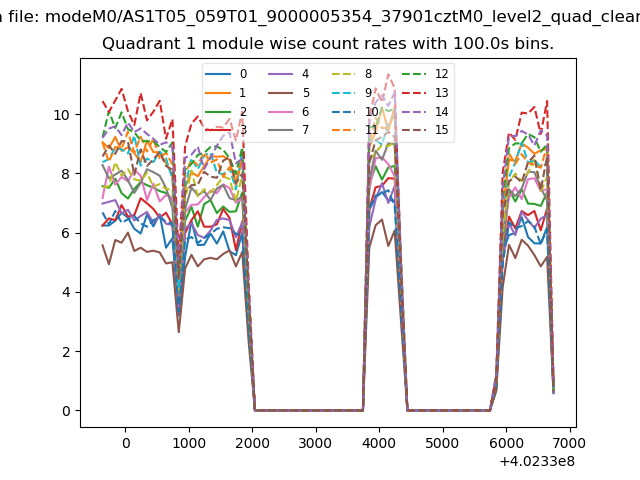
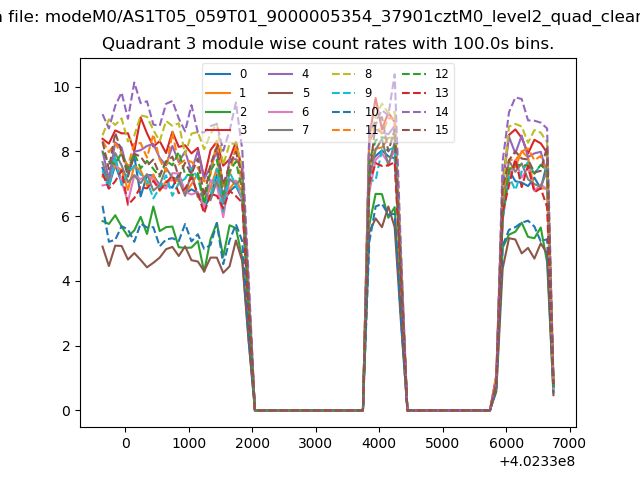
| Module-wise count rates for Quadrant A Data is divided into 100 sec bins |
 |
 |
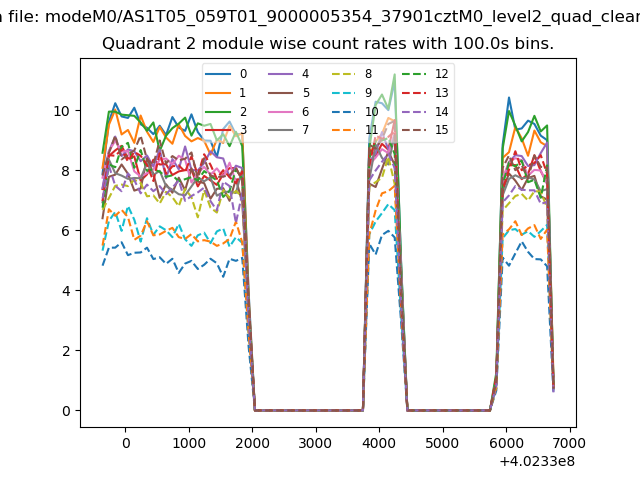
| Module-wise count rates for Quadrant B Data is divided into 100 sec bins |
 |
 |
| Module-wise count rates for Quadrant C Data is divided into 100 sec bins |
 |
 |
| Module-wise count rates for Quadrant D Data is divided into 100 sec bins |
 |
 |
| Parameter | Plot |
|---|---|
| CZT HV Monitor | 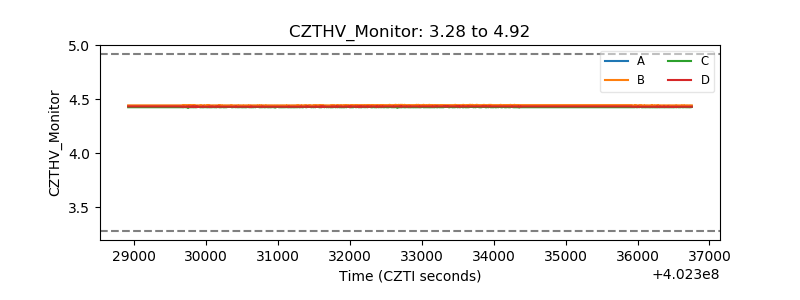 |
| D_VDD | 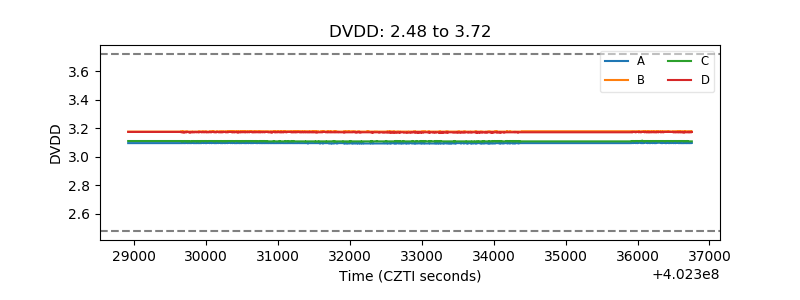 |
| Temperature 1 | 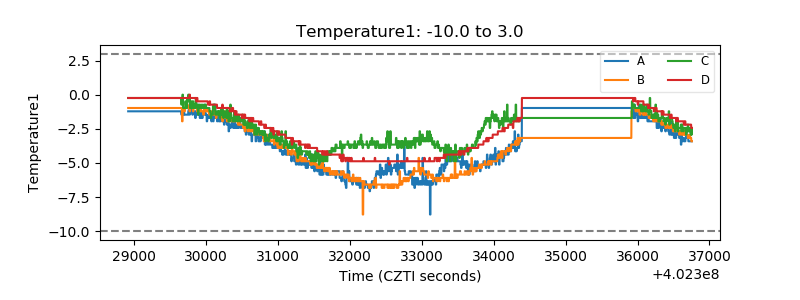 |
| Veto HV Monitor | 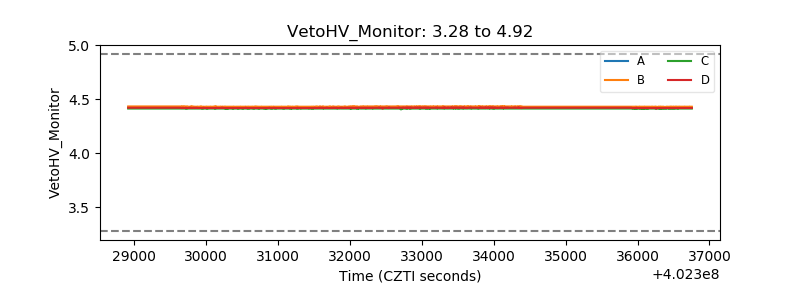 |
| Veto LLD | 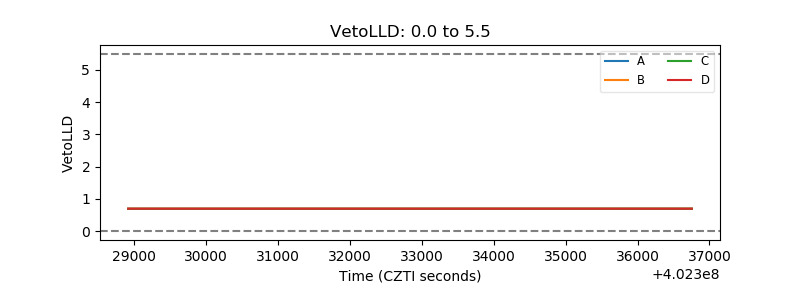 |
| Alpha Counter | 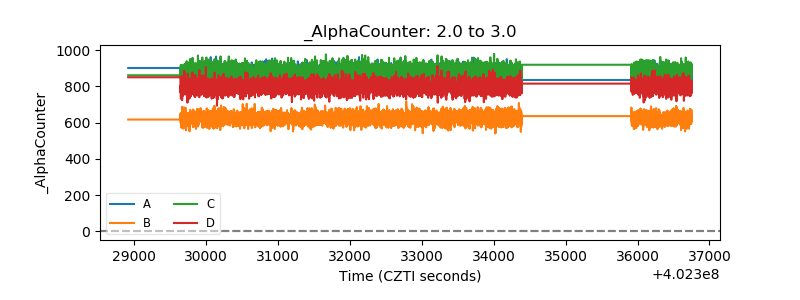 |
| _CPM_Rate | 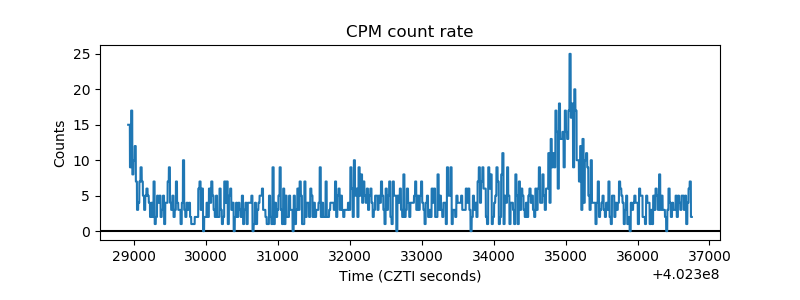 |
| CZT Counter | 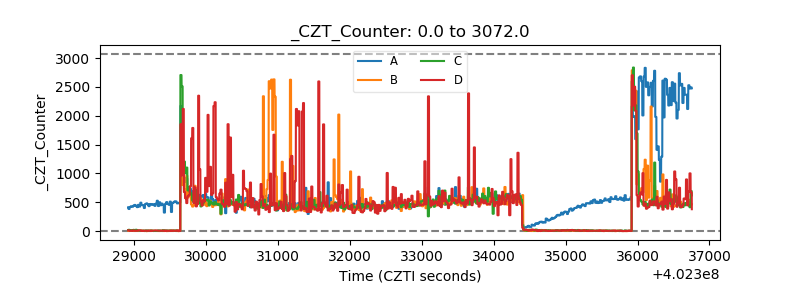 |
| +2.5 Volts monitor | 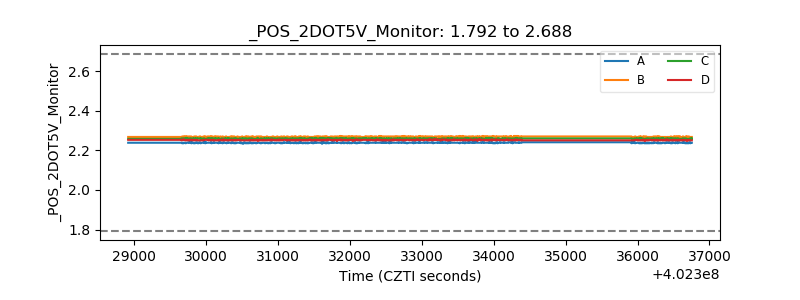 |
| +5 Volts monitor | 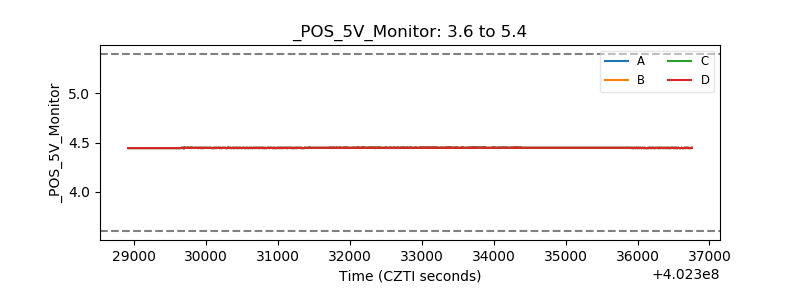 |
| _ROLL_ROT | 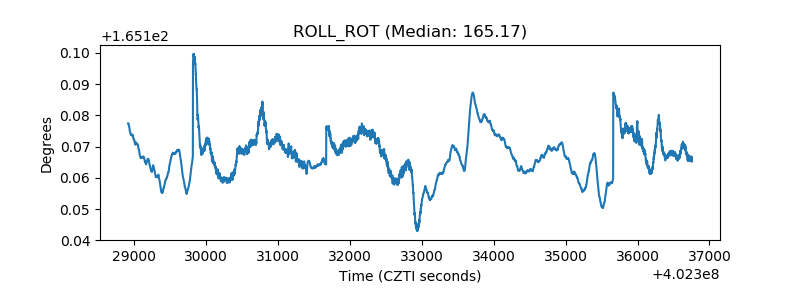 |
| _Roll_DEC | 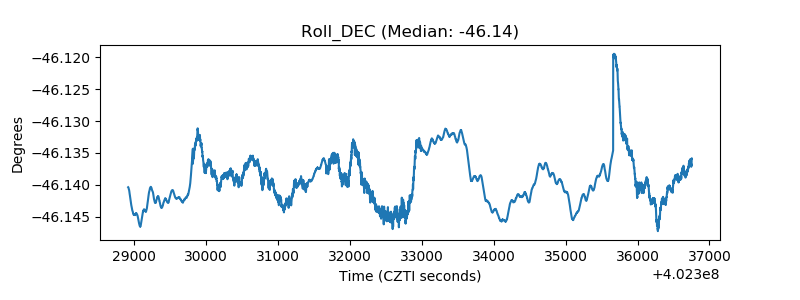 |
| _Roll_RA | 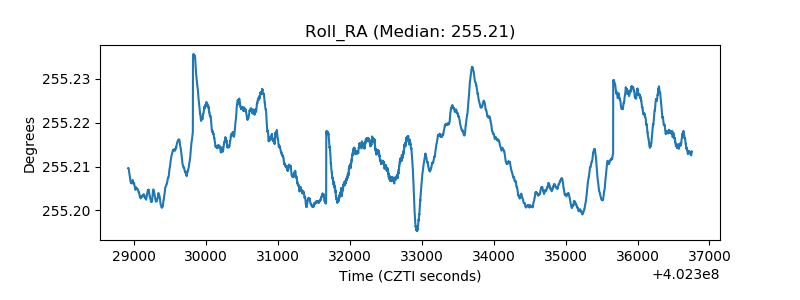 |
| Veto Counter | 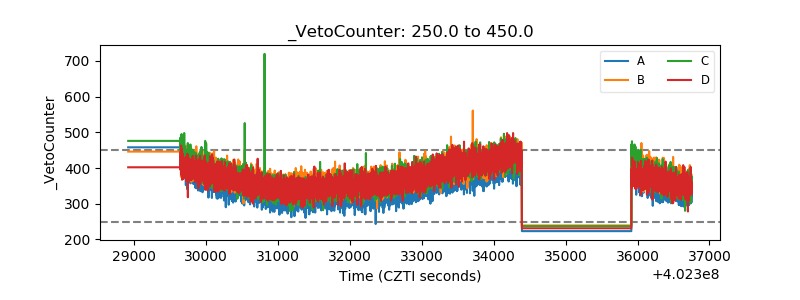 |