| Param | Original file | Final file |
|---|---|---|
| Filename | modeM0/AS1T05_059T01_9000005354_37902cztM0_level2.evt | modeM0/AS1T05_059T01_9000005354_37902cztM0_level2_quad_clean.evt |
| Size (bytes) | 548,778,240 | 73,886,400 |
| Size | 523.4 MB | 70.5 MB |
| Events in quadrant A | 4,973,529 | 437,419 |
| Events in quadrant B | 3,440,246 | 477,551 |
| Events in quadrant C | 3,035,092 | 482,375 |
| Events in quadrant D | 4,778,845 | 435,085 |
| Mode M0 | |||
|---|---|---|---|
| Quadrant | BADHDUFLAG | Total packets | Discarded packets |
| A | 0 | 18387 | 3 |
| B | 0 | 14101 | 2 |
| C | 0 | 12670 | 2 |
| D | 0 | 18264 | 2 |
| Mode SS | |||
|---|---|---|---|
| Quadrant | BADHDUFLAG | Total packets | Discarded packets |
| A | 0 | 120 | 0 |
| B | 0 | 120 | 0 |
| C | 0 | 120 | 0 |
| D | 0 | 120 | 0 |
| Mode M9 | |||
|---|---|---|---|
| Quadrant | BADHDUFLAG | Total packets | Discarded packets |
| A | 0 | 24 | 0 |
| B | 0 | 24 | 0 |
| C | 0 | 24 | 0 |
| D | 0 | 25 | 0 |
| Quadrant | Total seconds | Saturated seconds | Saturation percentage |
|---|---|---|---|
| A | 5773 | 887 | 15.364628% |
| B | 5773 | 192 | 3.325827% |
| C | 5773 | 87 | 1.507015% |
| D | 5773 | 569 | 9.856227% |
Noise dominated data is calculated using 1-second bins in cleaned event files. If a bin has >2000 counts, and if more than 50% of those come from <1% of pixels, then it is considered to be noise-dominated and hence unusable.
| Quadrant | # 1 sec bins | Bins with >0 counts | Bins with >2000 counts | High rate bins dominated by noise | Noise dominated (total time) | Noise dominated (detector-on time) | Marked lightcurve |
|---|---|---|---|---|---|---|---|
| A | 7115 | 5774 | 876 | 876 | 12.31% | 15.17% |  |
| B | 7115 | 5774 | 135 | 135 | 1.90% | 2.34% |  |
| C | 7115 | 5774 | 84 | 84 | 1.18% | 1.45% |  |
| D | 7115 | 5774 | 462 | 462 | 6.49% | 8.00% |  |
Top three noisy pixels from each quadrant. If the there are fewer than three noisy pixels in the level2.evt file, extra rows are filled as -1
| Pixel properties | Quadrant properties | ||||||
|---|---|---|---|---|---|---|---|
| Quadrant | DetID | PixID | Counts | Sigma | Mean | Median | Sigma |
| A | 15 | 222 | 2161239 | 17423.77 | 615 | 605 | 124.0 |
| A | 10 | 83 | 366736 | 2952.55 | 615 | 605 | 124.0 |
| A | 12 | 189 | 23195 | 182.17 | 615 | 605 | 124.0 |
| B | 5 | 172 | 456756 | 3717.38 | 635 | 618 | 122.7 |
| B | 4 | 232 | 82479 | 667.14 | 635 | 618 | 122.7 |
| B | 4 | 171 | 74006 | 598.09 | 635 | 618 | 122.7 |
| C | 0 | 10 | 294513 | 2021.47 | 621 | 625 | 145.4 |
| C | 15 | 214 | 241629 | 1657.71 | 621 | 625 | 145.4 |
| C | 14 | 254 | 58378 | 397.25 | 621 | 625 | 145.4 |
| D | 1 | 52 | 1039720 | 6436.62 | 590 | 575 | 161.4 |
| D | 12 | 233 | 387402 | 2396.06 | 590 | 575 | 161.4 |
| D | 2 | 249 | 262295 | 1621.13 | 590 | 575 | 161.4 |
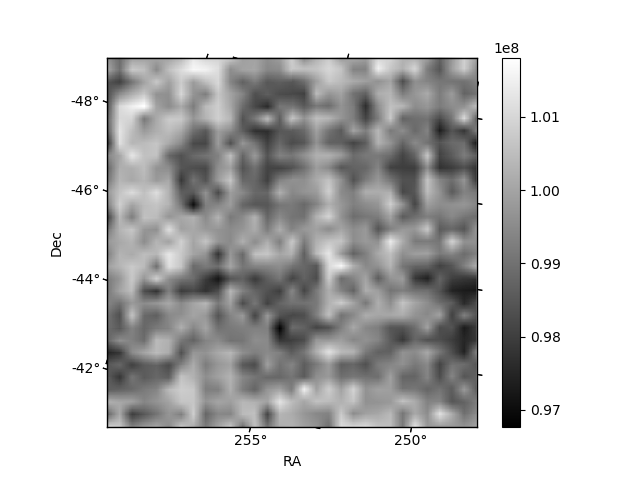
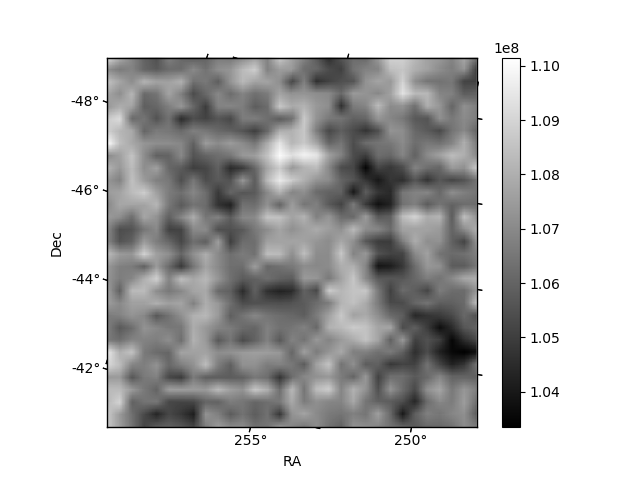
Histogram calculated using DETX and DETY for each event in the final _common_clean file
| Quadrant A | 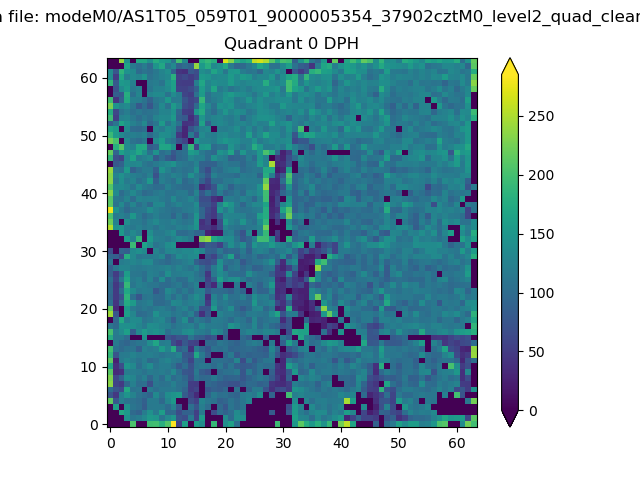 |
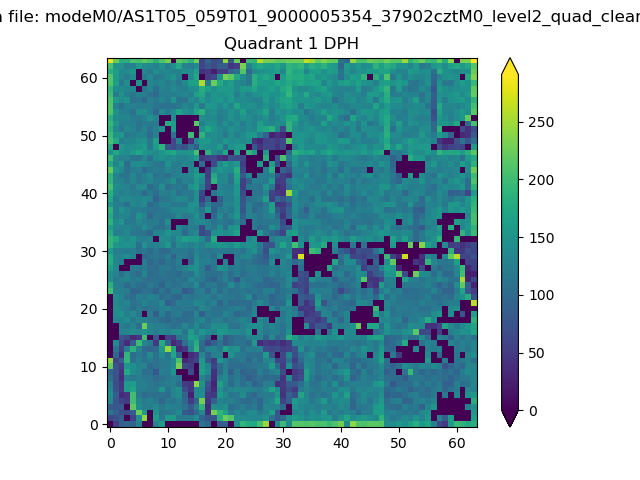 |
Quadrant B |
|---|---|---|---|
| Quadrant D | 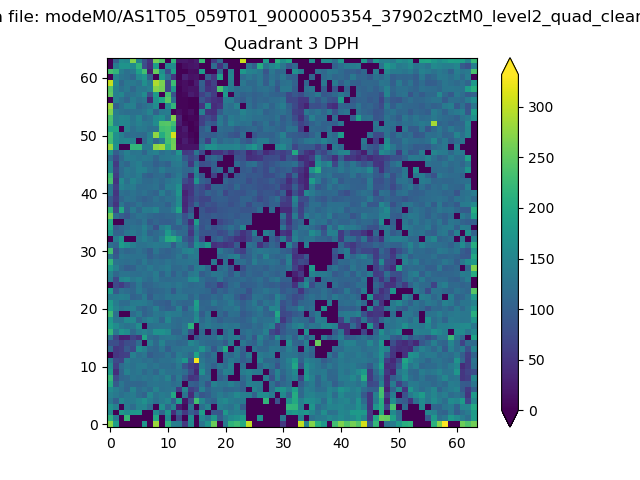 |
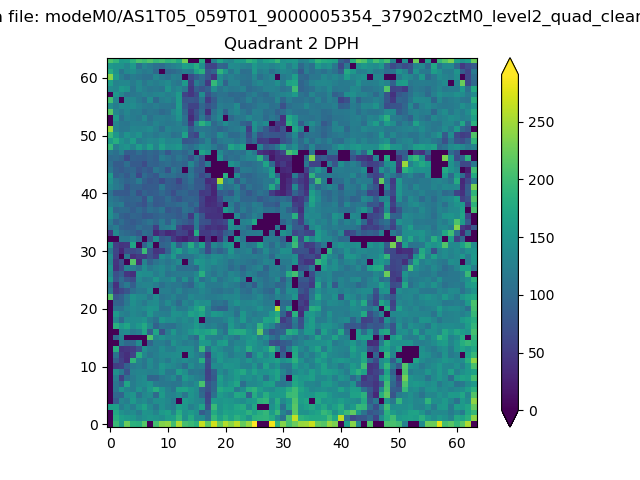 |
Quadrant C |
| Plot type | Count rate plots | Images |
|---|---|---|
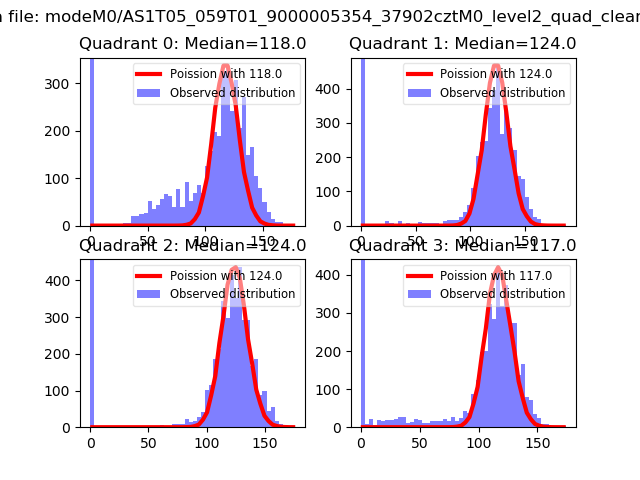
| Comparison with Poisson distribution Blue bars denote a histogram of data divided into 1 sec bins. Red curve is a Poisson curve with rate = median count rate of data. |
 |
 |
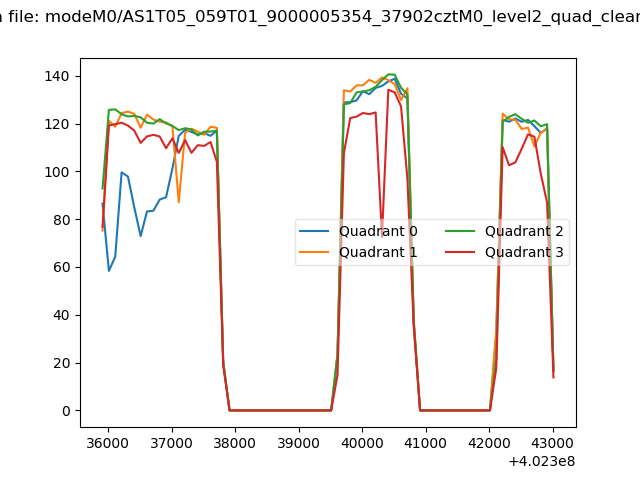
| Quadrant-wise count rates Data is divided into 100 sec bins |
 |
|
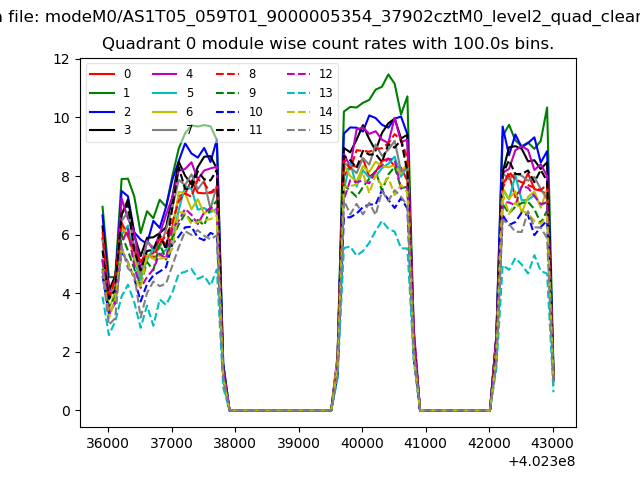
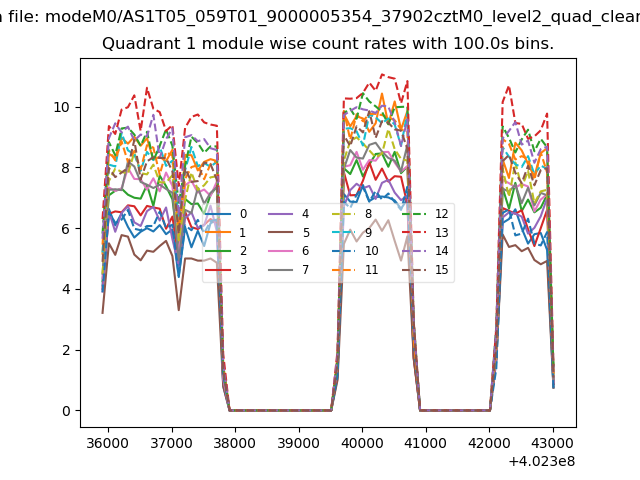
| Module-wise count rates for Quadrant A Data is divided into 100 sec bins |
 |
 |
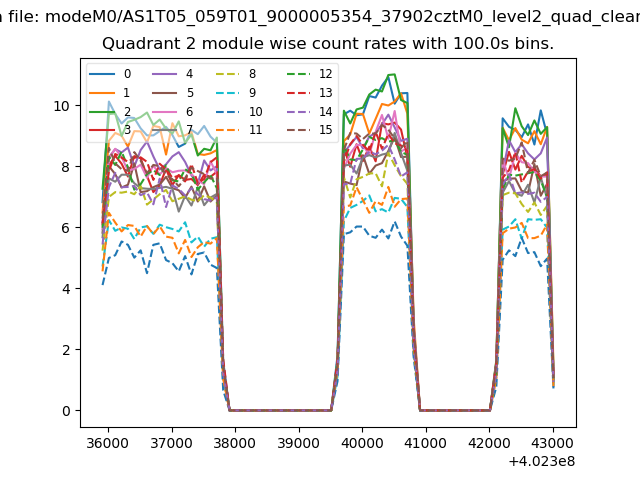
| Module-wise count rates for Quadrant B Data is divided into 100 sec bins |
 |
 |
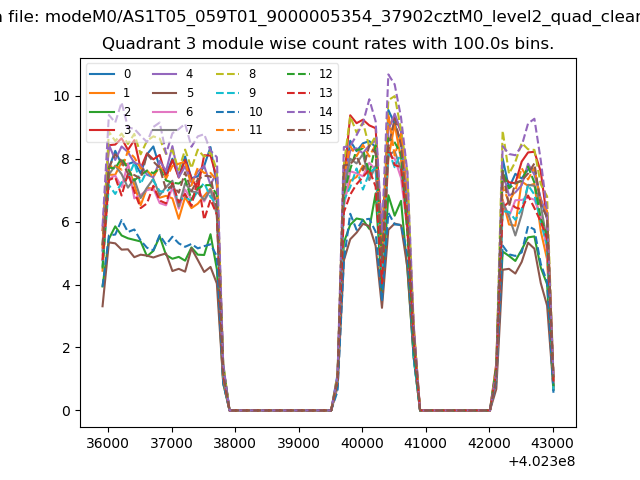
| Module-wise count rates for Quadrant C Data is divided into 100 sec bins |
 |
 |
| Module-wise count rates for Quadrant D Data is divided into 100 sec bins |
 |
 |
| Parameter | Plot |
|---|---|
| CZT HV Monitor |  |
| D_VDD | 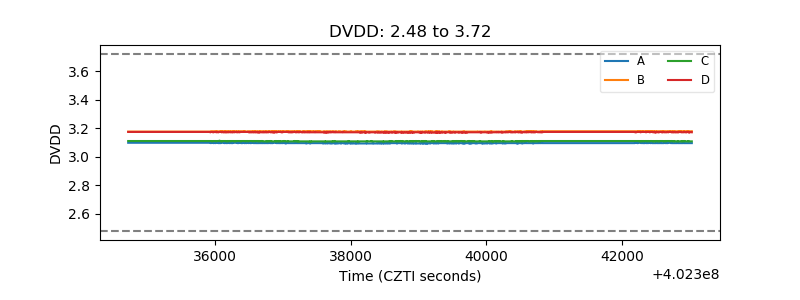 |
| Temperature 1 |  |
| Veto HV Monitor | 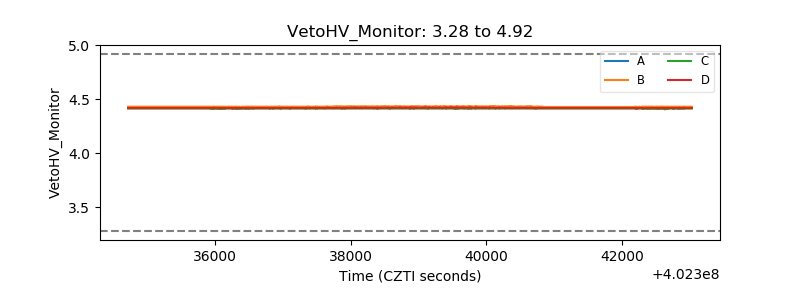 |
| Veto LLD | 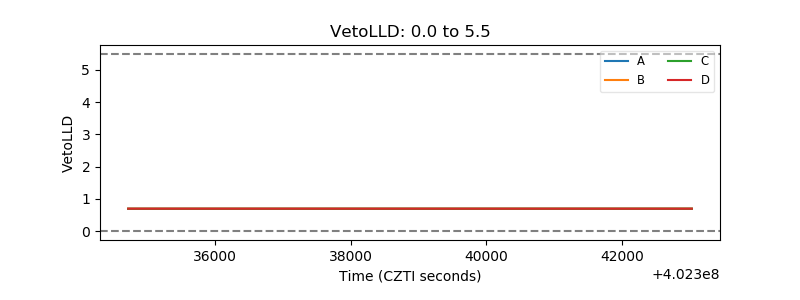 |
| Alpha Counter | 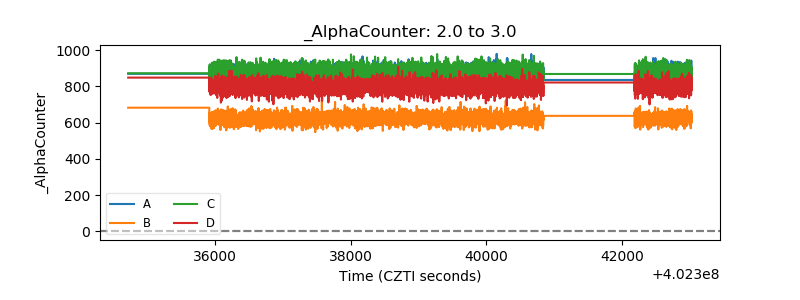 |
| _CPM_Rate | 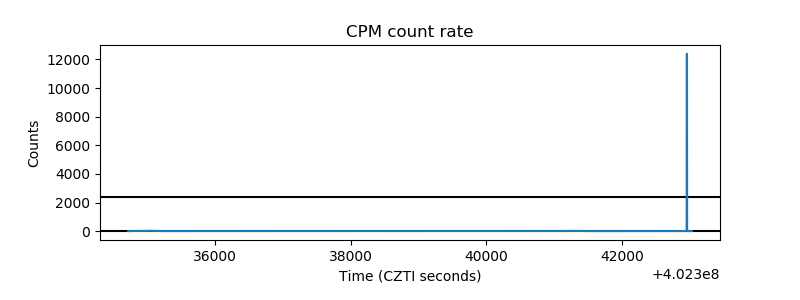 |
| CZT Counter | 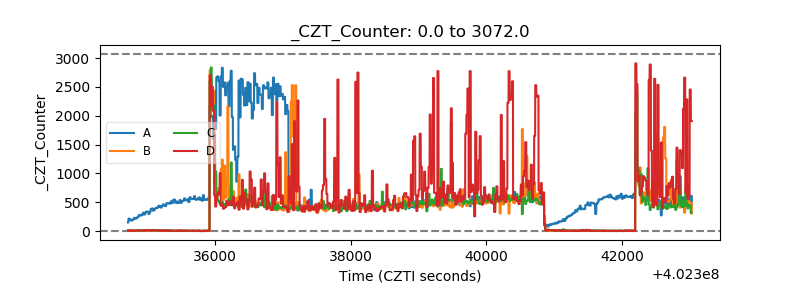 |
| +2.5 Volts monitor | 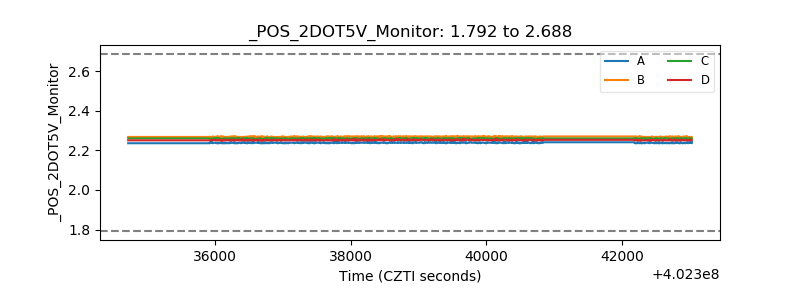 |
| +5 Volts monitor |  |
| _ROLL_ROT | 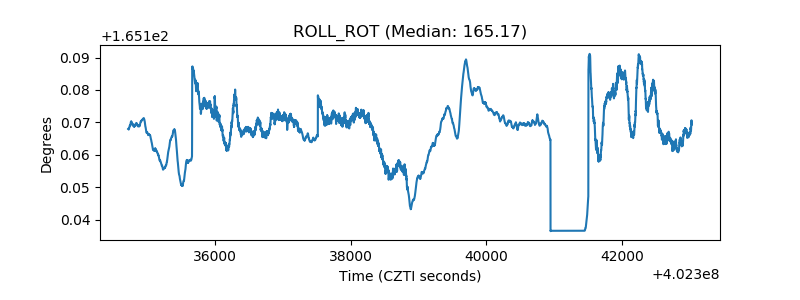 |
| _Roll_DEC | 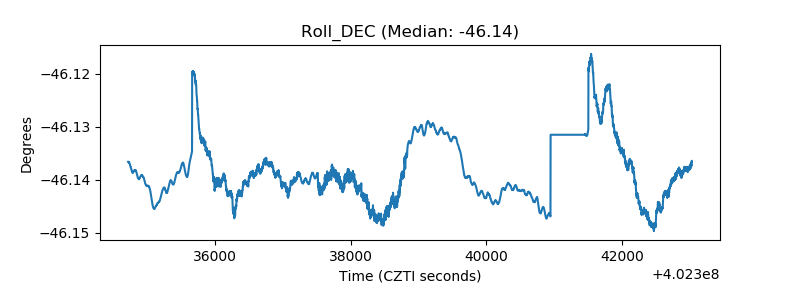 |
| _Roll_RA | 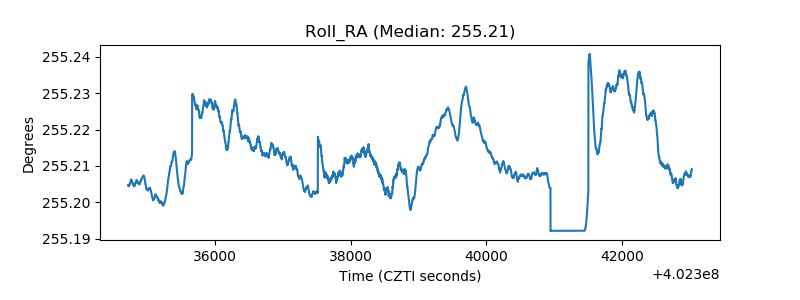 |
| Veto Counter | 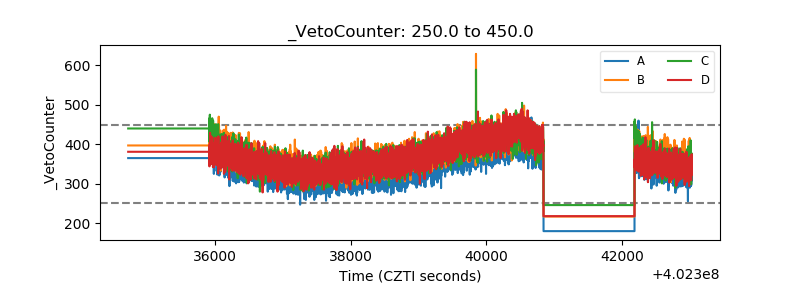 |