| Param | Original file | Final file |
|---|---|---|
| Filename | modeM0/AS1T05_059T01_9000005354_37903cztM0_level2.evt | modeM0/AS1T05_059T01_9000005354_37903cztM0_level2_quad_clean.evt |
| Size (bytes) | 503,331,840 | 80,314,560 |
| Size | 480.0 MB | 76.6 MB |
| Events in quadrant A | 3,148,065 | 512,466 |
| Events in quadrant B | 3,808,520 | 508,038 |
| Events in quadrant C | 3,154,099 | 515,942 |
| Events in quadrant D | 4,724,497 | 474,928 |
| Mode M0 | |||
|---|---|---|---|
| Quadrant | BADHDUFLAG | Total packets | Discarded packets |
| A | 0 | 13112 | 3 |
| B | 0 | 15376 | 2 |
| C | 0 | 13160 | 2 |
| D | 0 | 18124 | 2 |
| Mode SS | |||
|---|---|---|---|
| Quadrant | BADHDUFLAG | Total packets | Discarded packets |
| A | 0 | 122 | 0 |
| B | 0 | 122 | 0 |
| C | 0 | 122 | 0 |
| D | 0 | 122 | 0 |
| Mode M9 | |||
|---|---|---|---|
| Quadrant | BADHDUFLAG | Total packets | Discarded packets |
| A | 0 | 19 | 0 |
| B | 0 | 19 | 0 |
| C | 0 | 19 | 0 |
| D | 0 | 20 | 0 |
| Quadrant | Total seconds | Saturated seconds | Saturation percentage |
|---|---|---|---|
| A | 6020 | 25 | 0.415282% |
| B | 6020 | 225 | 3.737542% |
| C | 6020 | 57 | 0.946844% |
| D | 6020 | 442 | 7.342193% |
Noise dominated data is calculated using 1-second bins in cleaned event files. If a bin has >2000 counts, and if more than 50% of those come from <1% of pixels, then it is considered to be noise-dominated and hence unusable.
| Quadrant | # 1 sec bins | Bins with >0 counts | Bins with >2000 counts | High rate bins dominated by noise | Noise dominated (total time) | Noise dominated (detector-on time) | Marked lightcurve |
|---|---|---|---|---|---|---|---|
| A | 7303 | 6021 | 14 | 14 | 0.19% | 0.23% | 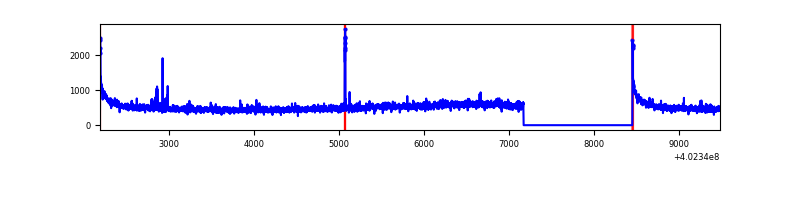 |
| B | 7303 | 6021 | 142 | 142 | 1.94% | 2.36% | 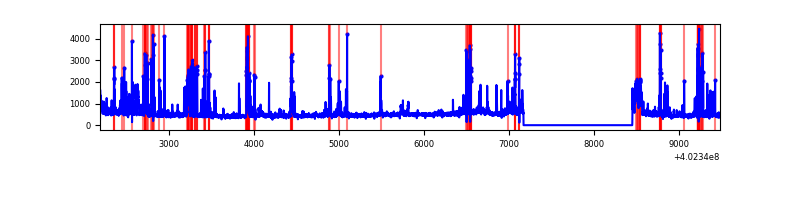 |
| C | 7303 | 6021 | 53 | 53 | 0.73% | 0.88% | 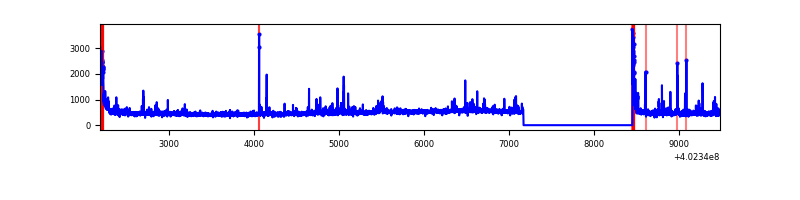 |
| D | 7303 | 6021 | 366 | 366 | 5.01% | 6.08% | 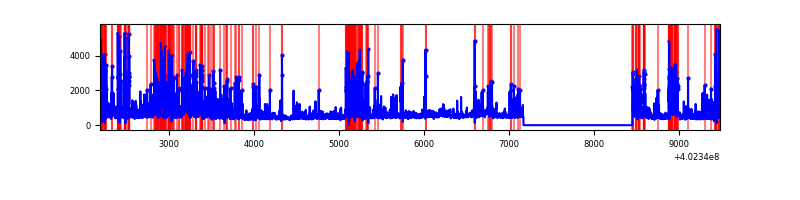 |
Top three noisy pixels from each quadrant. If the there are fewer than three noisy pixels in the level2.evt file, extra rows are filled as -1
| Pixel properties | Quadrant properties | ||||||
|---|---|---|---|---|---|---|---|
| Quadrant | DetID | PixID | Counts | Sigma | Mean | Median | Sigma |
| A | 10 | 83 | 408725 | 2969.8 | 671 | 659 | 137.4 |
| A | 15 | 222 | 49719 | 357.05 | 671 | 659 | 137.4 |
| A | 13 | 6 | 26558 | 188.49 | 671 | 659 | 137.4 |
| B | 5 | 172 | 657630 | 5187.6 | 661 | 644 | 126.6 |
| B | 4 | 232 | 184363 | 1450.66 | 661 | 644 | 126.6 |
| B | 4 | 171 | 79989 | 626.51 | 661 | 644 | 126.6 |
| C | 15 | 214 | 252632 | 1678.24 | 648 | 652 | 150.1 |
| C | 0 | 10 | 146790 | 973.31 | 648 | 652 | 150.1 |
| C | 14 | 254 | 119758 | 793.27 | 648 | 652 | 150.1 |
| D | 1 | 52 | 1216595 | 7186.5 | 624 | 610 | 169.2 |
| D | 2 | 249 | 337534 | 1991.23 | 624 | 610 | 169.2 |
| D | 1 | 47 | 256295 | 1511.1 | 624 | 610 | 169.2 |
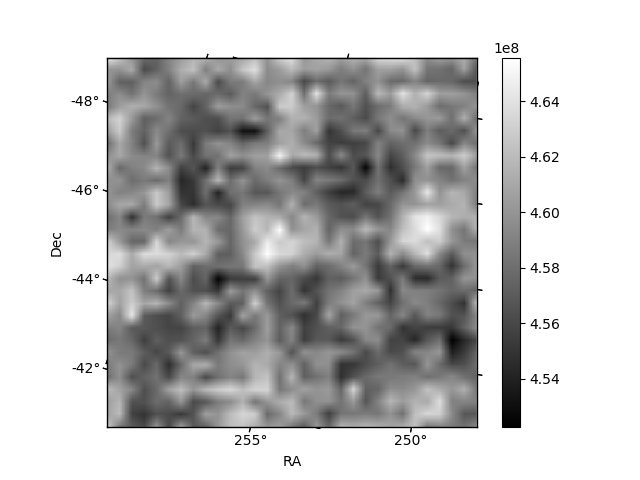
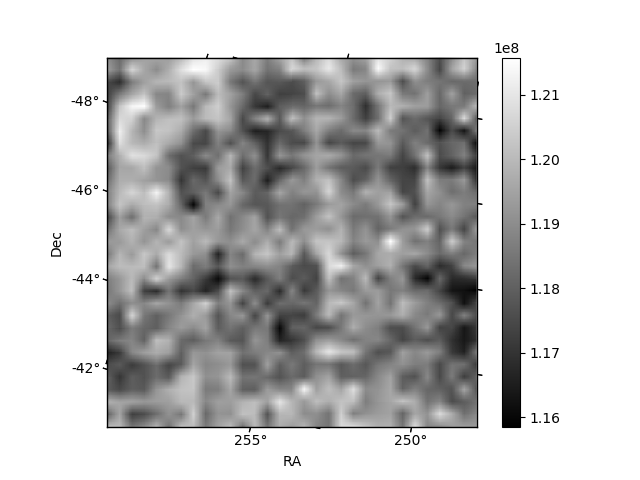
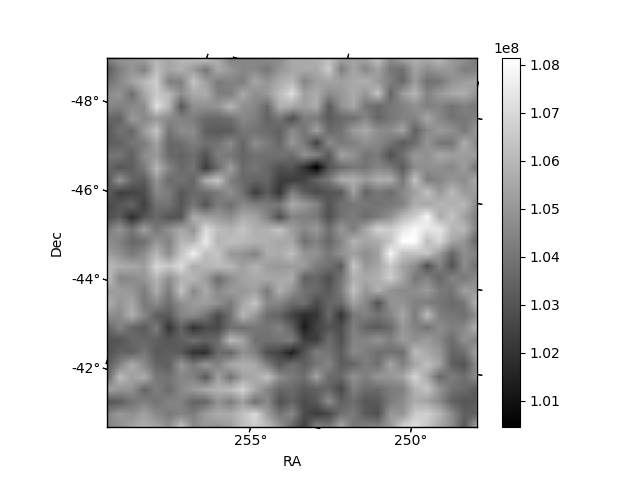
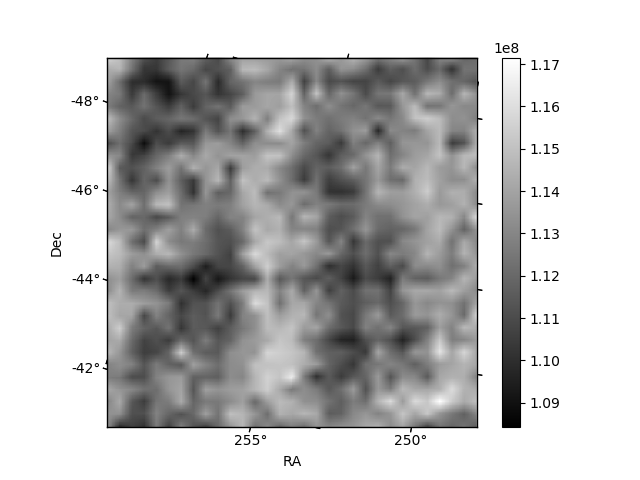
Histogram calculated using DETX and DETY for each event in the final _common_clean file
| Quadrant A | 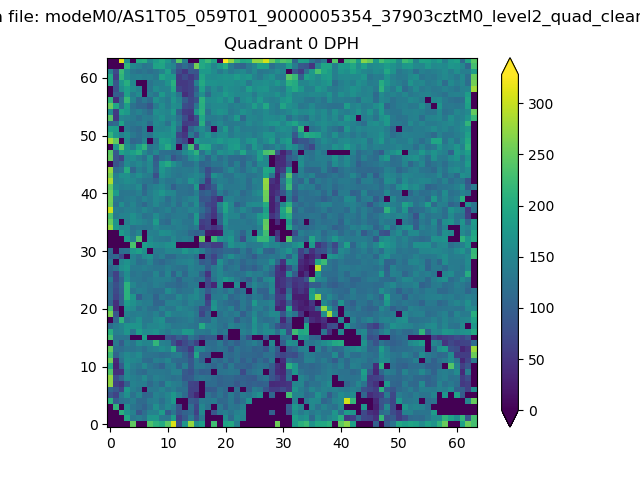 |
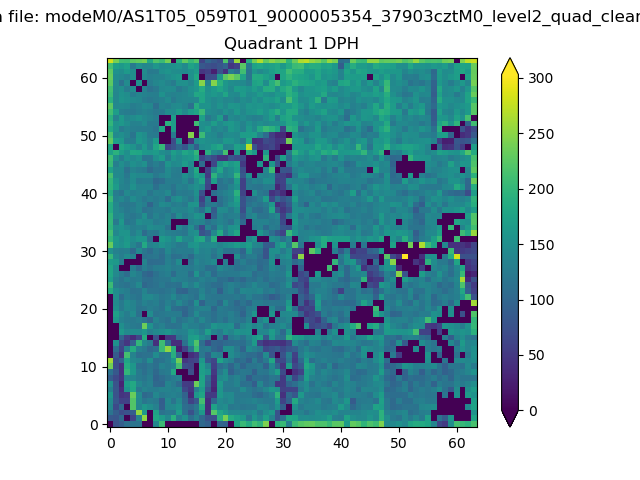 |
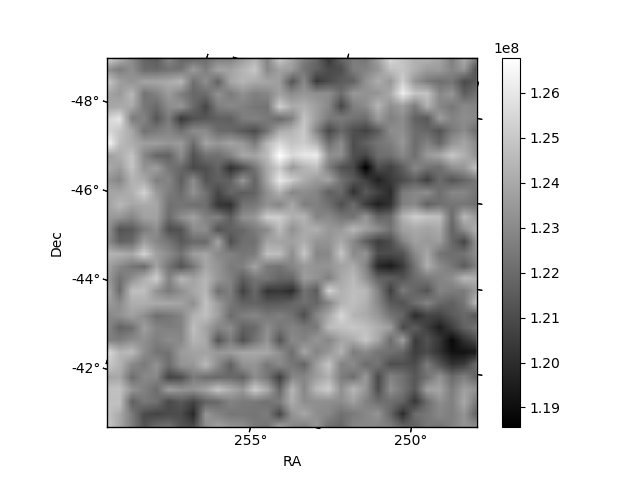
Quadrant B |
|---|---|---|---|
| Quadrant D | 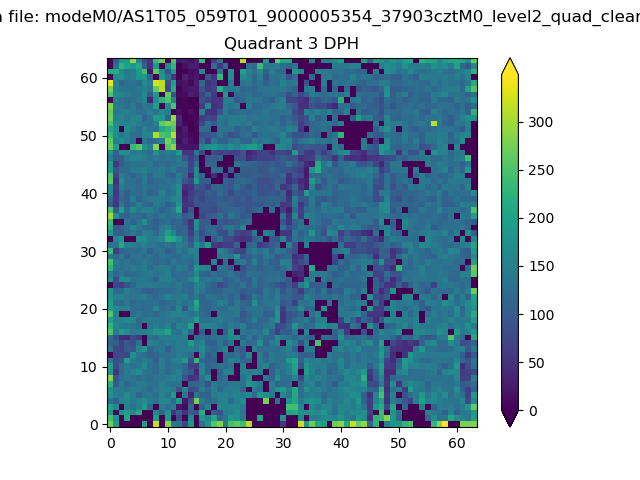 |
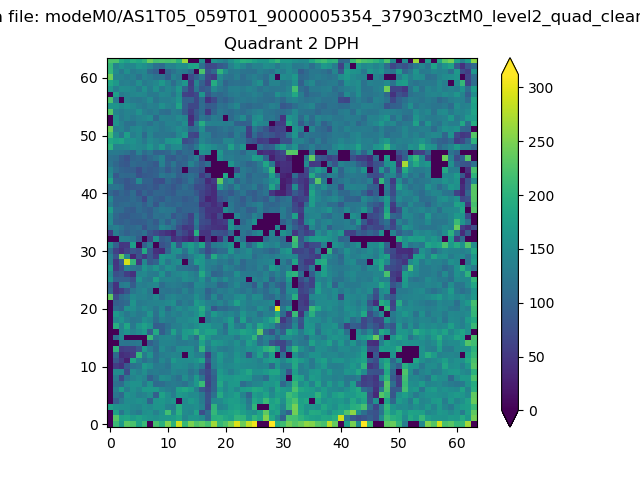 |
Quadrant C |
| Plot type | Count rate plots | Images |
|---|---|---|
| Comparison with Poisson distribution Blue bars denote a histogram of data divided into 1 sec bins. Red curve is a Poisson curve with rate = median count rate of data. |
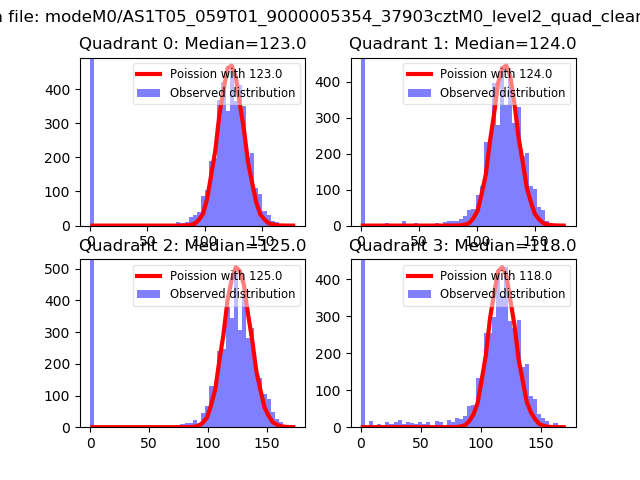 |
 |
| Quadrant-wise count rates Data is divided into 100 sec bins |
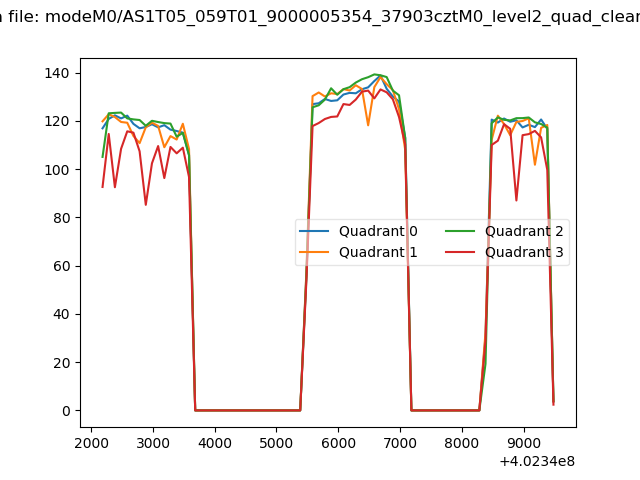 |
|
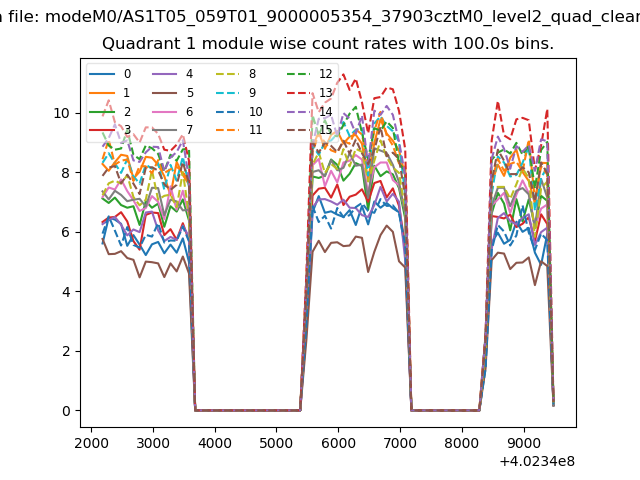
| Module-wise count rates for Quadrant A Data is divided into 100 sec bins |
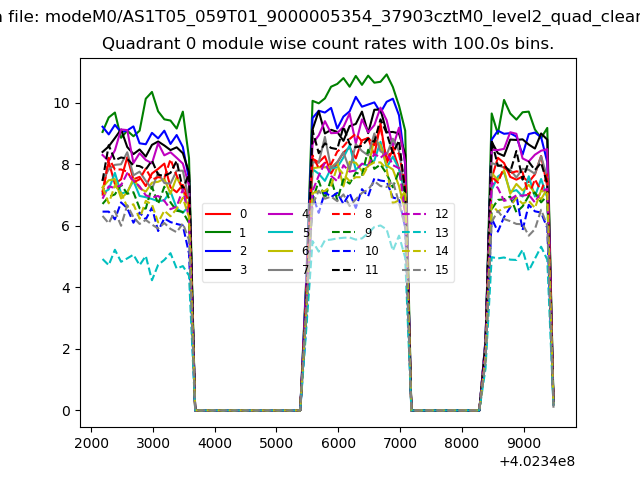 |
 |
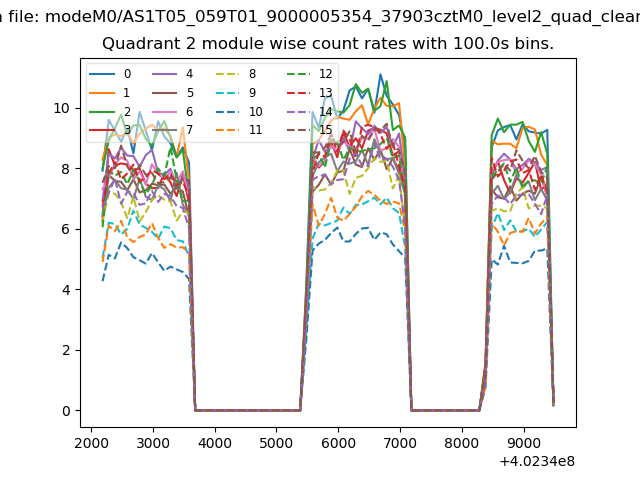
| Module-wise count rates for Quadrant B Data is divided into 100 sec bins |
 |
 |
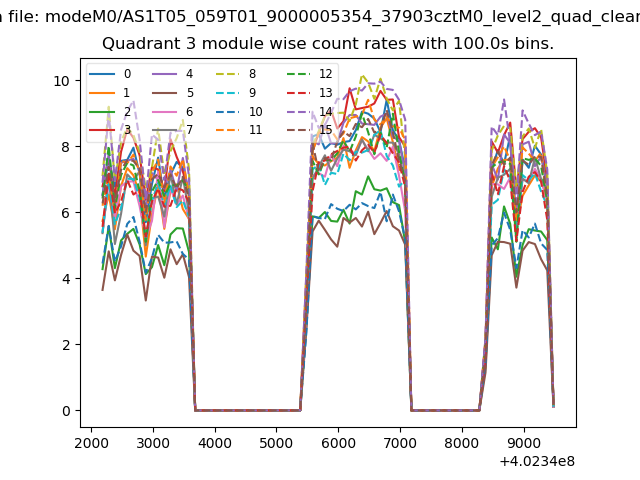
| Module-wise count rates for Quadrant C Data is divided into 100 sec bins |
 |
 |
| Module-wise count rates for Quadrant D Data is divided into 100 sec bins |
 |
 |
| Parameter | Plot |
|---|---|
| CZT HV Monitor | 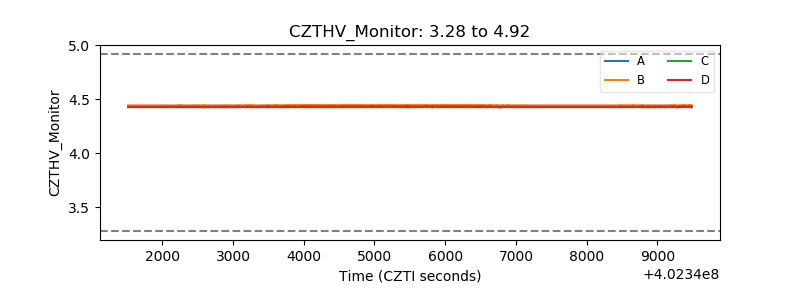 |
| D_VDD | 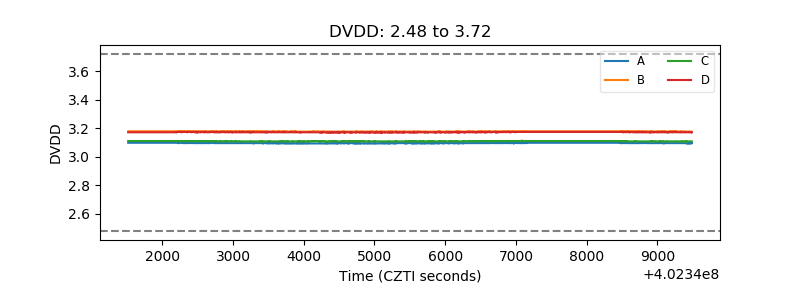 |
| Temperature 1 | 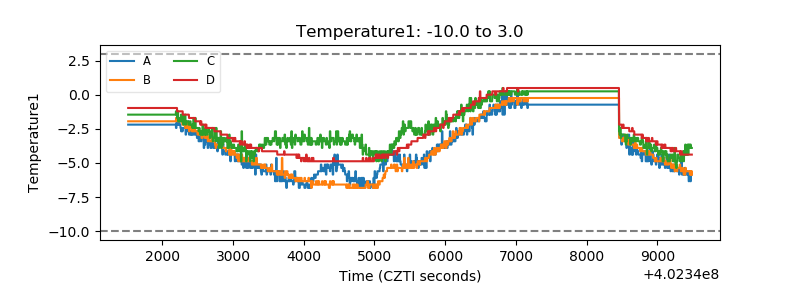 |
| Veto HV Monitor | 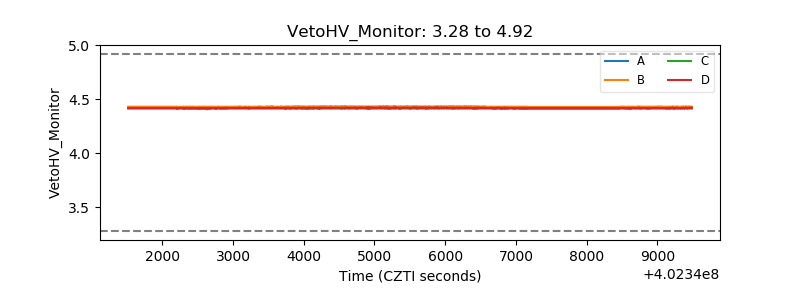 |
| Veto LLD | 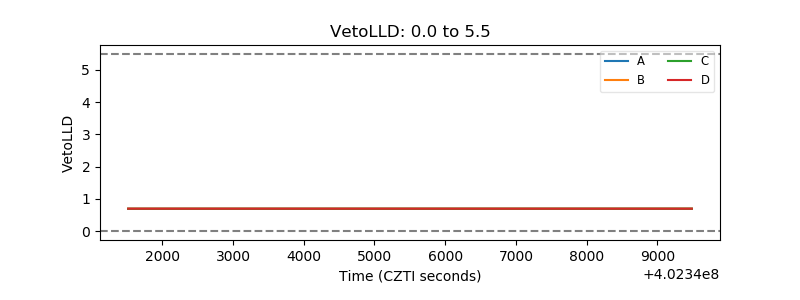 |
| Alpha Counter | 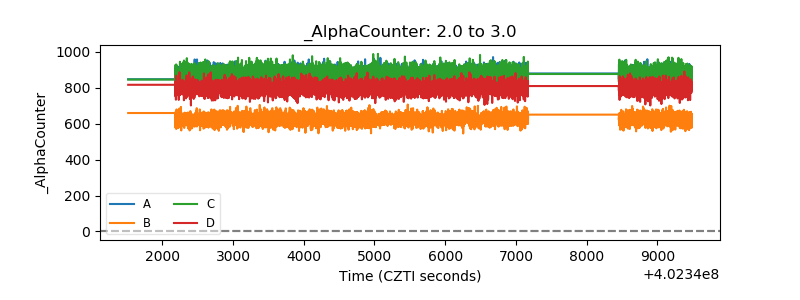 |
| _CPM_Rate | 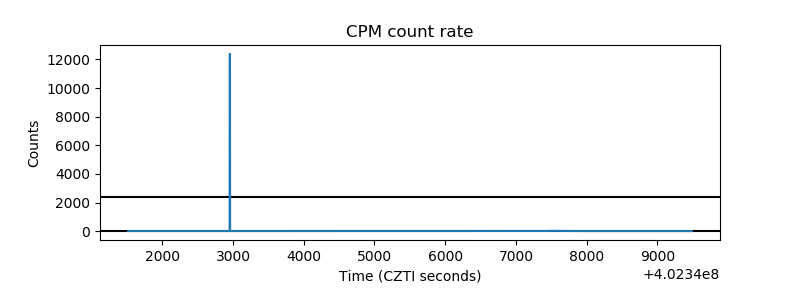 |
| CZT Counter | 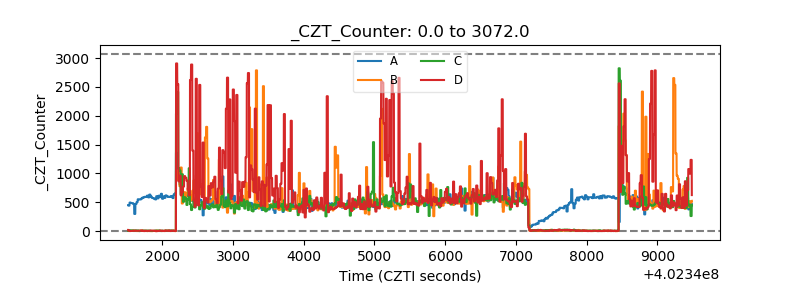 |
| +2.5 Volts monitor | 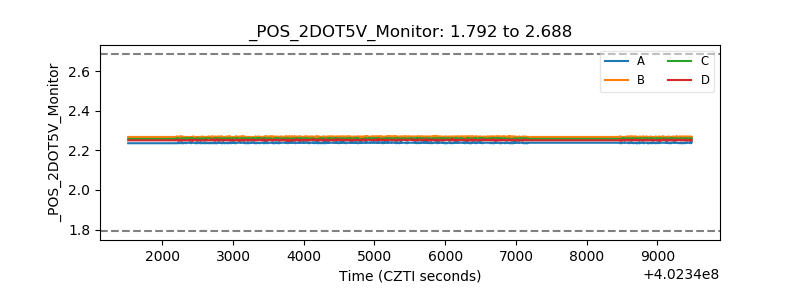 |
| +5 Volts monitor |  |
| _ROLL_ROT | 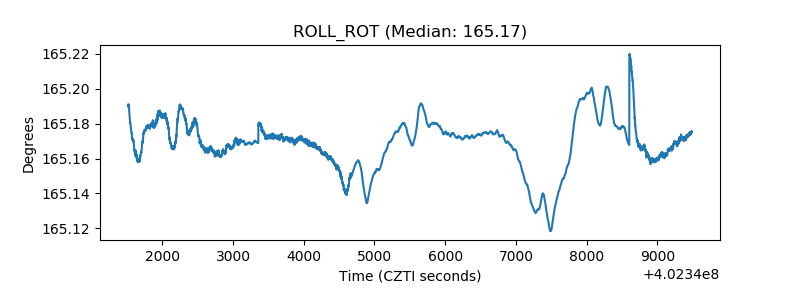 |
| _Roll_DEC | 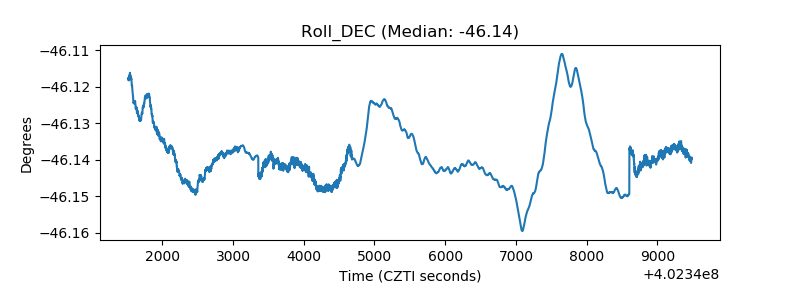 |
| _Roll_RA | 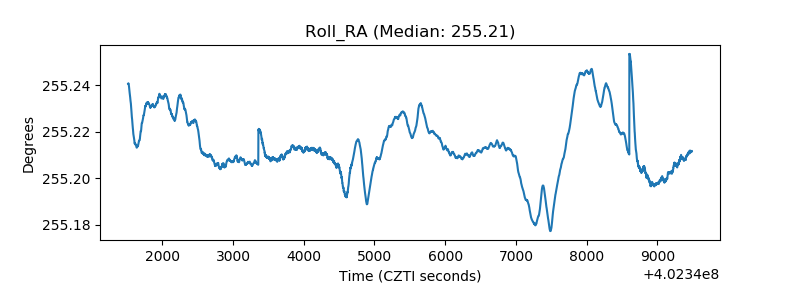 |
| Veto Counter | 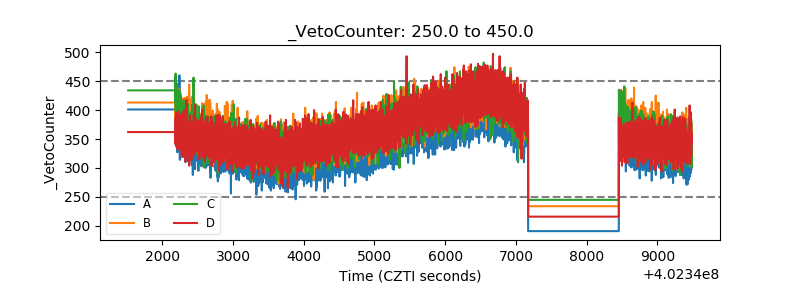 |