| Param | Original file | Final file |
|---|---|---|
| Filename | modeM0/AS1T05_059T01_9000005354_37905cztM0_level2.evt | modeM0/AS1T05_059T01_9000005354_37905cztM0_level2_quad_clean.evt |
| Size (bytes) | 886,340,160 | 126,149,760 |
| Size | 845.3 MB | 120.3 MB |
| Events in quadrant A | 6,117,454 | 777,455 |
| Events in quadrant B | 6,309,016 | 779,511 |
| Events in quadrant C | 5,586,594 | 785,744 |
| Events in quadrant D | 8,102,724 | 732,283 |
| Mode M0 | |||
|---|---|---|---|
| Quadrant | BADHDUFLAG | Total packets | Discarded packets |
| A | 0 | 24818 | 4 |
| B | 0 | 25969 | 3 |
| C | 0 | 23208 | 3 |
| D | 0 | 31475 | 3 |
| Mode SS | |||
|---|---|---|---|
| Quadrant | BADHDUFLAG | Total packets | Discarded packets |
| A | 0 | 218 | 0 |
| B | 0 | 218 | 0 |
| C | 0 | 218 | 0 |
| D | 0 | 218 | 0 |
| Mode M9 | |||
|---|---|---|---|
| Quadrant | BADHDUFLAG | Total packets | Discarded packets |
| A | 0 | 28 | 0 |
| B | 0 | 28 | 0 |
| C | 0 | 28 | 0 |
| D | 0 | 29 | 0 |
| Quadrant | Total seconds | Saturated seconds | Saturation percentage |
|---|---|---|---|
| A | 10766 | 73 | 0.678061% |
| B | 10766 | 304 | 2.823704% |
| C | 10766 | 82 | 0.761657% |
| D | 10766 | 528 | 4.904328% |
Noise dominated data is calculated using 1-second bins in cleaned event files. If a bin has >2000 counts, and if more than 50% of those come from <1% of pixels, then it is considered to be noise-dominated and hence unusable.
| Quadrant | # 1 sec bins | Bins with >0 counts | Bins with >2000 counts | High rate bins dominated by noise | Noise dominated (total time) | Noise dominated (detector-on time) | Marked lightcurve |
|---|---|---|---|---|---|---|---|
| A | 13542 | 10768 | 61 | 61 | 0.45% | 0.57% | 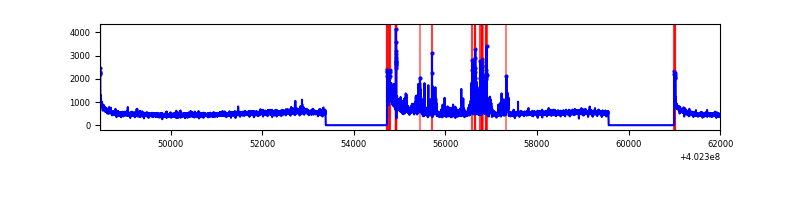 |
| B | 13542 | 10768 | 204 | 204 | 1.51% | 1.89% | 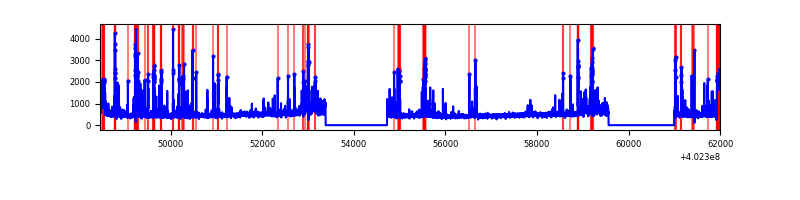 |
| C | 13542 | 10768 | 64 | 64 | 0.47% | 0.59% | 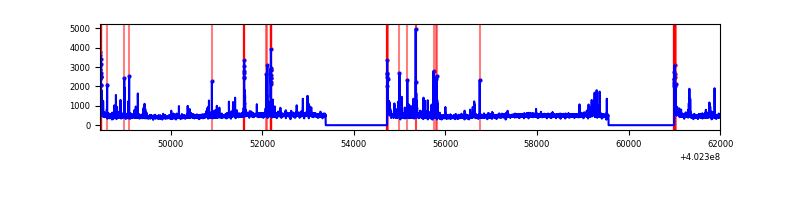 |
| D | 13542 | 10768 | 405 | 405 | 2.99% | 3.76% | 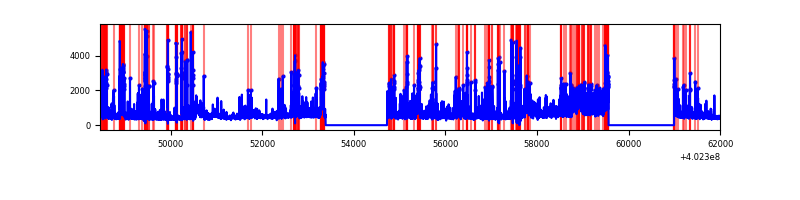 |
Top three noisy pixels from each quadrant. If the there are fewer than three noisy pixels in the level2.evt file, extra rows are filled as -1
| Pixel properties | Quadrant properties | ||||||
|---|---|---|---|---|---|---|---|
| Quadrant | DetID | PixID | Counts | Sigma | Mean | Median | Sigma |
| A | 15 | 222 | 713454 | 2917.14 | 1204 | 1180 | 244.2 |
| A | 10 | 83 | 648214 | 2649.94 | 1204 | 1180 | 244.2 |
| A | 13 | 6 | 43317 | 172.57 | 1204 | 1180 | 244.2 |
| B | 5 | 172 | 752185 | 3293.26 | 1194 | 1161 | 228.0 |
| B | 4 | 232 | 181803 | 792.12 | 1194 | 1161 | 228.0 |
| B | 0 | 189 | 180823 | 787.82 | 1194 | 1161 | 228.0 |
| C | 15 | 214 | 447988 | 1639.98 | 1172 | 1179 | 272.4 |
| C | 14 | 254 | 208419 | 760.66 | 1172 | 1179 | 272.4 |
| C | 0 | 10 | 153411 | 558.76 | 1172 | 1179 | 272.4 |
| D | 1 | 52 | 1213108 | 4338.69 | 1150 | 1119 | 279.3 |
| D | 7 | 223 | 1041500 | 3724.36 | 1150 | 1119 | 279.3 |
| D | 2 | 249 | 440315 | 1572.24 | 1150 | 1119 | 279.3 |
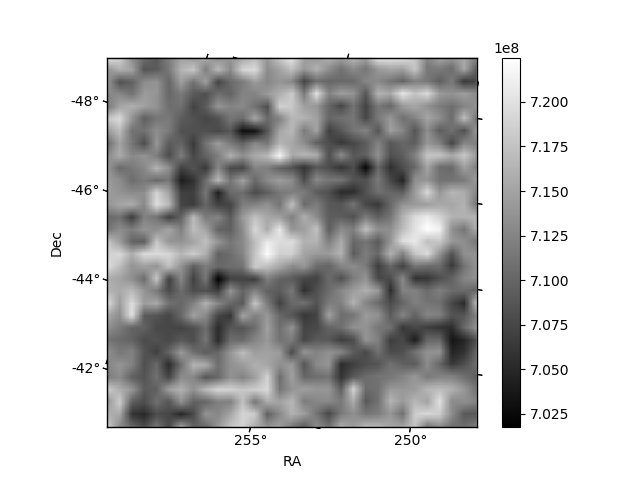
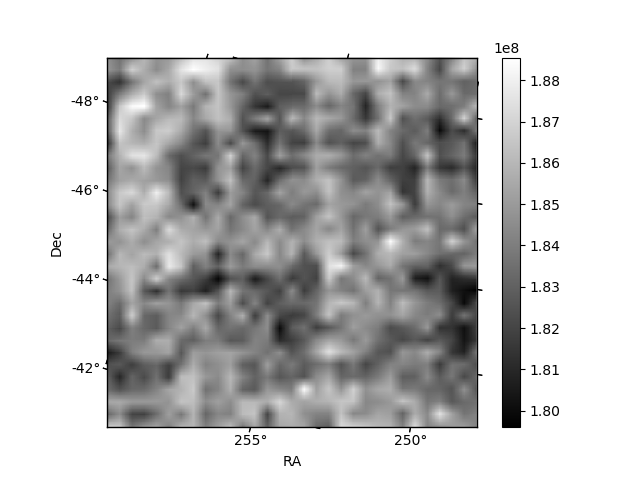
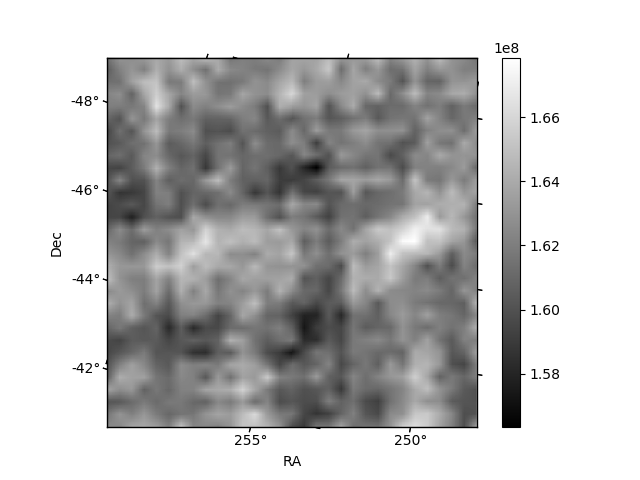
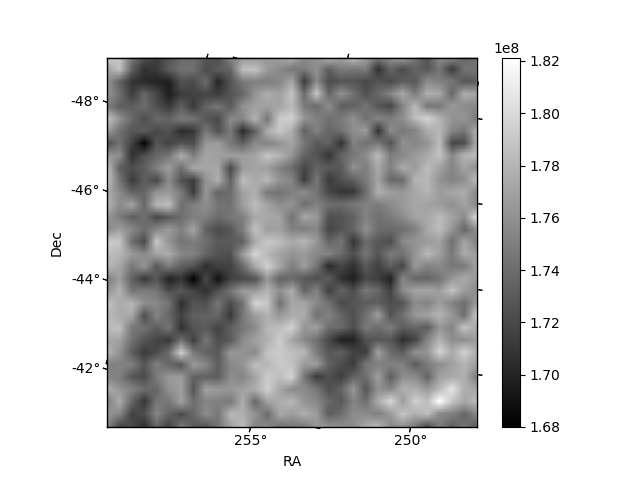
Histogram calculated using DETX and DETY for each event in the final _common_clean file
| Quadrant A | 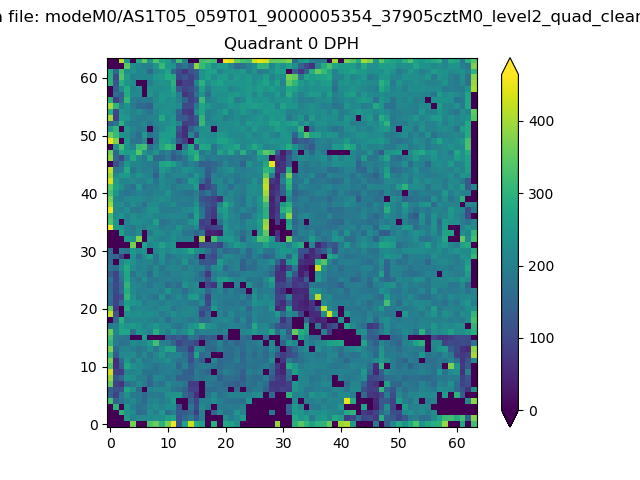 |
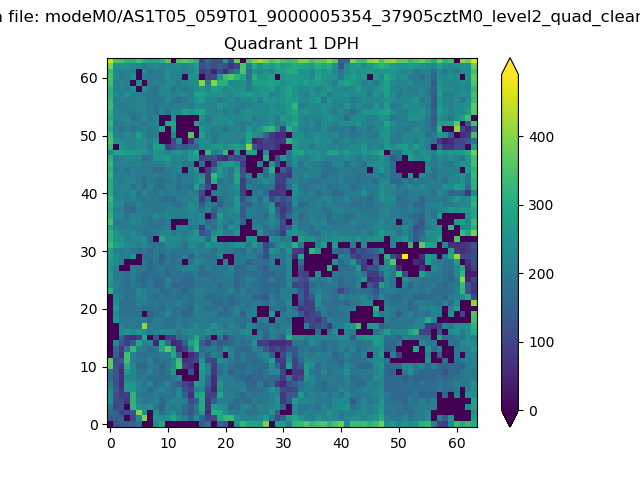 |
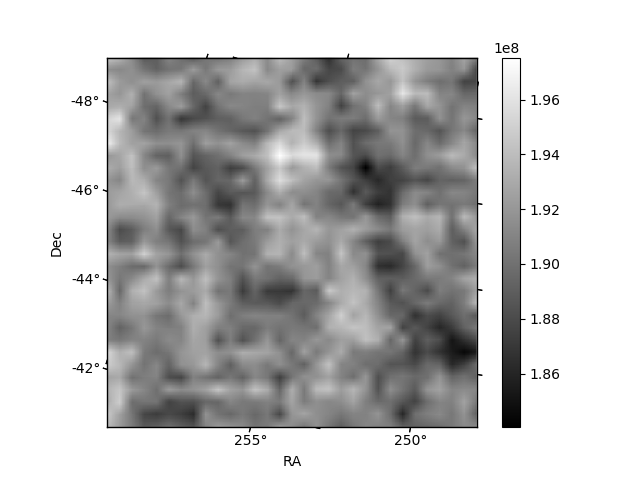
Quadrant B |
|---|---|---|---|
| Quadrant D | 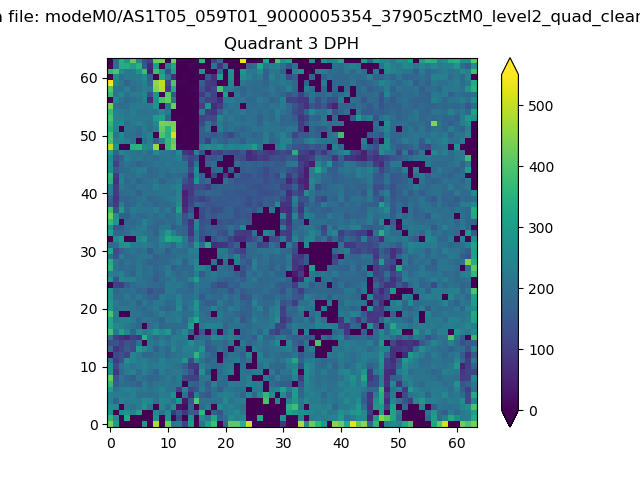 |
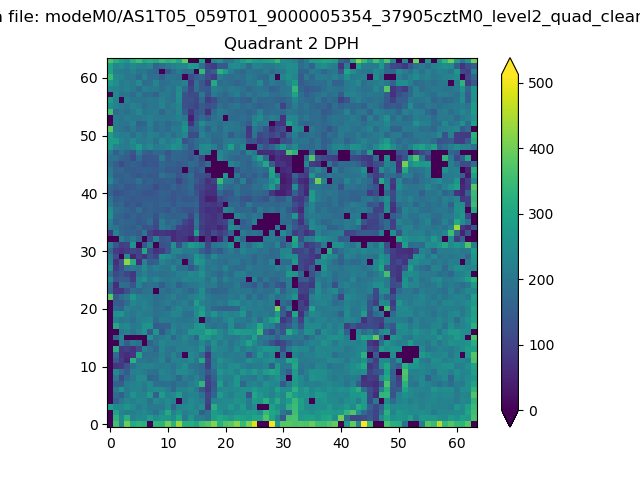 |
Quadrant C |
| Plot type | Count rate plots | Images |
|---|---|---|
| Comparison with Poisson distribution Blue bars denote a histogram of data divided into 1 sec bins. Red curve is a Poisson curve with rate = median count rate of data. |
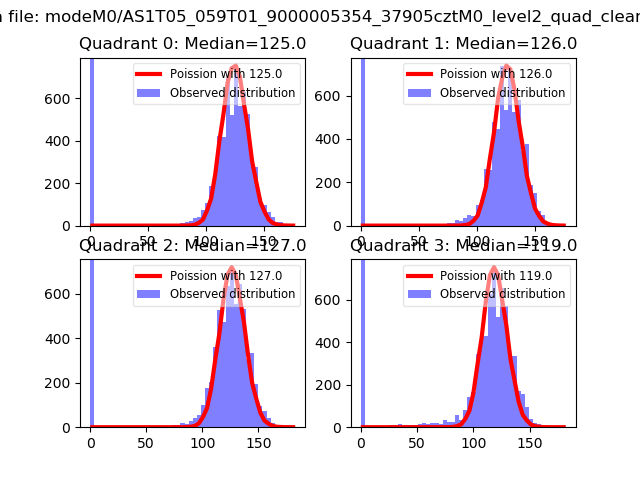 |
 |
| Quadrant-wise count rates Data is divided into 100 sec bins |
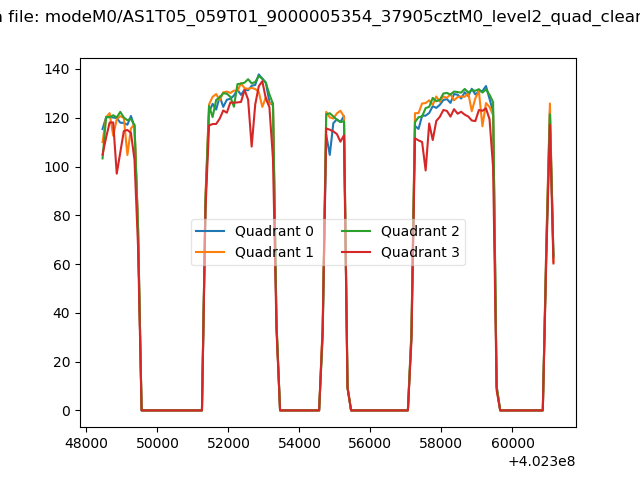 |
|
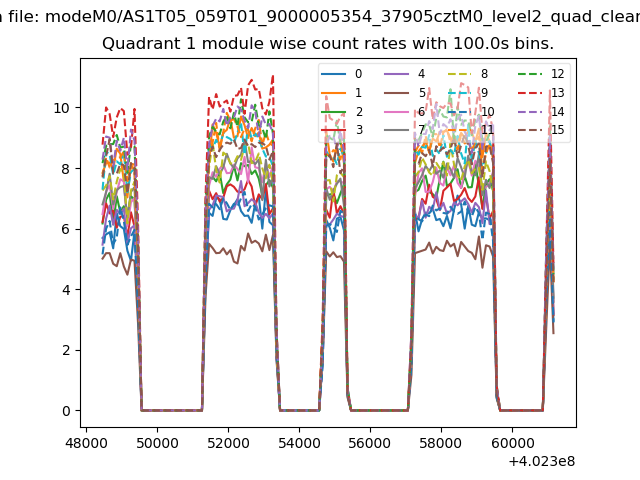
| Module-wise count rates for Quadrant A Data is divided into 100 sec bins |
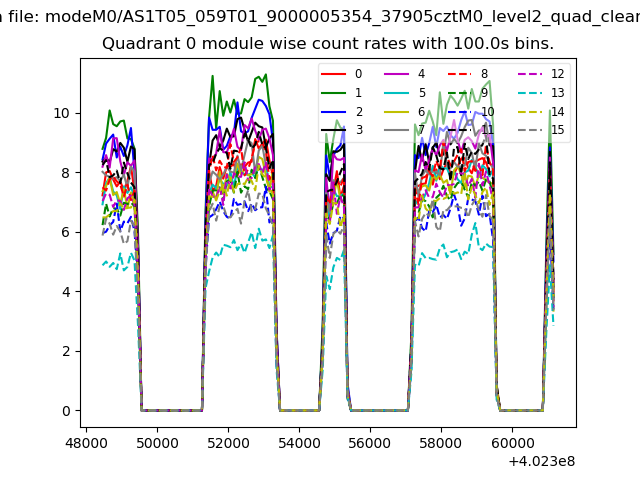 |
 |
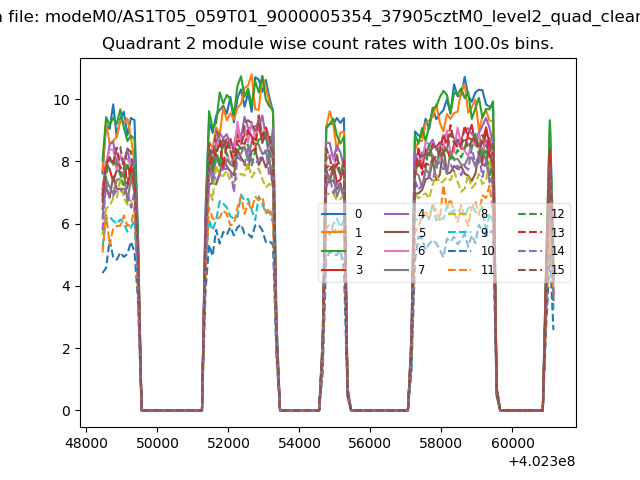
| Module-wise count rates for Quadrant B Data is divided into 100 sec bins |
 |
 |
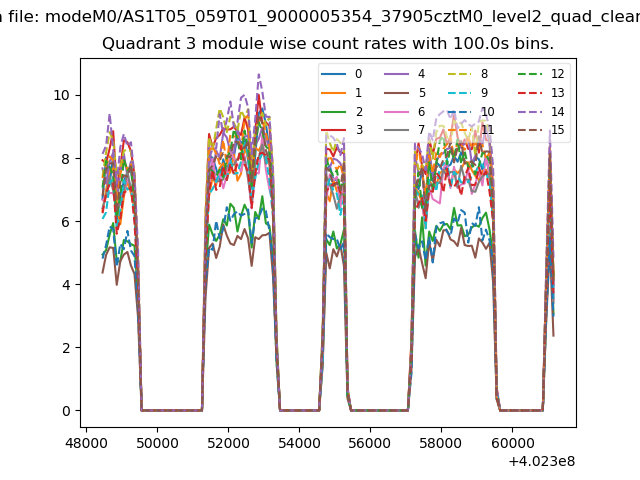
| Module-wise count rates for Quadrant C Data is divided into 100 sec bins |
 |
 |
| Module-wise count rates for Quadrant D Data is divided into 100 sec bins |
 |
 |
| Parameter | Plot |
|---|---|
| CZT HV Monitor | 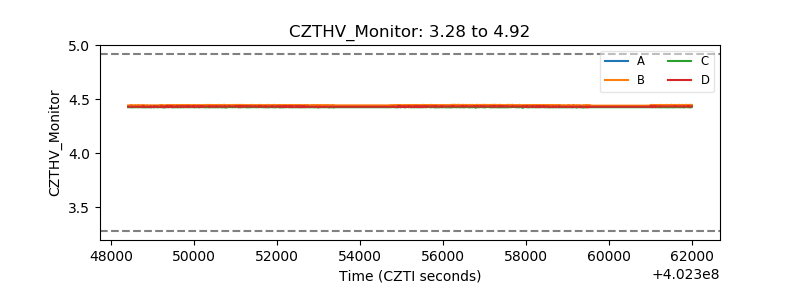 |
| D_VDD | 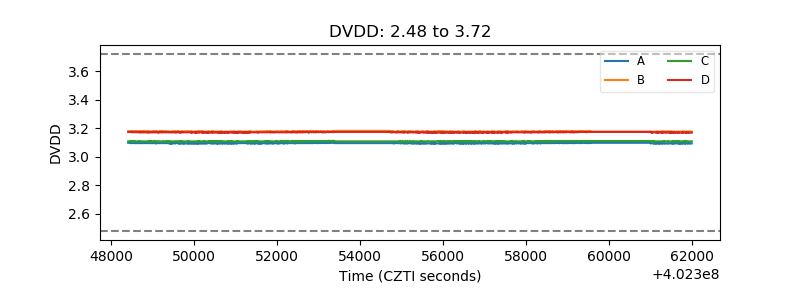 |
| Temperature 1 | 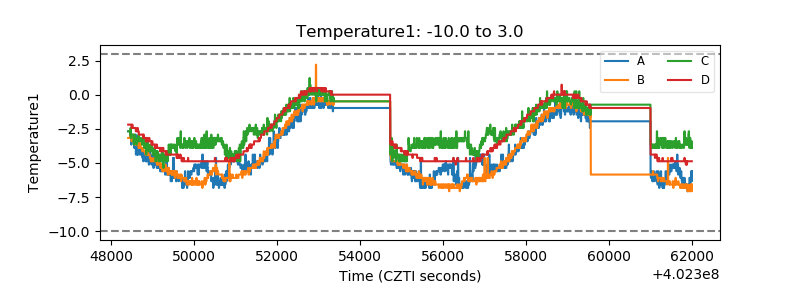 |
| Veto HV Monitor | 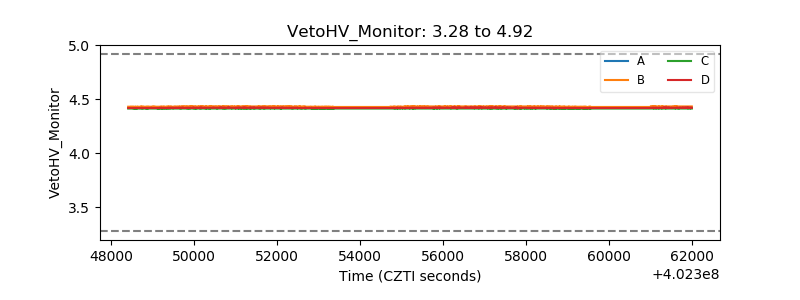 |
| Veto LLD | 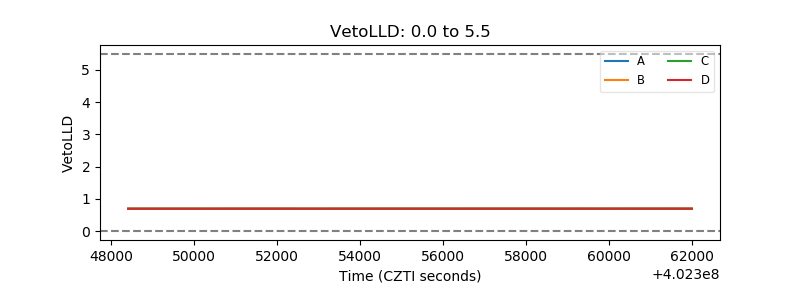 |
| Alpha Counter | 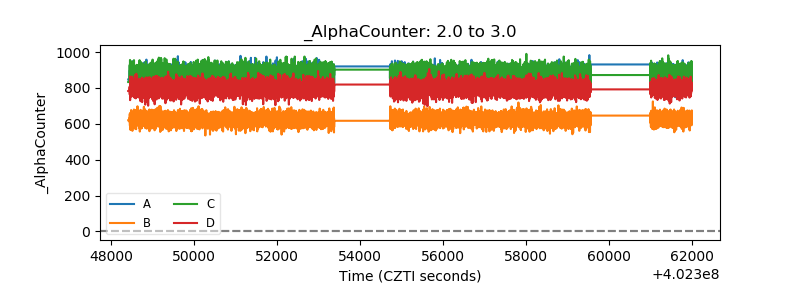 |
| _CPM_Rate | 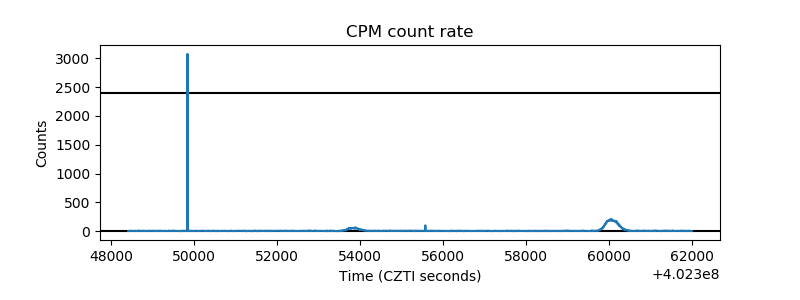 |
| CZT Counter | 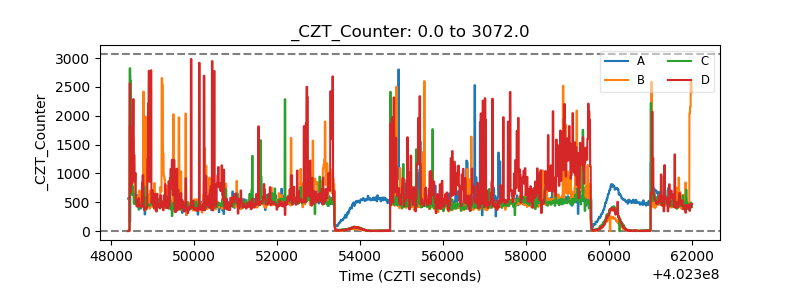 |
| +2.5 Volts monitor | 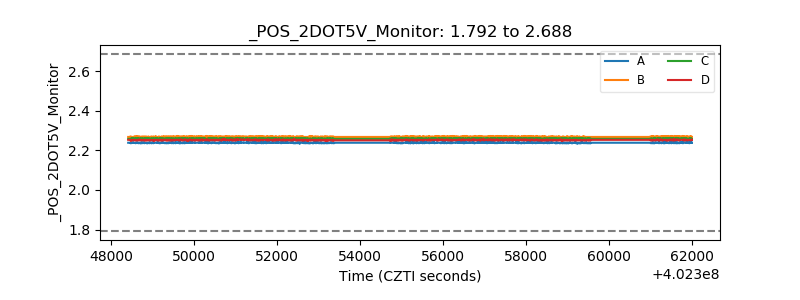 |
| +5 Volts monitor |  |
| _ROLL_ROT | 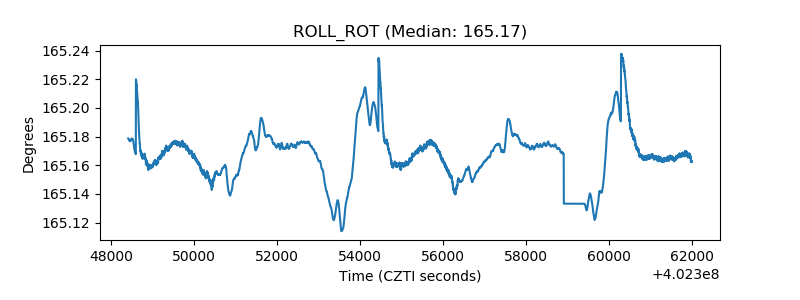 |
| _Roll_DEC | 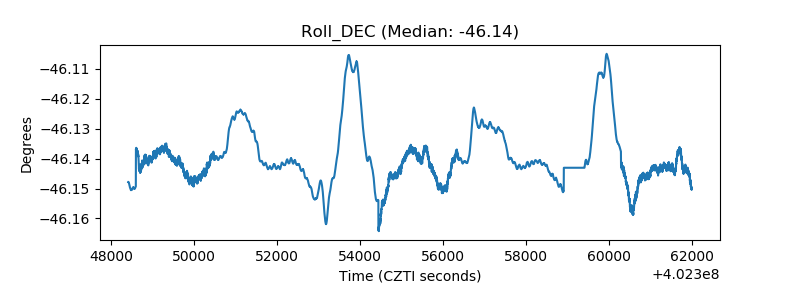 |
| _Roll_RA | 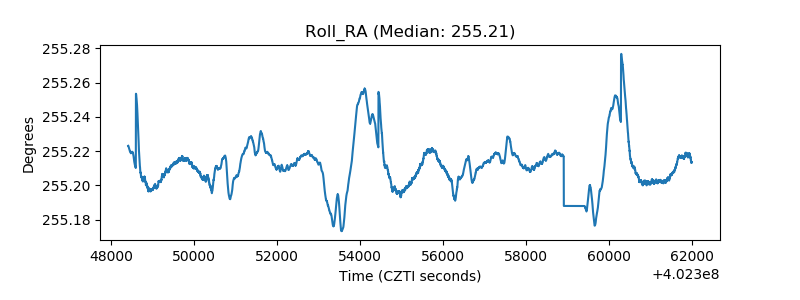 |
| Veto Counter | 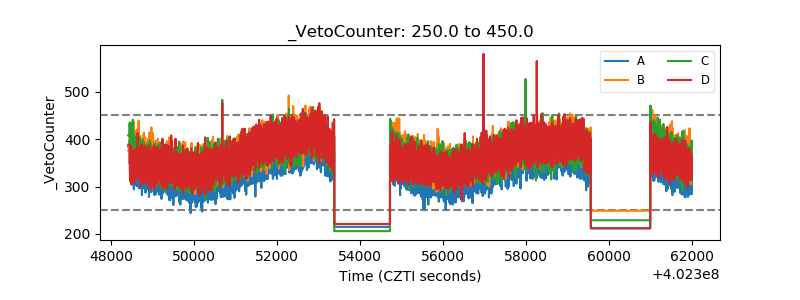 |