| Param | Original file | Final file |
|---|---|---|
| Filename | modeM0/AS1T05_059T01_9000005354_37906cztM0_level2.evt | modeM0/AS1T05_059T01_9000005354_37906cztM0_level2_quad_clean.evt |
| Size (bytes) | 611,366,400 | 56,448,000 |
| Size | 583.0 MB | 53.8 MB |
| Events in quadrant A | 5,823,663 | 239,157 |
| Events in quadrant B | 3,980,845 | 359,313 |
| Events in quadrant C | 3,052,553 | 375,093 |
| Events in quadrant D | 5,258,879 | 322,195 |
| Mode M0 | |||
|---|---|---|---|
| Quadrant | BADHDUFLAG | Total packets | Discarded packets |
| A | 0 | 21083 | 3 |
| B | 0 | 15747 | 2 |
| C | 0 | 12667 | 2 |
| D | 0 | 19637 | 2 |
| Mode SS | |||
|---|---|---|---|
| Quadrant | BADHDUFLAG | Total packets | Discarded packets |
| A | 0 | 122 | 0 |
| B | 0 | 122 | 0 |
| C | 0 | 122 | 0 |
| D | 0 | 122 | 0 |
| Mode M9 | |||
|---|---|---|---|
| Quadrant | BADHDUFLAG | Total packets | Discarded packets |
| A | 0 | 30 | 0 |
| B | 0 | 30 | 0 |
| C | 0 | 30 | 0 |
| D | 0 | 30 | 0 |
| Quadrant | Total seconds | Saturated seconds | Saturation percentage |
|---|---|---|---|
| A | 5898 | 1322 | 22.414378% |
| B | 5898 | 385 | 6.527636% |
| C | 5898 | 44 | 0.746016% |
| D | 5898 | 646 | 10.952865% |
Noise dominated data is calculated using 1-second bins in cleaned event files. If a bin has >2000 counts, and if more than 50% of those come from <1% of pixels, then it is considered to be noise-dominated and hence unusable.
| Quadrant | # 1 sec bins | Bins with >0 counts | Bins with >2000 counts | High rate bins dominated by noise | Noise dominated (total time) | Noise dominated (detector-on time) | Marked lightcurve |
|---|---|---|---|---|---|---|---|
| A | 8884 | 5900 | 1238 | 1238 | 13.94% | 20.98% | 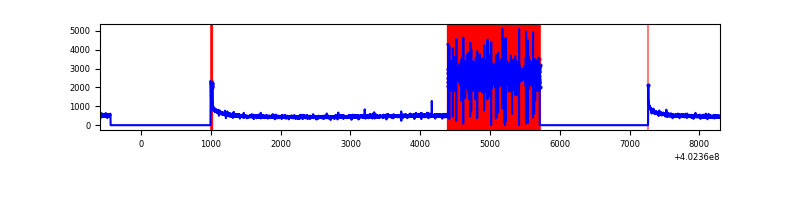 |
| B | 8884 | 5900 | 263 | 263 | 2.96% | 4.46% | 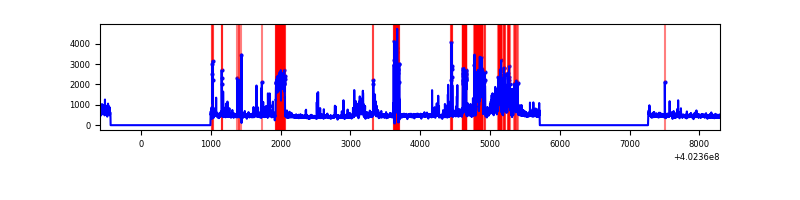 |
| C | 8884 | 5900 | 36 | 36 | 0.41% | 0.61% | 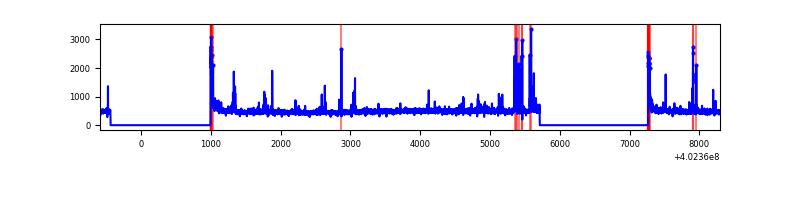 |
| D | 8884 | 5900 | 515 | 515 | 5.80% | 8.73% | 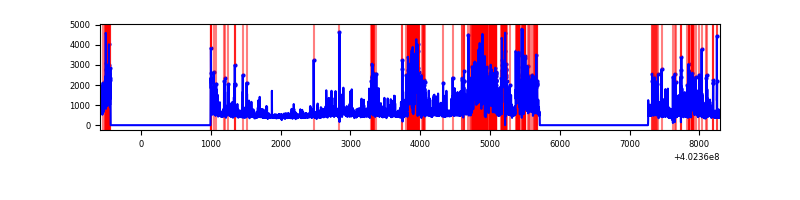 |
Top three noisy pixels from each quadrant. If the there are fewer than three noisy pixels in the level2.evt file, extra rows are filled as -1
| Pixel properties | Quadrant properties | ||||||
|---|---|---|---|---|---|---|---|
| Quadrant | DetID | PixID | Counts | Sigma | Mean | Median | Sigma |
| A | 15 | 222 | 3335485 | 29938.3 | 550 | 538 | 111.4 |
| A | 10 | 83 | 327842 | 2938.26 | 550 | 538 | 111.4 |
| A | 13 | 6 | 11860 | 101.64 | 550 | 538 | 111.4 |
| B | 5 | 172 | 360127 | 2878.49 | 644 | 628 | 124.9 |
| B | 4 | 81 | 348435 | 2784.88 | 644 | 628 | 124.9 |
| B | 5 | 184 | 295355 | 2359.87 | 644 | 628 | 124.9 |
| C | 15 | 214 | 247326 | 1627.44 | 642 | 646 | 151.6 |
| C | 14 | 254 | 180385 | 1185.81 | 642 | 646 | 151.6 |
| C | 0 | 10 | 110036 | 721.69 | 642 | 646 | 151.6 |
| D | 2 | 249 | 1439267 | 9656.59 | 610 | 592 | 149.0 |
| D | 1 | 52 | 564701 | 3786.38 | 610 | 592 | 149.0 |
| D | 7 | 223 | 283914 | 1901.7 | 610 | 592 | 149.0 |
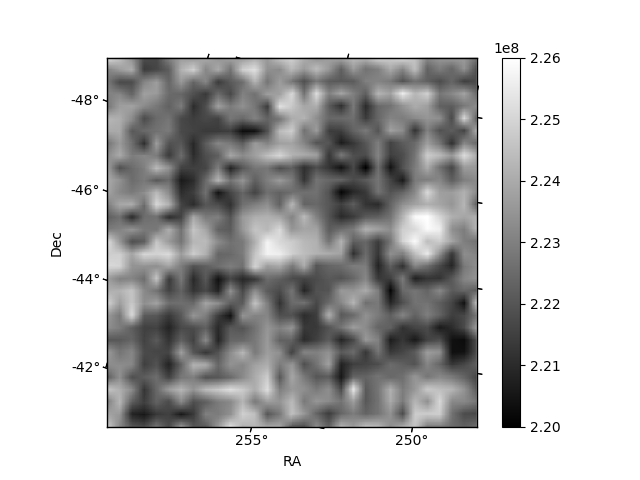
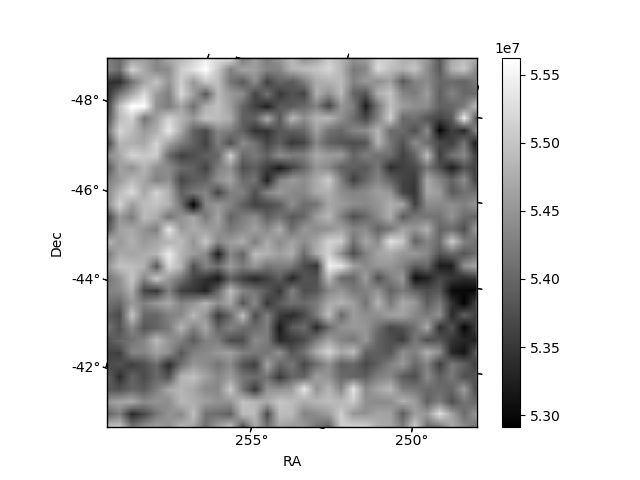
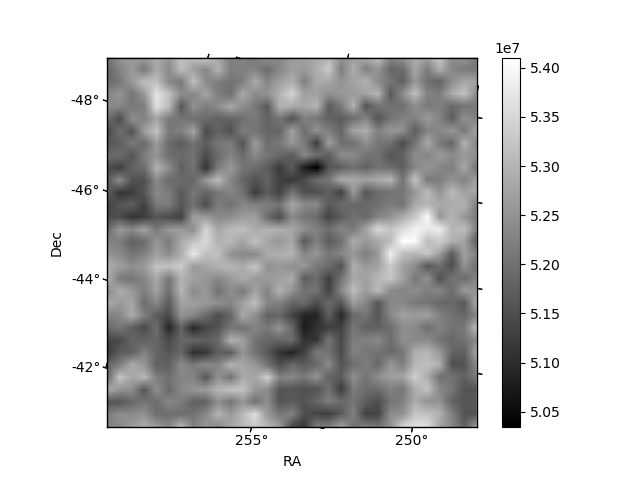
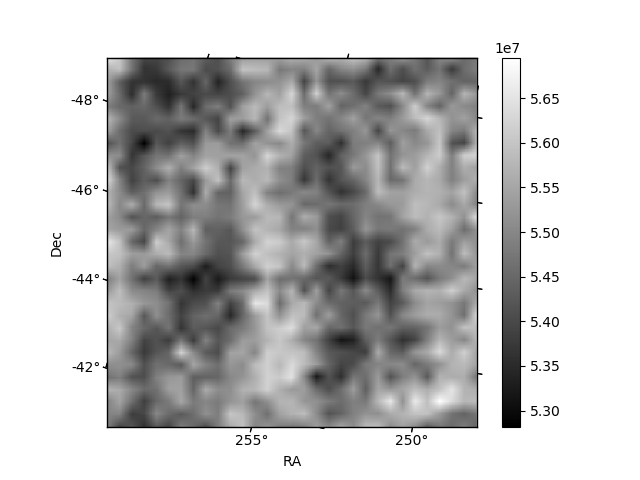
Histogram calculated using DETX and DETY for each event in the final _common_clean file
| Quadrant A | 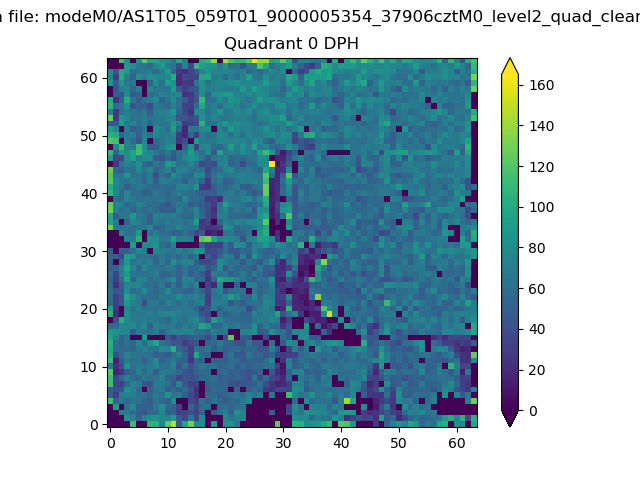 |
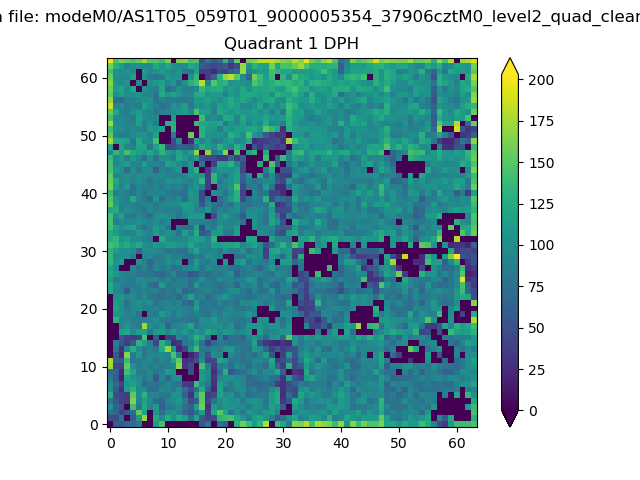 |
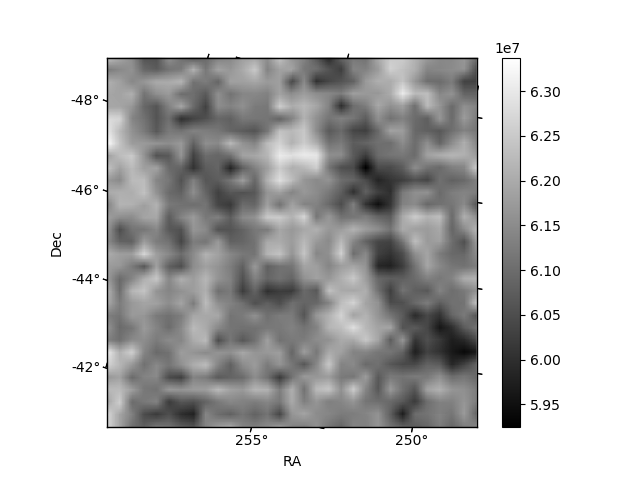
Quadrant B |
|---|---|---|---|
| Quadrant D | 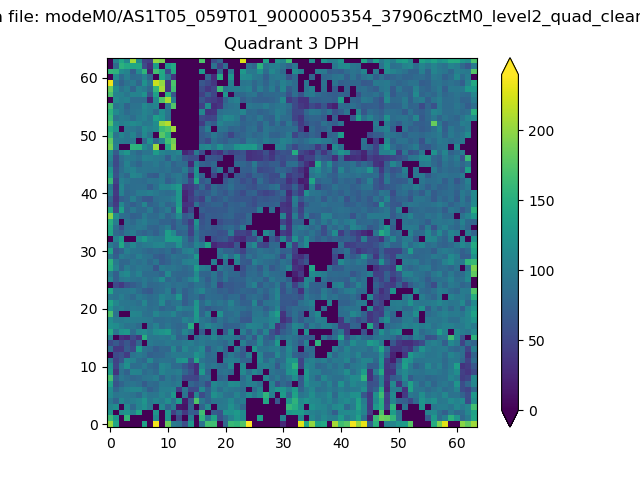 |
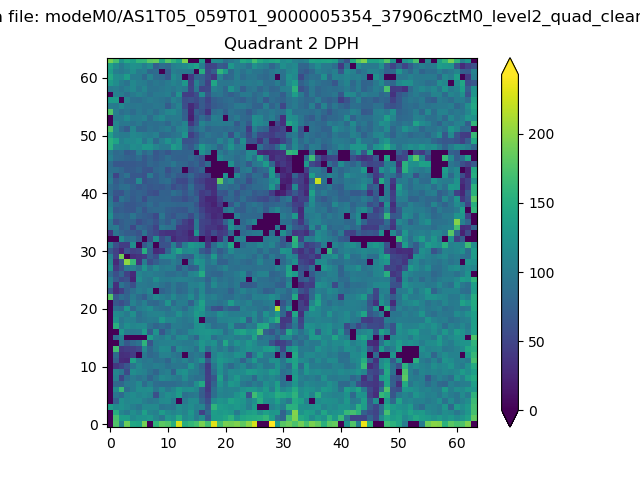 |
Quadrant C |
| Plot type | Count rate plots | Images |
|---|---|---|
| Comparison with Poisson distribution Blue bars denote a histogram of data divided into 1 sec bins. Red curve is a Poisson curve with rate = median count rate of data. |
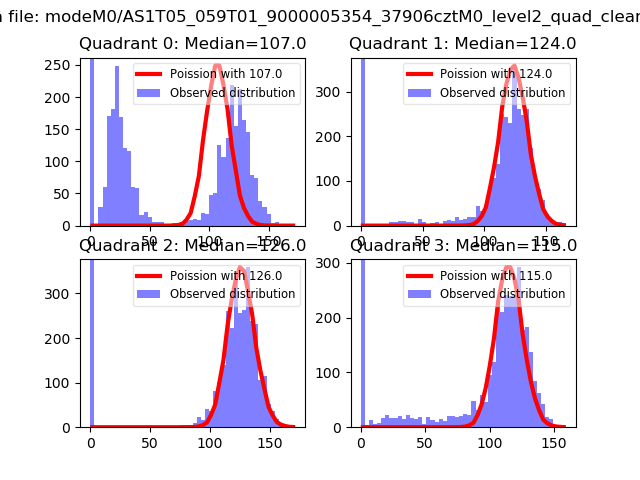 |
 |
| Quadrant-wise count rates Data is divided into 100 sec bins |
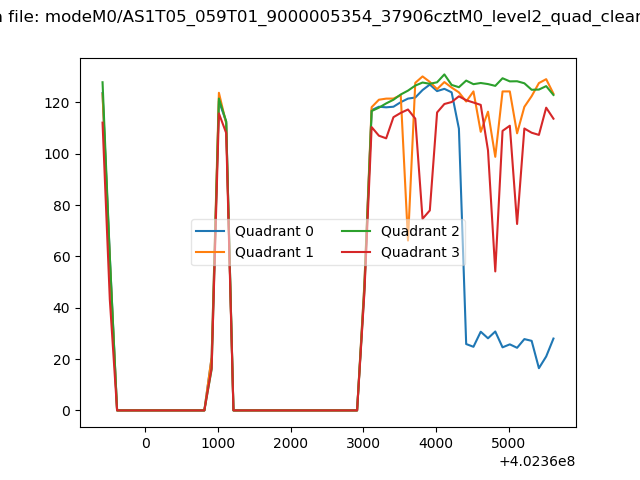 |
|
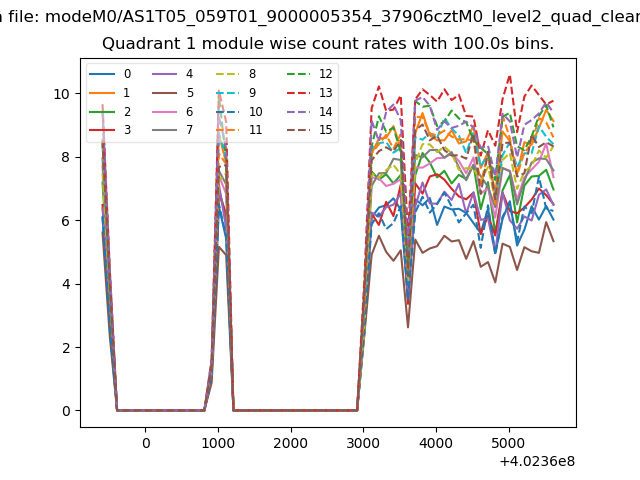
| Module-wise count rates for Quadrant A Data is divided into 100 sec bins |
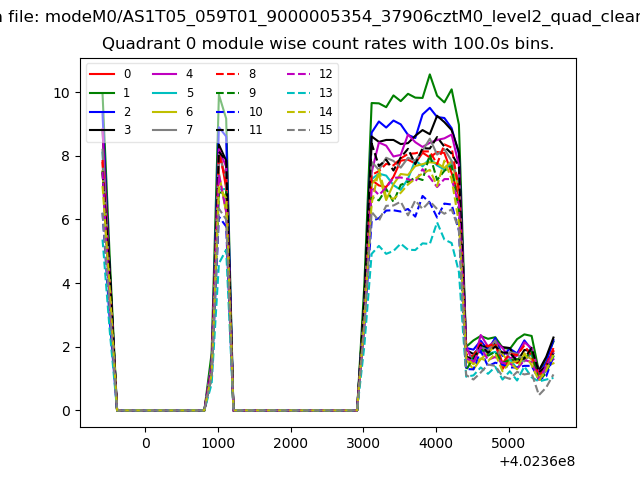 |
 |
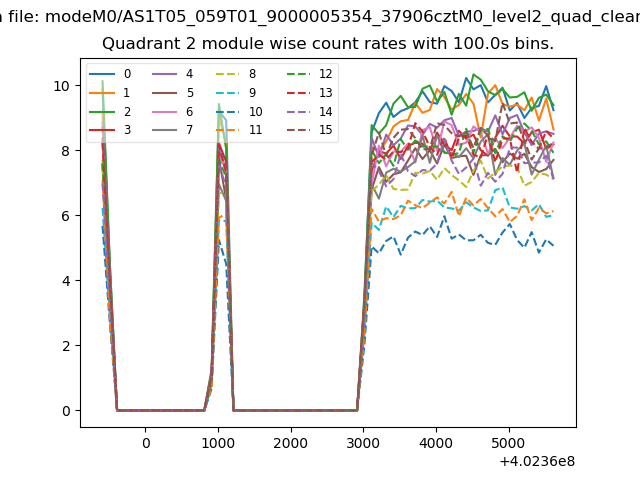
| Module-wise count rates for Quadrant B Data is divided into 100 sec bins |
 |
 |
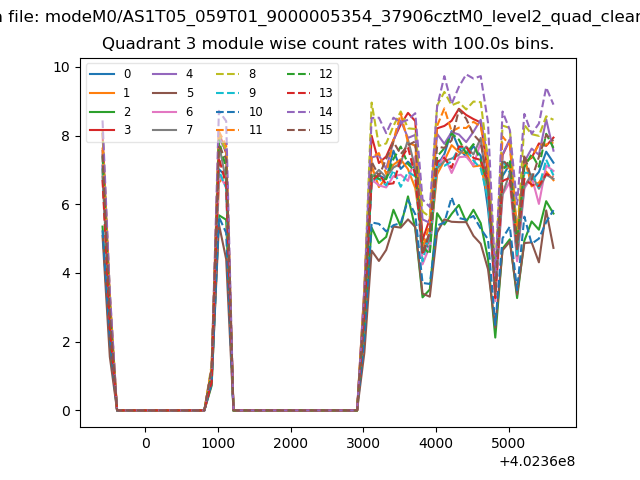
| Module-wise count rates for Quadrant C Data is divided into 100 sec bins |
 |
 |
| Module-wise count rates for Quadrant D Data is divided into 100 sec bins |
 |
 |
| Parameter | Plot |
|---|---|
| CZT HV Monitor | 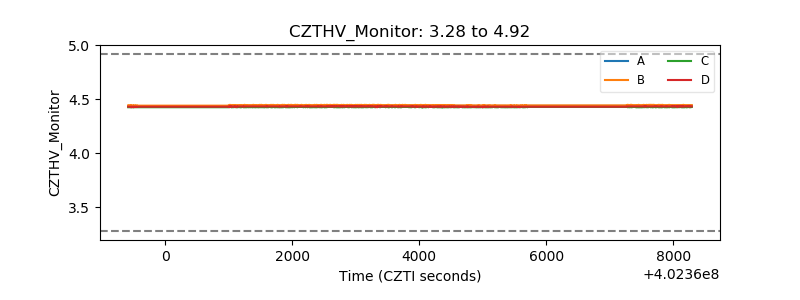 |
| D_VDD | 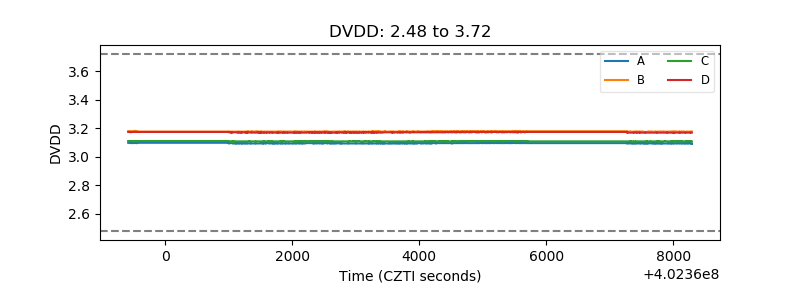 |
| Temperature 1 | 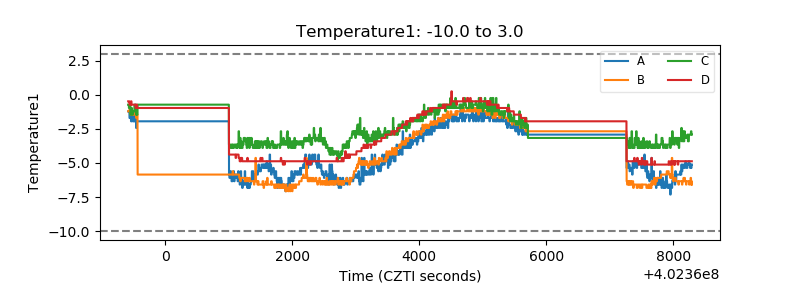 |
| Veto HV Monitor | 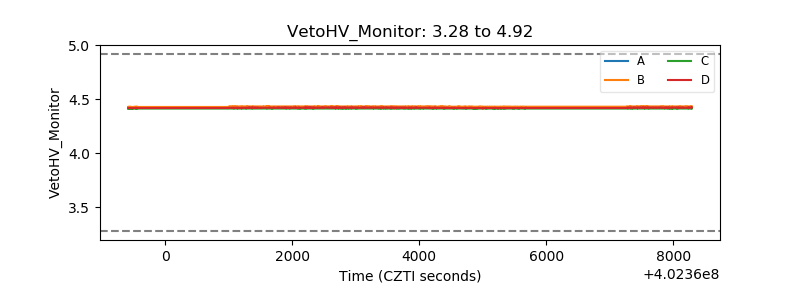 |
| Veto LLD | 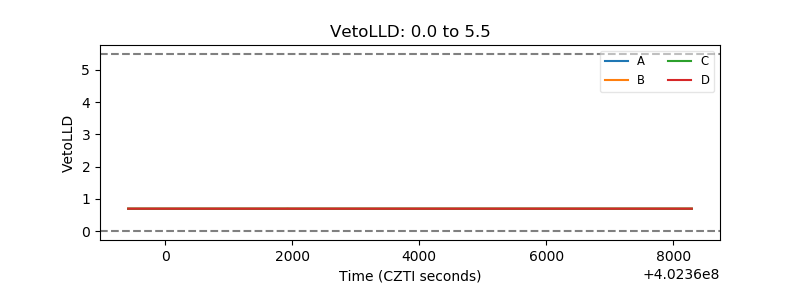 |
| Alpha Counter | 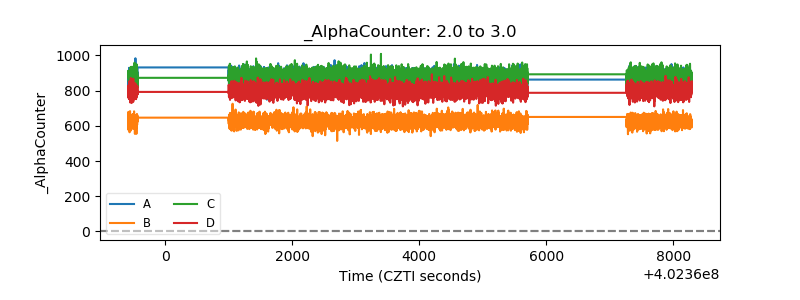 |
| _CPM_Rate | 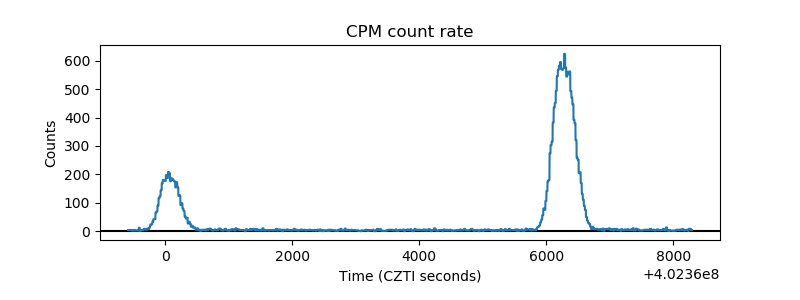 |
| CZT Counter | 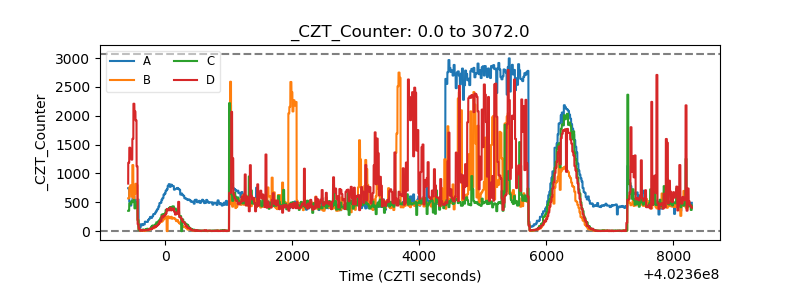 |
| +2.5 Volts monitor | 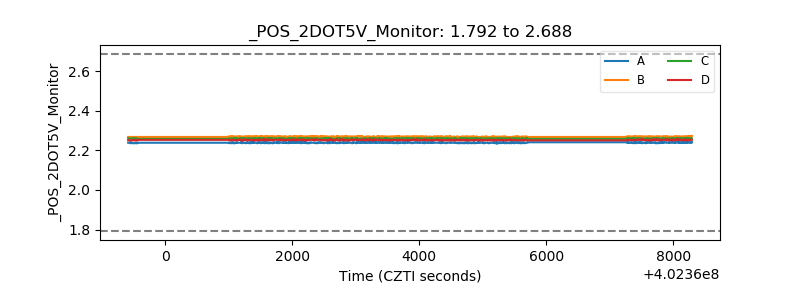 |
| +5 Volts monitor |  |
| _ROLL_ROT | 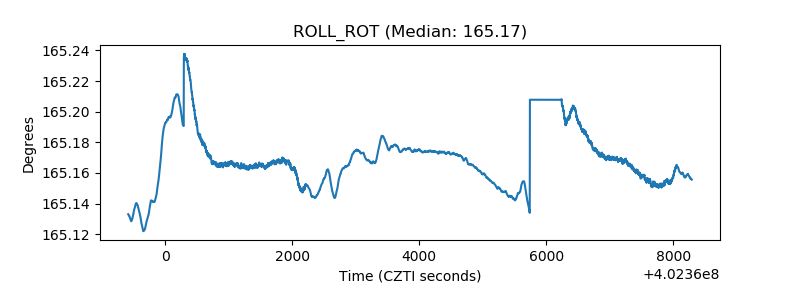 |
| _Roll_DEC | 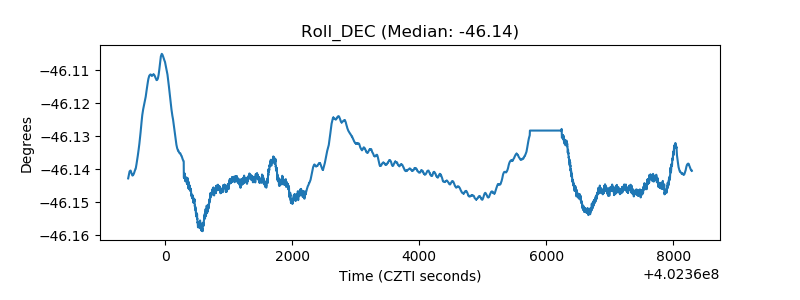 |
| _Roll_RA | 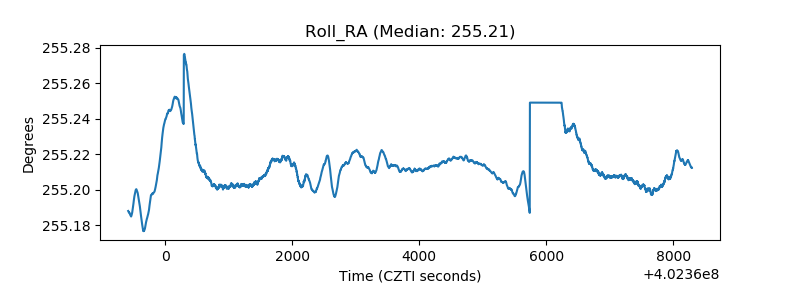 |
| Veto Counter | 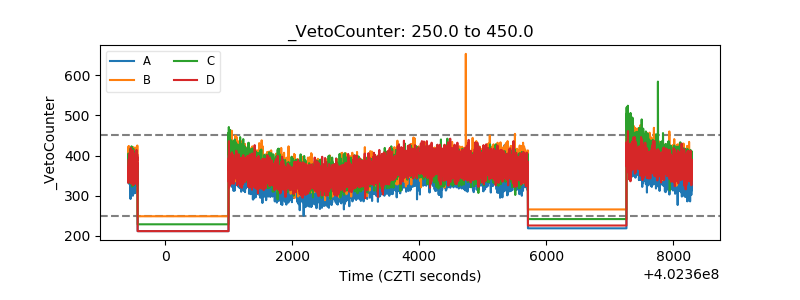 |