| Param | Original file | Final file |
|---|---|---|
| Filename | modeM0/AS1T05_059T01_9000005354_37907cztM0_level2.evt | modeM0/AS1T05_059T01_9000005354_37907cztM0_level2_quad_clean.evt |
| Size (bytes) | 523,488,960 | 56,888,640 |
| Size | 499.2 MB | 54.3 MB |
| Events in quadrant A | 2,845,023 | 362,428 |
| Events in quadrant B | 3,189,521 | 361,937 |
| Events in quadrant C | 2,853,680 | 367,528 |
| Events in quadrant D | 6,590,034 | 242,653 |
| Mode M0 | |||
|---|---|---|---|
| Quadrant | BADHDUFLAG | Total packets | Discarded packets |
| A | 0 | 11698 | 3 |
| B | 0 | 13120 | 2 |
| C | 0 | 11714 | 2 |
| D | 0 | 23357 | 2 |
| Mode SS | |||
|---|---|---|---|
| Quadrant | BADHDUFLAG | Total packets | Discarded packets |
| A | 0 | 112 | 0 |
| B | 0 | 112 | 0 |
| C | 0 | 112 | 0 |
| D | 0 | 112 | 0 |
| Mode M9 | |||
|---|---|---|---|
| Quadrant | BADHDUFLAG | Total packets | Discarded packets |
| A | 0 | 26 | 0 |
| B | 0 | 26 | 0 |
| C | 0 | 26 | 0 |
| D | 0 | 27 | 0 |
| Quadrant | Total seconds | Saturated seconds | Saturation percentage |
|---|---|---|---|
| A | 5533 | 13 | 0.234954% |
| B | 5533 | 109 | 1.969998% |
| C | 5533 | 40 | 0.722935% |
| D | 5533 | 1779 | 32.152539% |
Noise dominated data is calculated using 1-second bins in cleaned event files. If a bin has >2000 counts, and if more than 50% of those come from <1% of pixels, then it is considered to be noise-dominated and hence unusable.
| Quadrant | # 1 sec bins | Bins with >0 counts | Bins with >2000 counts | High rate bins dominated by noise | Noise dominated (total time) | Noise dominated (detector-on time) | Marked lightcurve |
|---|---|---|---|---|---|---|---|
| A | 7235 | 5534 | 4 | 4 | 0.06% | 0.07% | 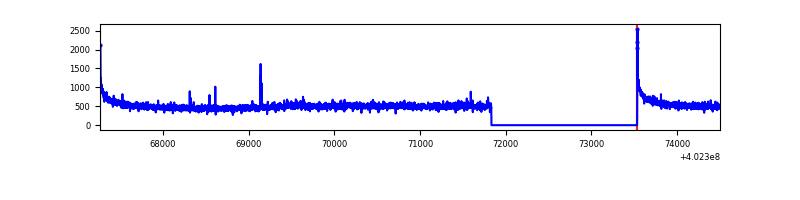 |
| B | 7235 | 5534 | 61 | 61 | 0.84% | 1.10% | 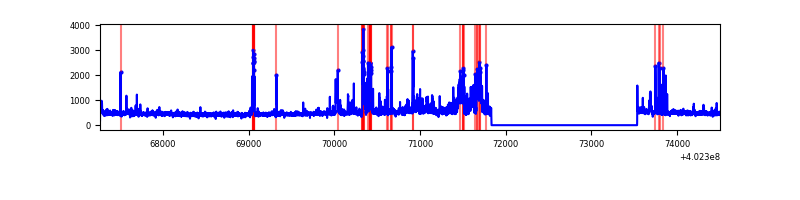 |
| C | 7235 | 5534 | 30 | 30 | 0.41% | 0.54% | 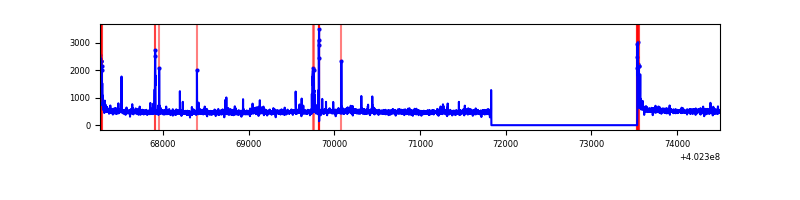 |
| D | 7235 | 5532 | 1004 | 1004 | 13.88% | 18.15% | 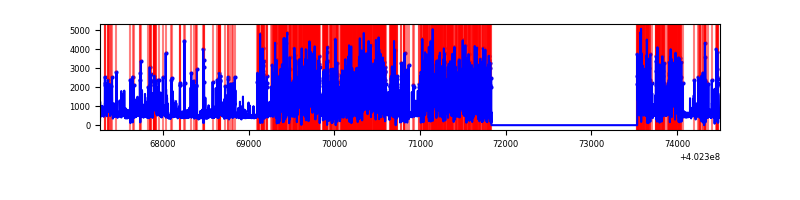 |
Top three noisy pixels from each quadrant. If the there are fewer than three noisy pixels in the level2.evt file, extra rows are filled as -1
| Pixel properties | Quadrant properties | ||||||
|---|---|---|---|---|---|---|---|
| Quadrant | DetID | PixID | Counts | Sigma | Mean | Median | Sigma |
| A | 10 | 83 | 354750 | 2807.99 | 629 | 616 | 126.1 |
| A | 13 | 6 | 25109 | 194.21 | 629 | 616 | 126.1 |
| A | 12 | 189 | 13991 | 106.05 | 629 | 616 | 126.1 |
| B | 4 | 232 | 244937 | 2038.89 | 624 | 607 | 119.8 |
| B | 5 | 172 | 212453 | 1767.81 | 624 | 607 | 119.8 |
| B | 5 | 184 | 142822 | 1186.76 | 624 | 607 | 119.8 |
| C | 15 | 214 | 236929 | 1639.41 | 615 | 617 | 144.1 |
| C | 14 | 254 | 104917 | 723.58 | 615 | 617 | 144.1 |
| C | 0 | 10 | 92345 | 636.36 | 615 | 617 | 144.1 |
| D | 1 | 52 | 2548349 | 20534.17 | 505 | 489 | 124.1 |
| D | 2 | 249 | 1507836 | 12148.28 | 505 | 489 | 124.1 |
| D | 1 | 47 | 219041 | 1761.39 | 505 | 489 | 124.1 |
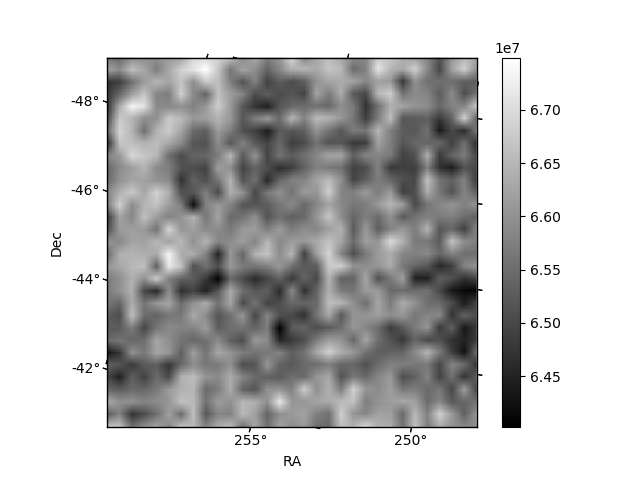
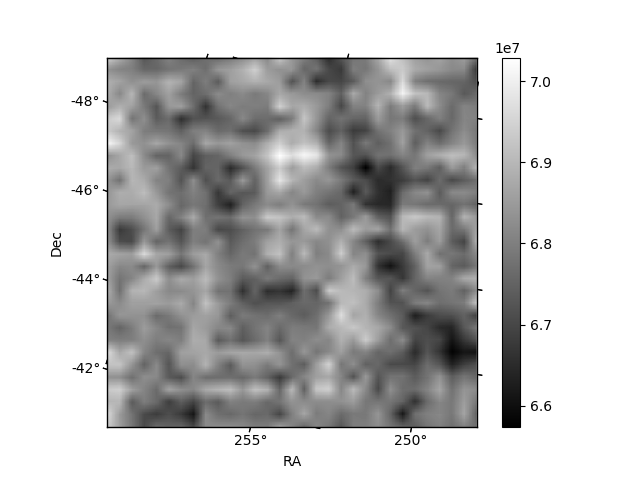
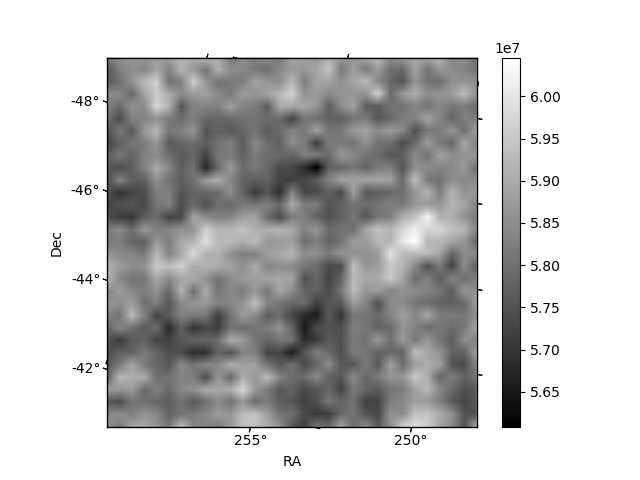
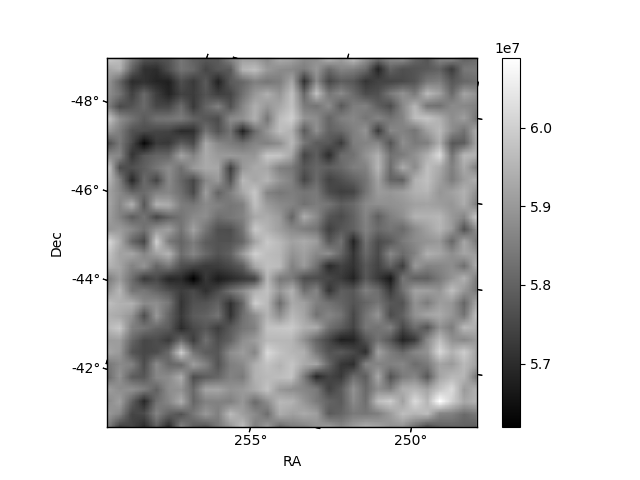
Histogram calculated using DETX and DETY for each event in the final _common_clean file
| Quadrant A | 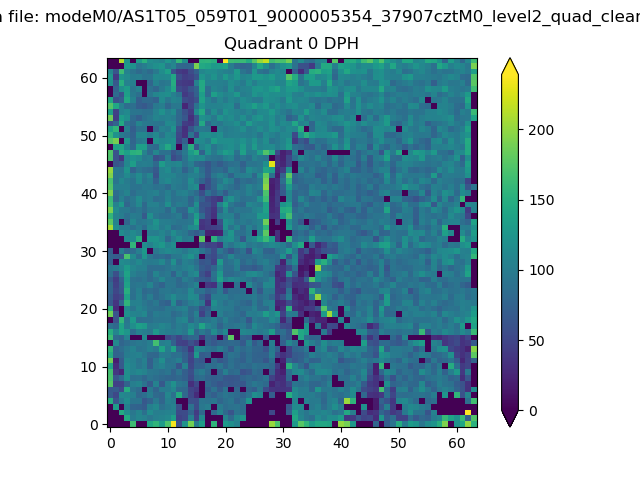 |
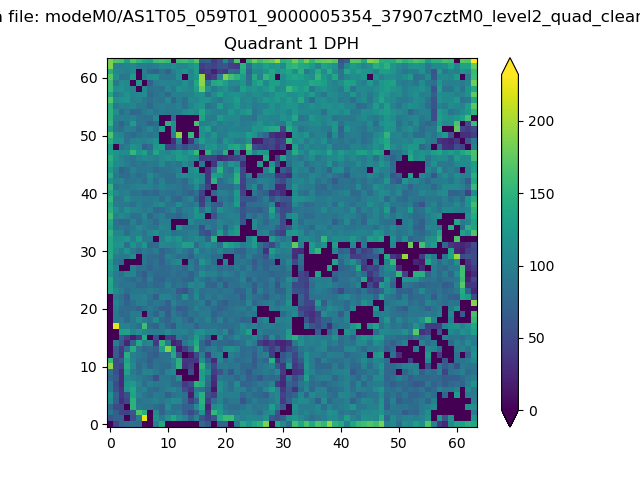 |
Quadrant B |
|---|---|---|---|
| Quadrant D | 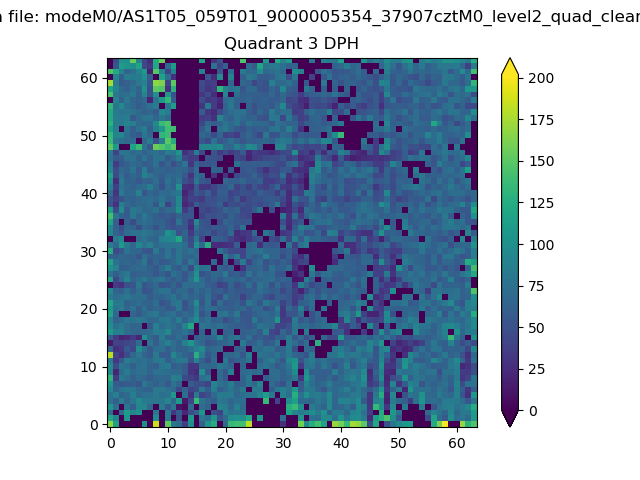 |
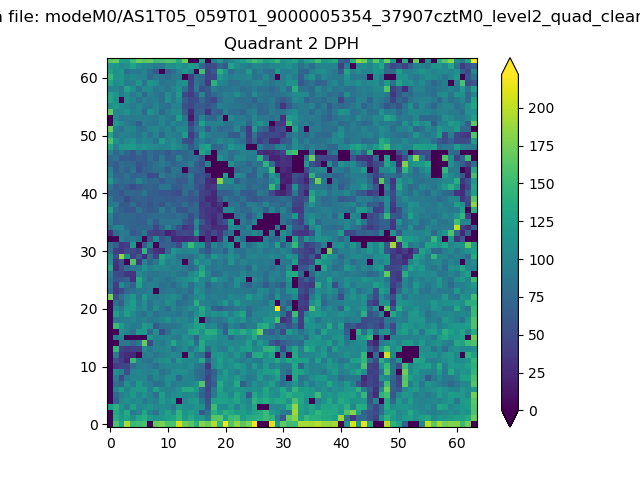 |
Quadrant C |
| Plot type | Count rate plots | Images |
|---|---|---|
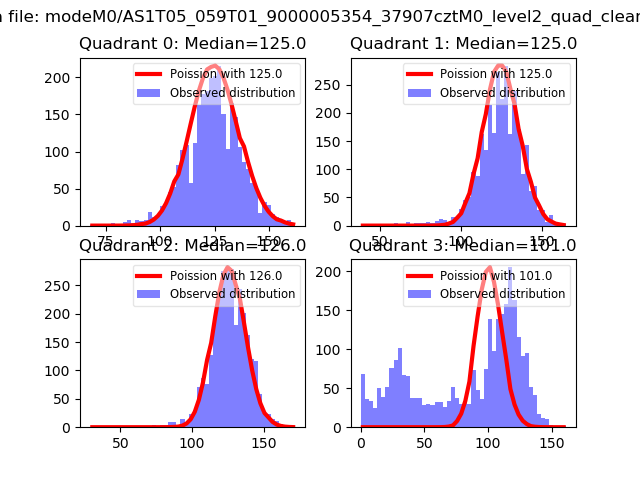
| Comparison with Poisson distribution Blue bars denote a histogram of data divided into 1 sec bins. Red curve is a Poisson curve with rate = median count rate of data. |
 |
 |
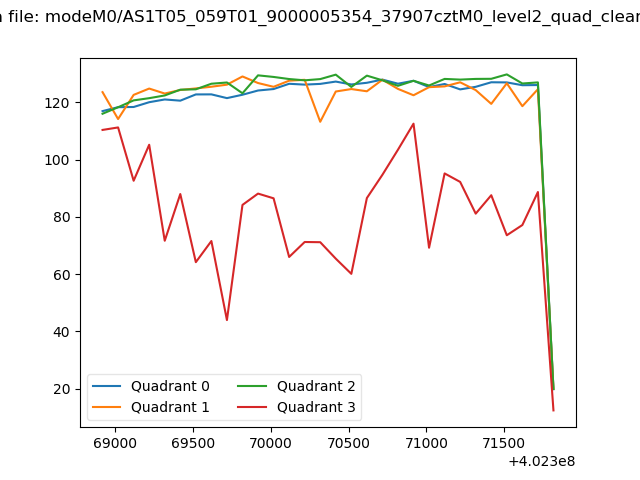
| Quadrant-wise count rates Data is divided into 100 sec bins |
 |
|
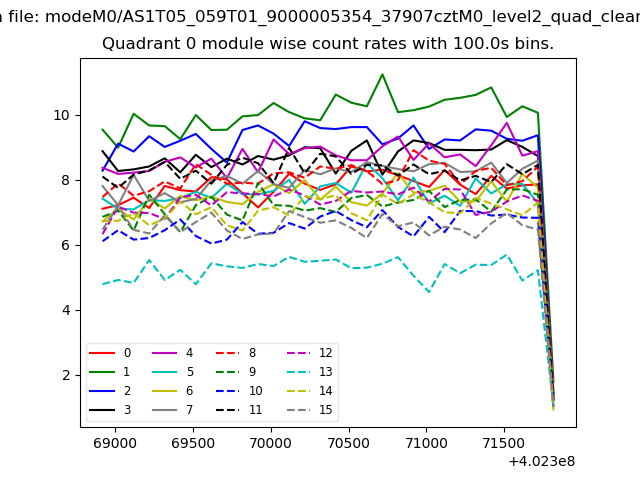
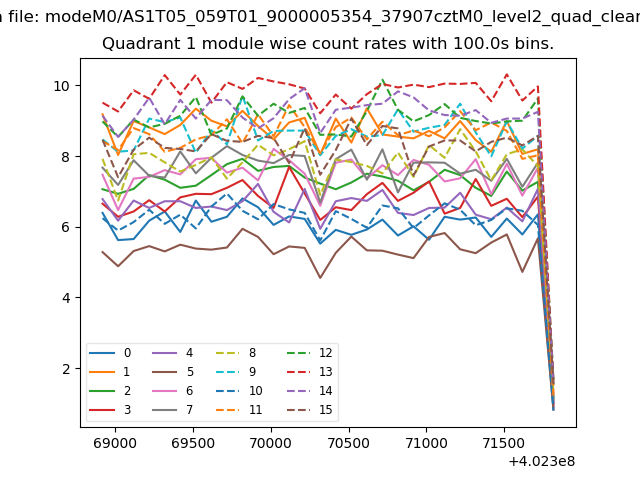
| Module-wise count rates for Quadrant A Data is divided into 100 sec bins |
 |
 |
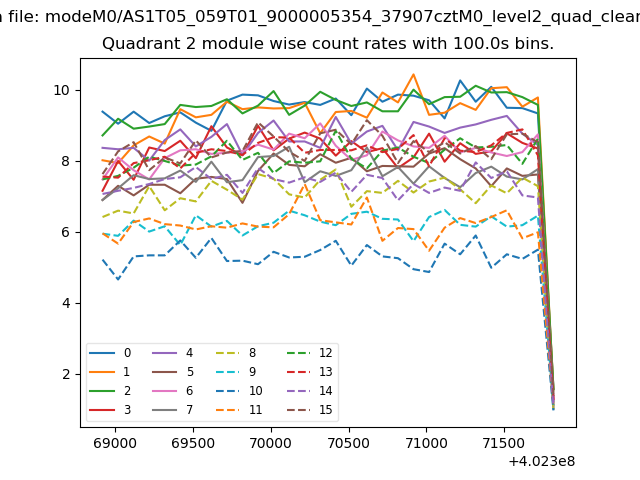
| Module-wise count rates for Quadrant B Data is divided into 100 sec bins |
 |
 |
| Module-wise count rates for Quadrant C Data is divided into 100 sec bins |
 |
 |
| Module-wise count rates for Quadrant D Data is divided into 100 sec bins |
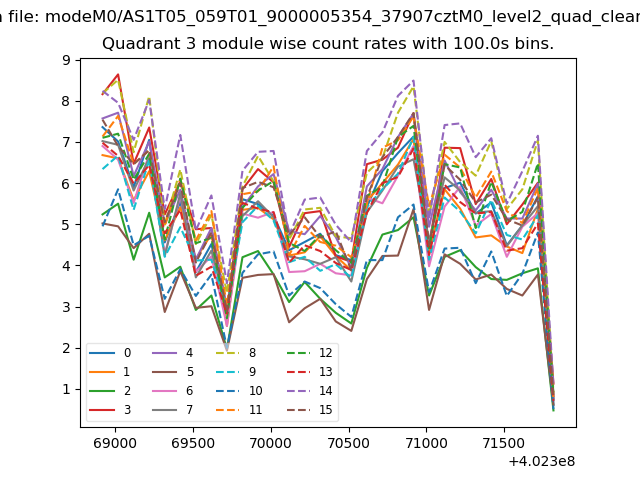 |
 |
| Parameter | Plot |
|---|---|
| CZT HV Monitor | 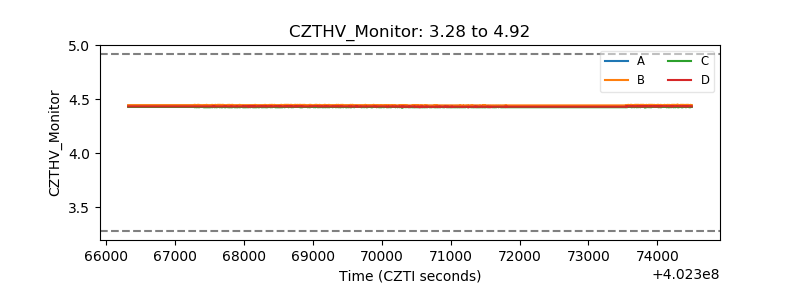 |
| D_VDD | 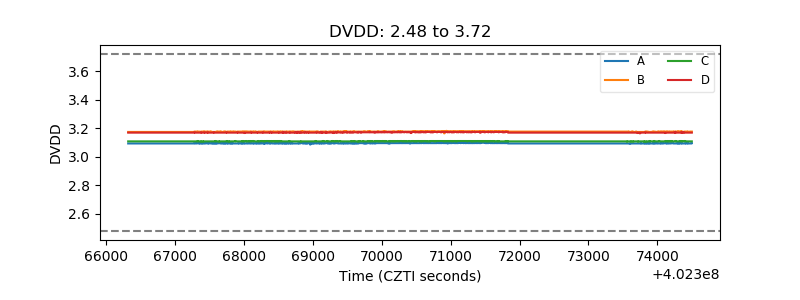 |
| Temperature 1 |  |
| Veto HV Monitor | 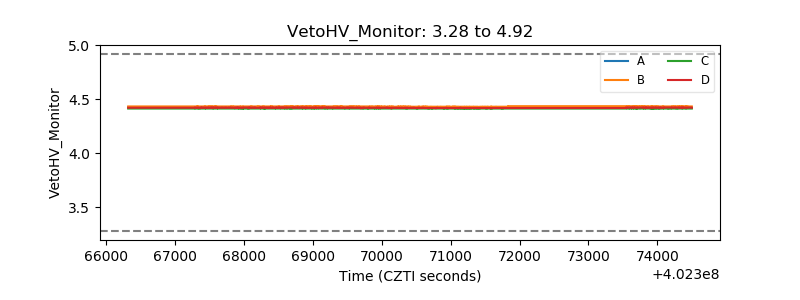 |
| Veto LLD | 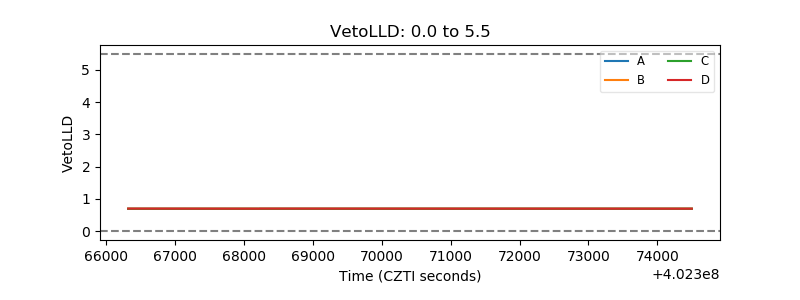 |
| Alpha Counter | 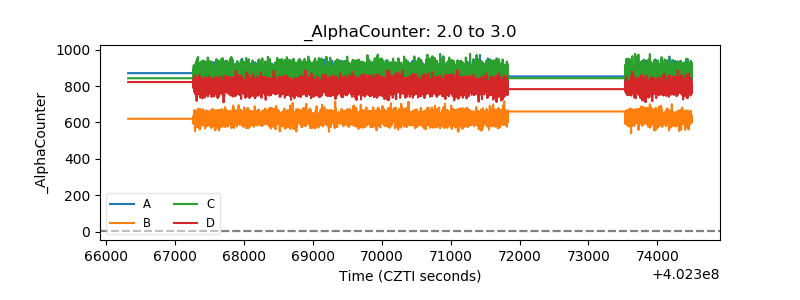 |
| _CPM_Rate | 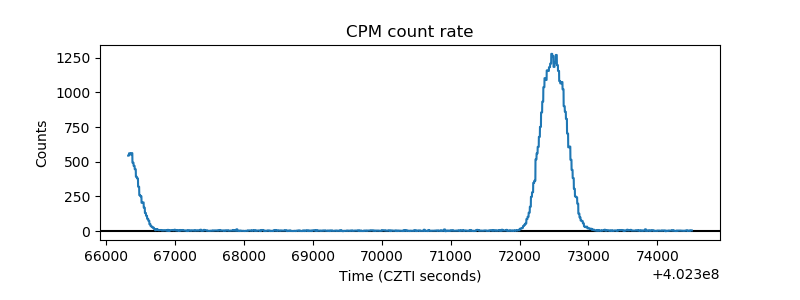 |
| CZT Counter | 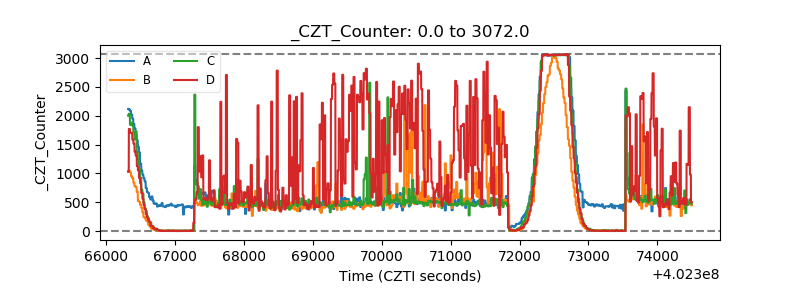 |
| +2.5 Volts monitor | 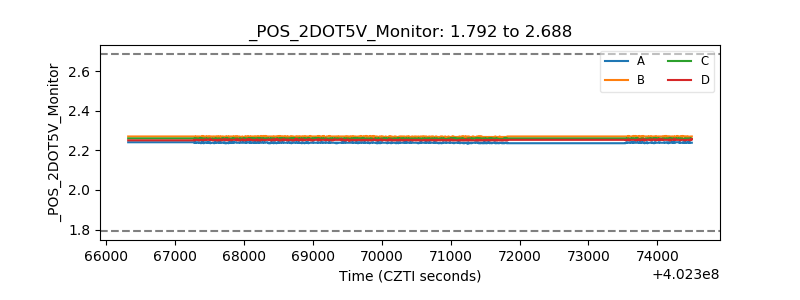 |
| +5 Volts monitor |  |
| _ROLL_ROT | 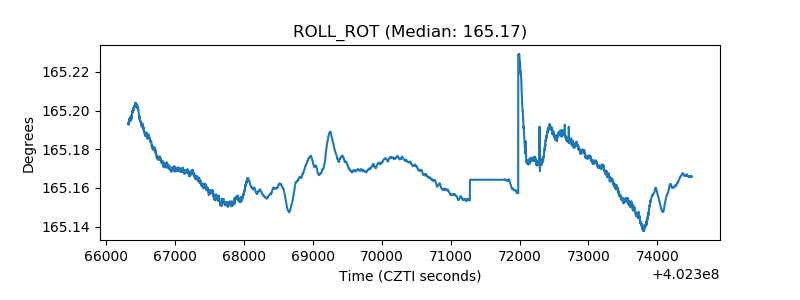 |
| _Roll_DEC | 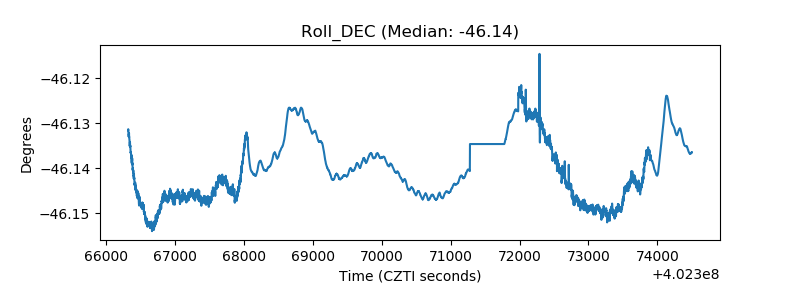 |
| _Roll_RA | 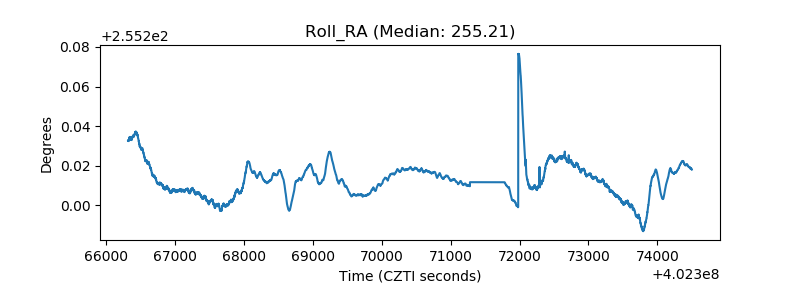 |
| Veto Counter | 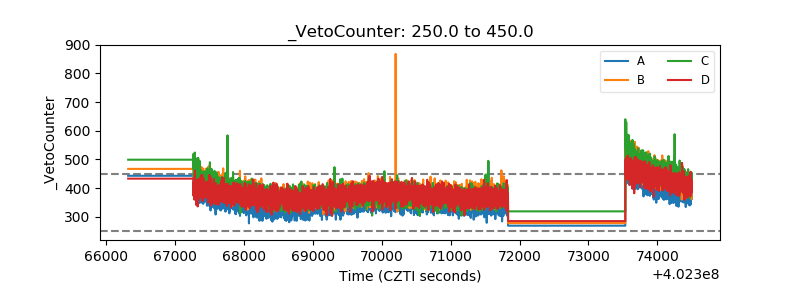 |