| Param | Original file | Final file |
|---|---|---|
| Filename | modeM0/AS1T05_059T01_9000005354_37909cztM0_level2.evt | modeM0/AS1T05_059T01_9000005354_37909cztM0_level2_quad_clean.evt |
| Size (bytes) | 487,558,080 | 67,501,440 |
| Size | 465.0 MB | 64.4 MB |
| Events in quadrant A | 2,907,998 | 430,758 |
| Events in quadrant B | 3,007,388 | 438,336 |
| Events in quadrant C | 2,833,567 | 440,775 |
| Events in quadrant D | 5,649,498 | 355,012 |
| Mode M0 | |||
|---|---|---|---|
| Quadrant | BADHDUFLAG | Total packets | Discarded packets |
| A | 0 | 11817 | 3 |
| B | 0 | 12314 | 2 |
| C | 0 | 11614 | 2 |
| D | 0 | 20432 | 2 |
| Mode SS | |||
|---|---|---|---|
| Quadrant | BADHDUFLAG | Total packets | Discarded packets |
| A | 0 | 112 | 0 |
| B | 0 | 112 | 0 |
| C | 0 | 112 | 0 |
| D | 0 | 112 | 0 |
| Mode M9 | |||
|---|---|---|---|
| Quadrant | BADHDUFLAG | Total packets | Discarded packets |
| A | 0 | 35 | 0 |
| B | 0 | 35 | 0 |
| C | 0 | 35 | 0 |
| D | 0 | 35 | 0 |
| Quadrant | Total seconds | Saturated seconds | Saturation percentage |
|---|---|---|---|
| A | 5410 | 12 | 0.221811% |
| B | 5410 | 35 | 0.646950% |
| C | 5410 | 26 | 0.480591% |
| D | 5410 | 1259 | 23.271719% |
Noise dominated data is calculated using 1-second bins in cleaned event files. If a bin has >2000 counts, and if more than 50% of those come from <1% of pixels, then it is considered to be noise-dominated and hence unusable.
| Quadrant | # 1 sec bins | Bins with >0 counts | Bins with >2000 counts | High rate bins dominated by noise | Noise dominated (total time) | Noise dominated (detector-on time) | Marked lightcurve |
|---|---|---|---|---|---|---|---|
| A | 8934 | 5412 | 7 | 7 | 0.08% | 0.13% | 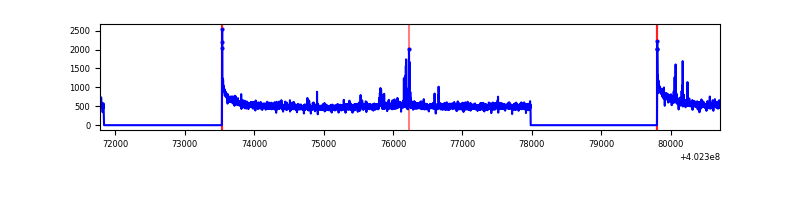 |
| B | 8934 | 5412 | 13 | 13 | 0.15% | 0.24% | 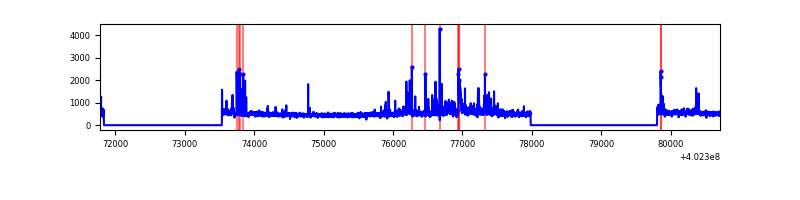 |
| C | 8934 | 5412 | 16 | 16 | 0.18% | 0.30% | 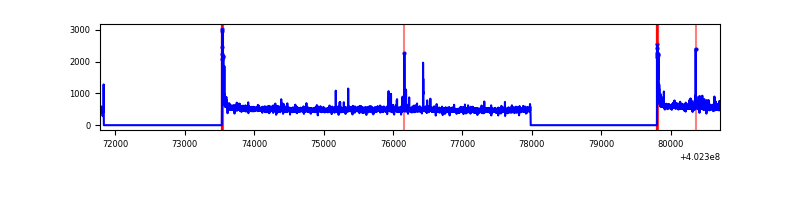 |
| D | 8934 | 5411 | 728 | 728 | 8.15% | 13.45% | 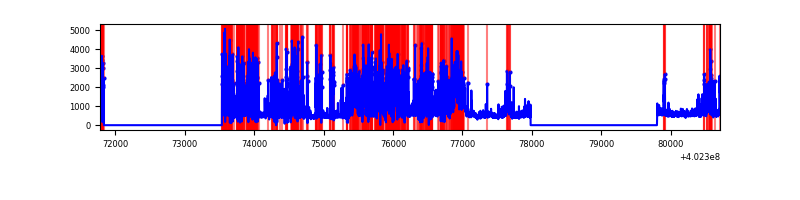 |
Top three noisy pixels from each quadrant. If the there are fewer than three noisy pixels in the level2.evt file, extra rows are filled as -1
| Pixel properties | Quadrant properties | ||||||
|---|---|---|---|---|---|---|---|
| Quadrant | DetID | PixID | Counts | Sigma | Mean | Median | Sigma |
| A | 10 | 83 | 346235 | 2658.66 | 640 | 627 | 130.0 |
| A | 12 | 227 | 44819 | 339.95 | 640 | 627 | 130.0 |
| A | 12 | 189 | 17377 | 128.85 | 640 | 627 | 130.0 |
| B | 5 | 184 | 120389 | 984.82 | 635 | 619 | 121.6 |
| B | 0 | 229 | 118338 | 967.95 | 635 | 619 | 121.6 |
| B | 5 | 172 | 90661 | 740.38 | 635 | 619 | 121.6 |
| C | 15 | 214 | 233521 | 1615.85 | 626 | 631 | 144.1 |
| C | 0 | 10 | 104313 | 719.37 | 626 | 631 | 144.1 |
| C | 14 | 254 | 41973 | 286.84 | 626 | 631 | 144.1 |
| D | 1 | 52 | 2085846 | 15541.35 | 552 | 536 | 134.2 |
| D | 2 | 249 | 535961 | 3990.4 | 552 | 536 | 134.2 |
| D | 12 | 233 | 436823 | 3251.55 | 552 | 536 | 134.2 |
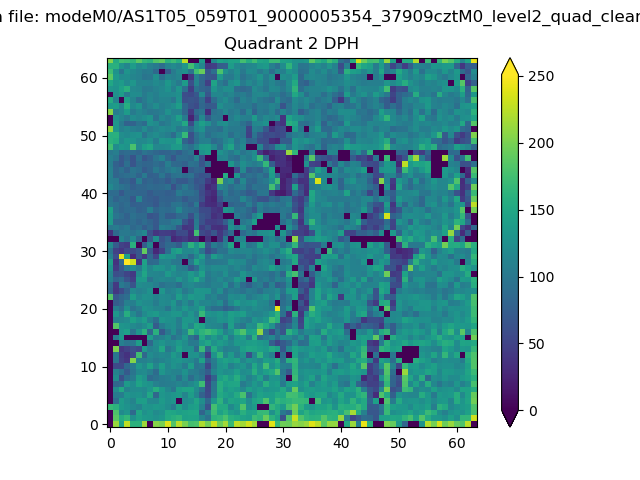
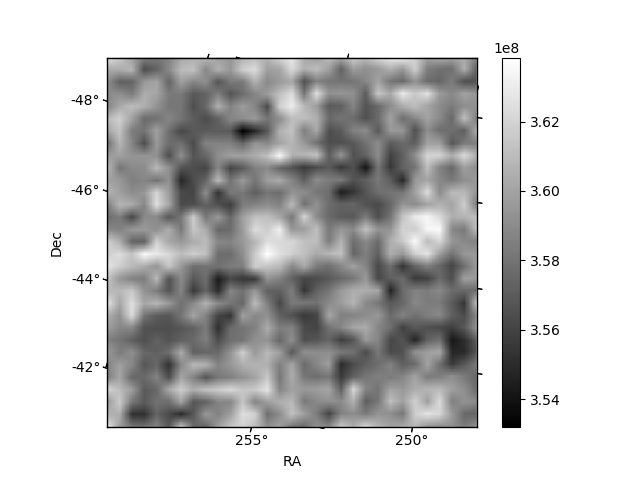
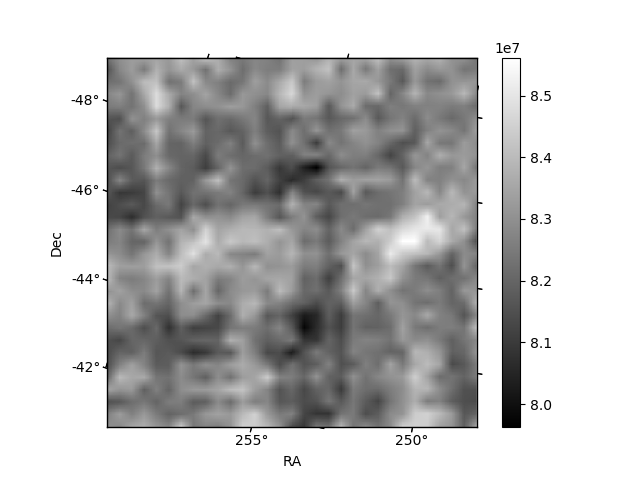
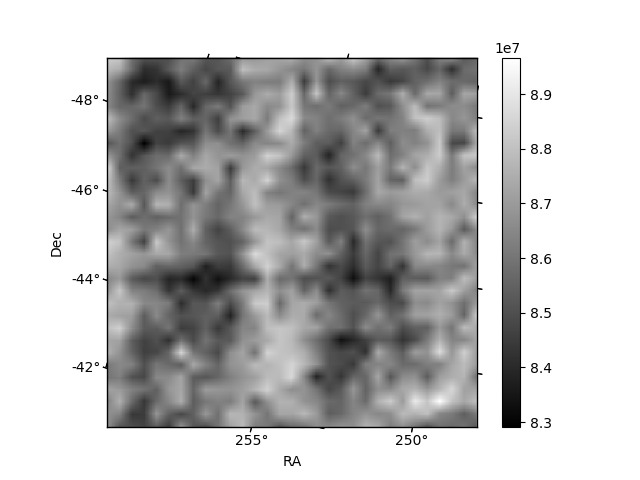
Histogram calculated using DETX and DETY for each event in the final _common_clean file
| Quadrant A | 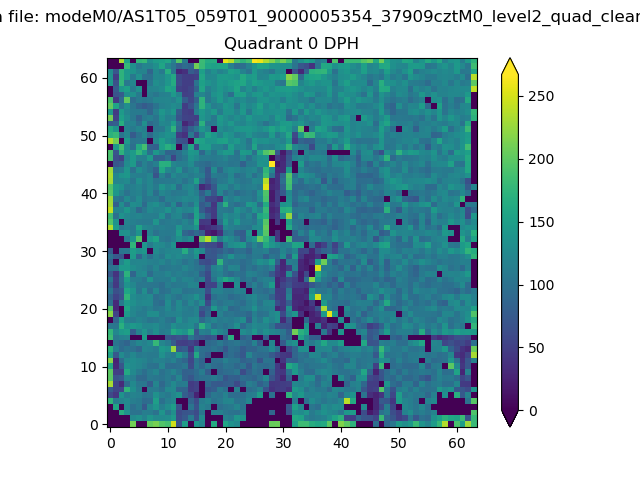 |
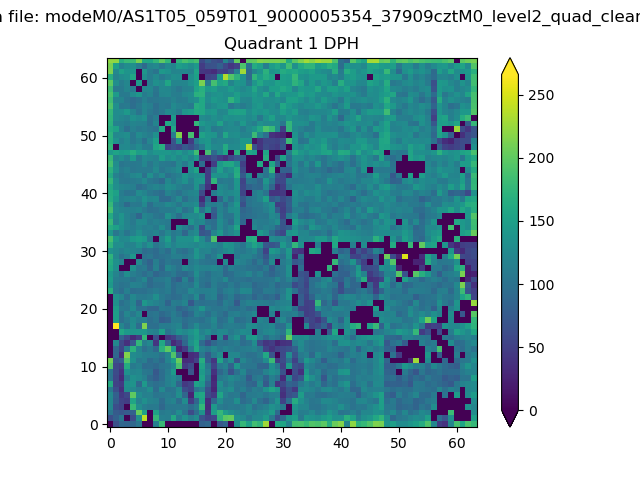 |
Quadrant B |
|---|---|---|---|
| Quadrant D | 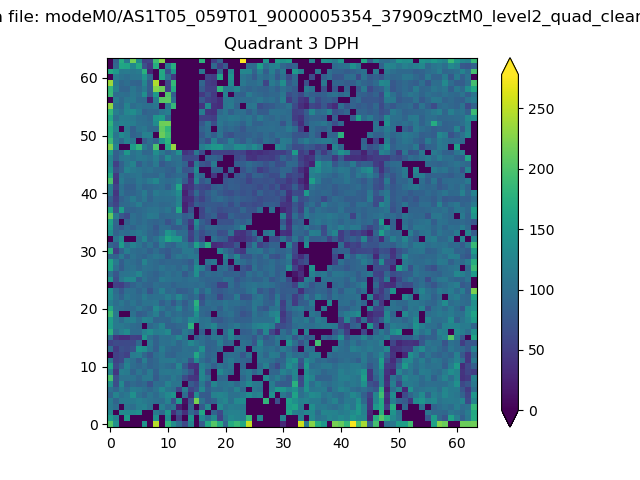 |
 |
Quadrant C |
| Plot type | Count rate plots | Images |
|---|---|---|
| Comparison with Poisson distribution Blue bars denote a histogram of data divided into 1 sec bins. Red curve is a Poisson curve with rate = median count rate of data. |
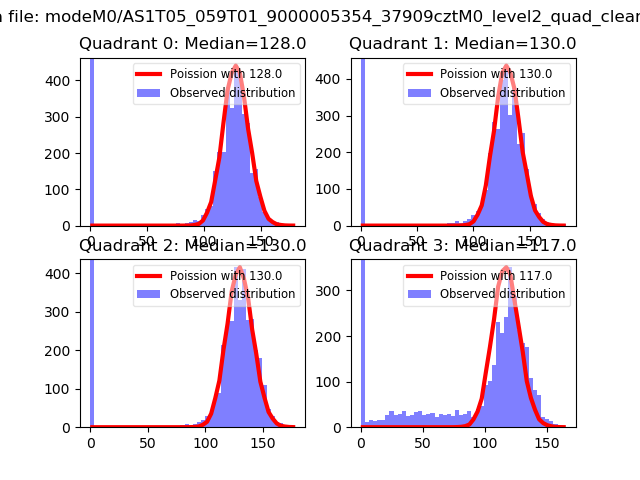 |
 |
| Quadrant-wise count rates Data is divided into 100 sec bins |
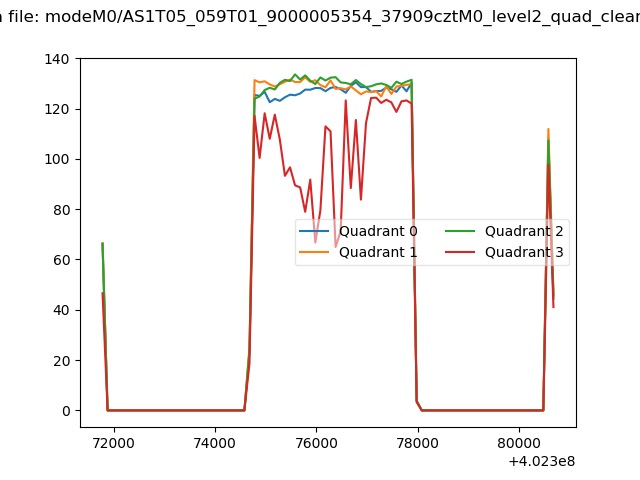 |
|
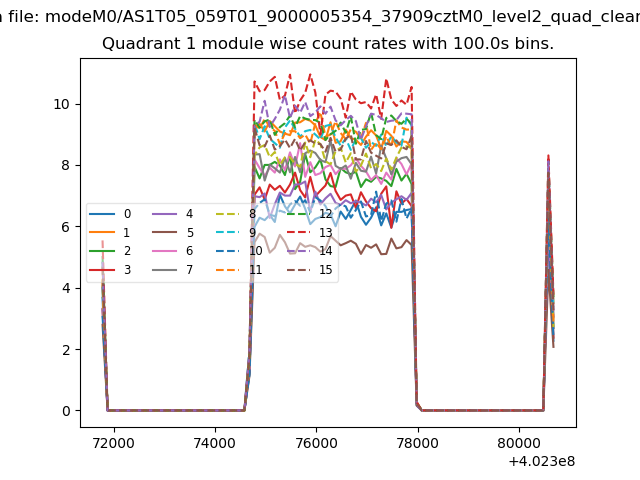
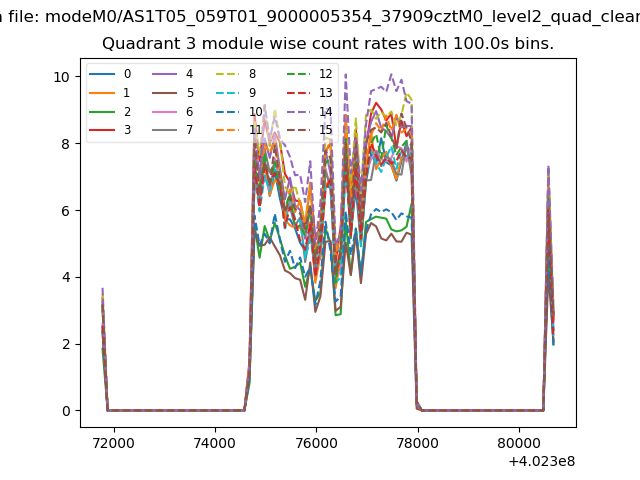
| Module-wise count rates for Quadrant A Data is divided into 100 sec bins |
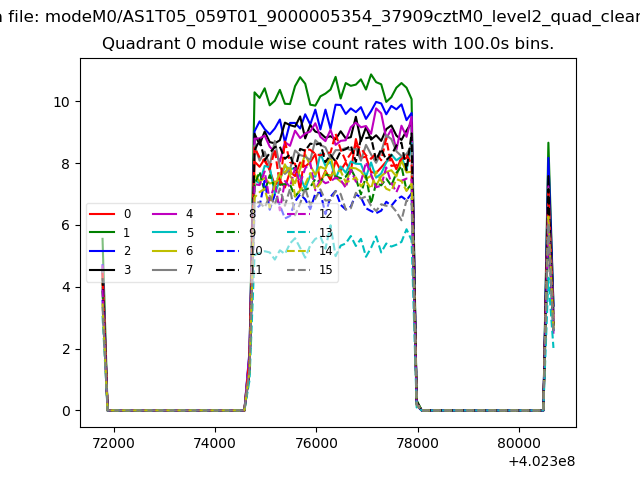 |
 |
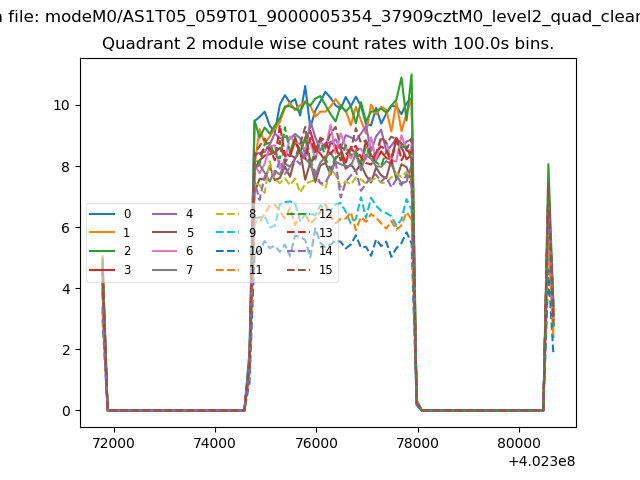
| Module-wise count rates for Quadrant B Data is divided into 100 sec bins |
 |
 |
| Module-wise count rates for Quadrant C Data is divided into 100 sec bins |
 |
 |
| Module-wise count rates for Quadrant D Data is divided into 100 sec bins |
 |
 |
| Parameter | Plot |
|---|---|
| CZT HV Monitor | 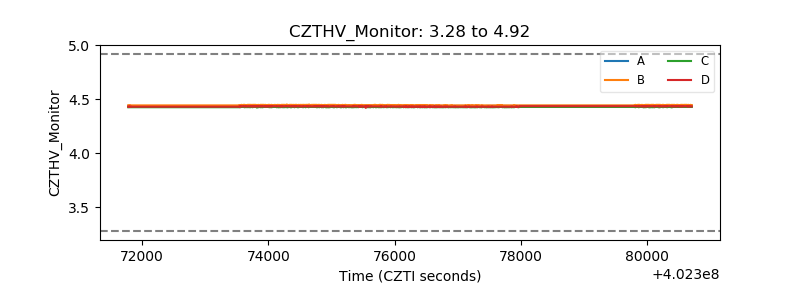 |
| D_VDD | 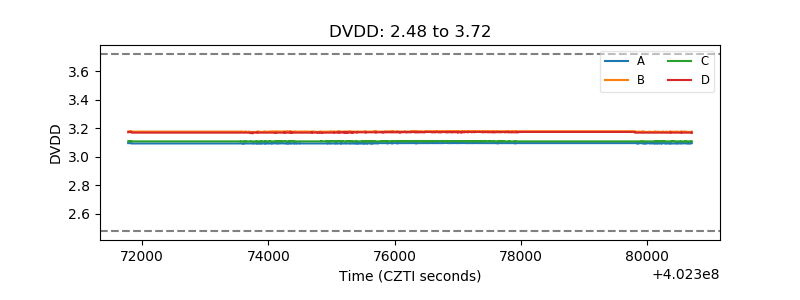 |
| Temperature 1 | 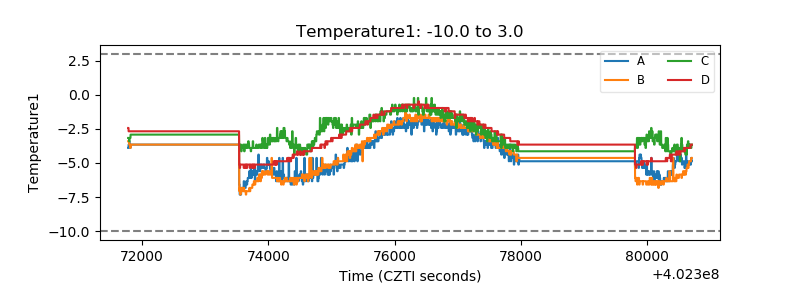 |
| Veto HV Monitor |  |
| Veto LLD | 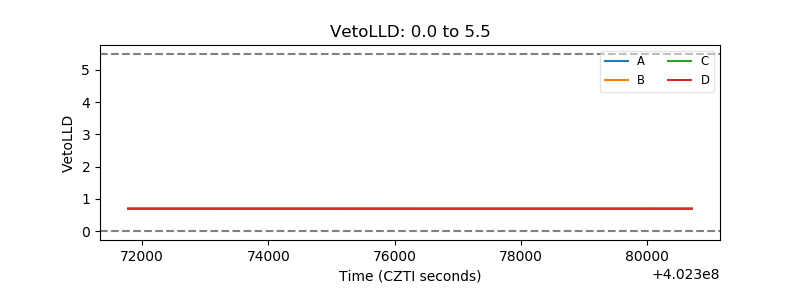 |
| Alpha Counter | 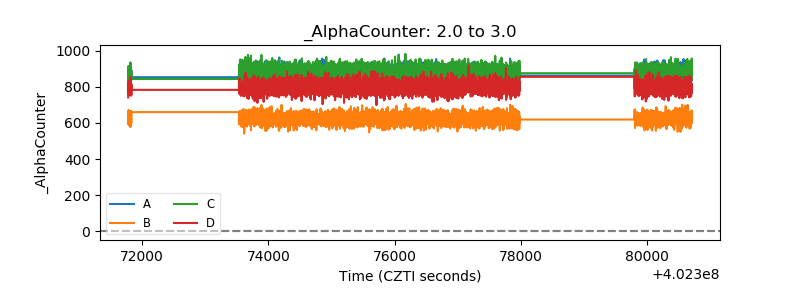 |
| _CPM_Rate | 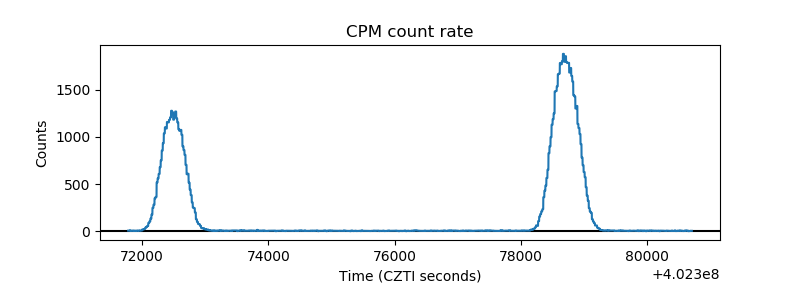 |
| CZT Counter | 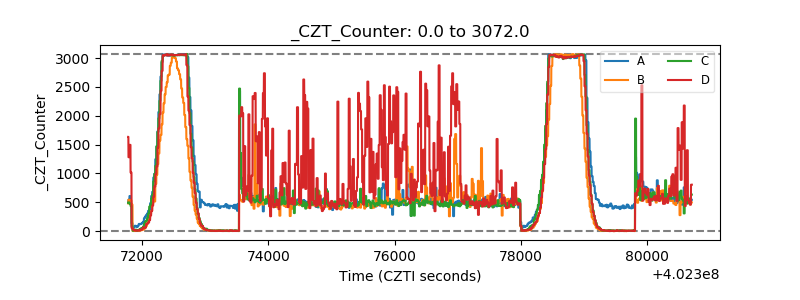 |
| +2.5 Volts monitor | 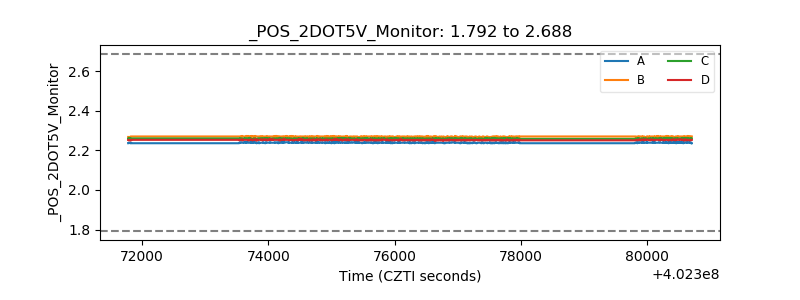 |
| +5 Volts monitor | 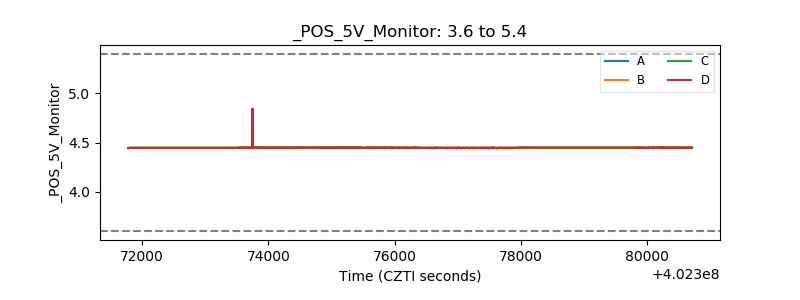 |
| _ROLL_ROT | 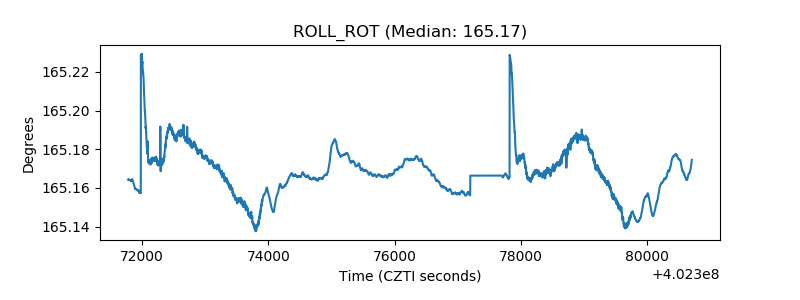 |
| _Roll_DEC | 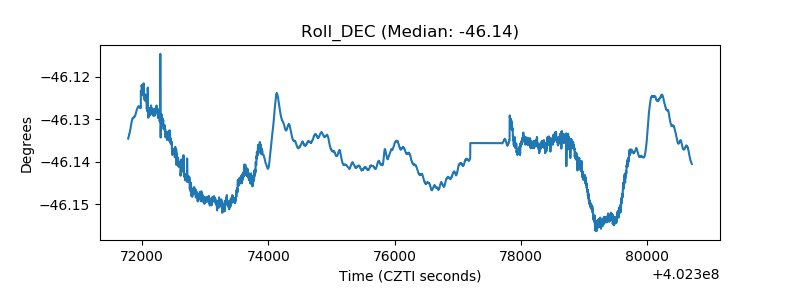 |
| _Roll_RA | 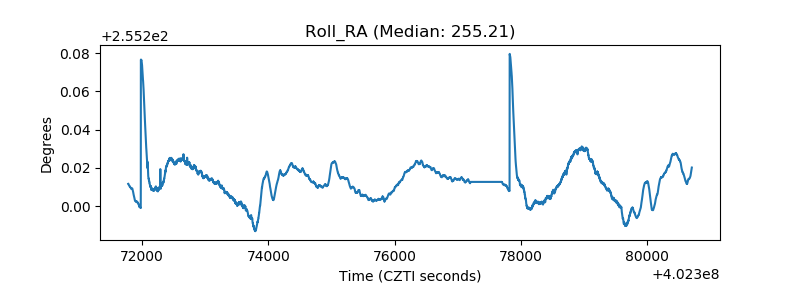 |
| Veto Counter | 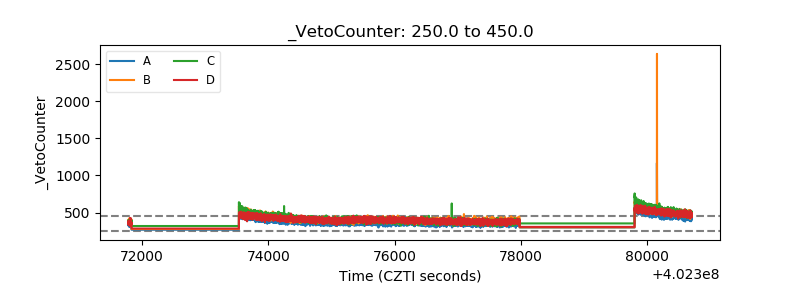 |