| Param | Original file | Final file |
|---|---|---|
| Filename | modeM0/AS1T05_059T01_9000005354_37910cztM0_level2.evt | modeM0/AS1T05_059T01_9000005354_37910cztM0_level2_quad_clean.evt |
| Size (bytes) | 491,996,160 | 87,554,880 |
| Size | 469.2 MB | 83.5 MB |
| Events in quadrant A | 3,049,297 | 580,265 |
| Events in quadrant B | 3,577,680 | 577,614 |
| Events in quadrant C | 2,955,088 | 591,578 |
| Events in quadrant D | 4,948,803 | 520,705 |
| Mode M0 | |||
|---|---|---|---|
| Quadrant | BADHDUFLAG | Total packets | Discarded packets |
| A | 0 | 12221 | 3 |
| B | 0 | 13928 | 2 |
| C | 0 | 12089 | 2 |
| D | 0 | 18408 | 2 |
| Mode SS | |||
|---|---|---|---|
| Quadrant | BADHDUFLAG | Total packets | Discarded packets |
| A | 0 | 112 | 0 |
| B | 0 | 112 | 0 |
| C | 0 | 112 | 0 |
| D | 0 | 112 | 0 |
| Mode M9 | |||
|---|---|---|---|
| Quadrant | BADHDUFLAG | Total packets | Discarded packets |
| A | 0 | 38 | 0 |
| B | 0 | 38 | 0 |
| C | 0 | 38 | 0 |
| D | 0 | 38 | 0 |
| Quadrant | Total seconds | Saturated seconds | Saturation percentage |
|---|---|---|---|
| A | 5448 | 19 | 0.348752% |
| B | 5448 | 207 | 3.799559% |
| C | 5448 | 23 | 0.422173% |
| D | 5448 | 629 | 11.545521% |
Noise dominated data is calculated using 1-second bins in cleaned event files. If a bin has >2000 counts, and if more than 50% of those come from <1% of pixels, then it is considered to be noise-dominated and hence unusable.
| Quadrant | # 1 sec bins | Bins with >0 counts | Bins with >2000 counts | High rate bins dominated by noise | Noise dominated (total time) | Noise dominated (detector-on time) | Marked lightcurve |
|---|---|---|---|---|---|---|---|
| A | 9212 | 5450 | 12 | 12 | 0.13% | 0.22% | 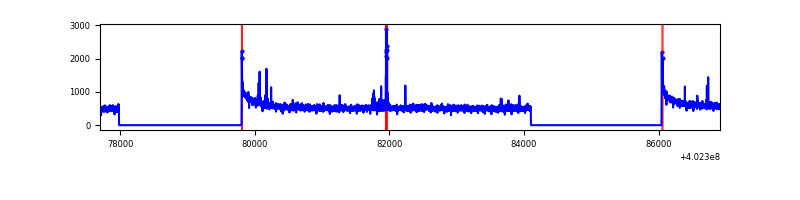 |
| B | 9212 | 5450 | 125 | 125 | 1.36% | 2.29% | 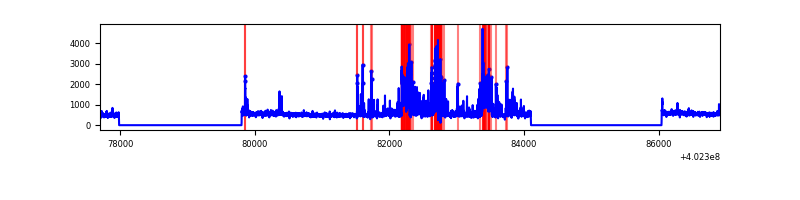 |
| C | 9212 | 5450 | 19 | 19 | 0.21% | 0.35% | 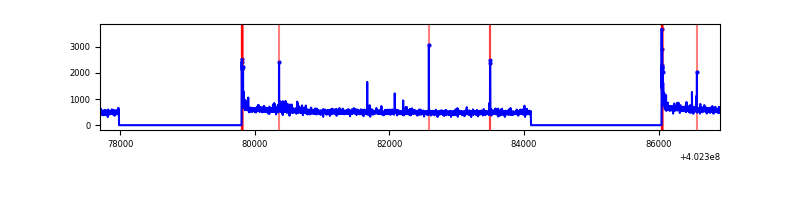 |
| D | 9211 | 5446 | 396 | 396 | 4.30% | 7.27% | 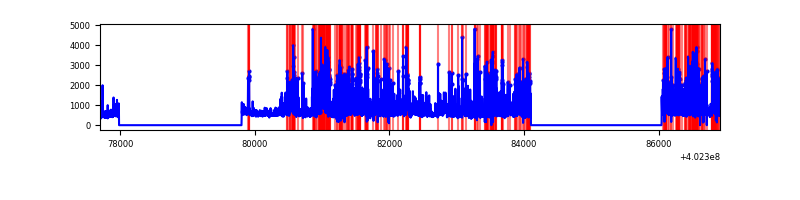 |
Top three noisy pixels from each quadrant. If the there are fewer than three noisy pixels in the level2.evt file, extra rows are filled as -1
| Pixel properties | Quadrant properties | ||||||
|---|---|---|---|---|---|---|---|
| Quadrant | DetID | PixID | Counts | Sigma | Mean | Median | Sigma |
| A | 10 | 83 | 362574 | 2693.66 | 673 | 662 | 134.4 |
| A | 12 | 227 | 24819 | 179.8 | 673 | 662 | 134.4 |
| A | 15 | 174 | 23938 | 173.24 | 673 | 662 | 134.4 |
| B | 5 | 172 | 495306 | 4013.67 | 660 | 645 | 123.2 |
| B | 4 | 232 | 272664 | 2207.16 | 660 | 645 | 123.2 |
| B | 0 | 230 | 67662 | 543.78 | 660 | 645 | 123.2 |
| C | 15 | 214 | 232688 | 1543.9 | 656 | 662 | 150.3 |
| C | 0 | 10 | 105252 | 695.94 | 656 | 662 | 150.3 |
| C | 14 | 254 | 42503 | 278.41 | 656 | 662 | 150.3 |
| D | 1 | 52 | 1746252 | 11547.54 | 626 | 611 | 151.2 |
| D | 2 | 249 | 242504 | 1600.14 | 626 | 611 | 151.2 |
| D | 1 | 47 | 118108 | 777.25 | 626 | 611 | 151.2 |
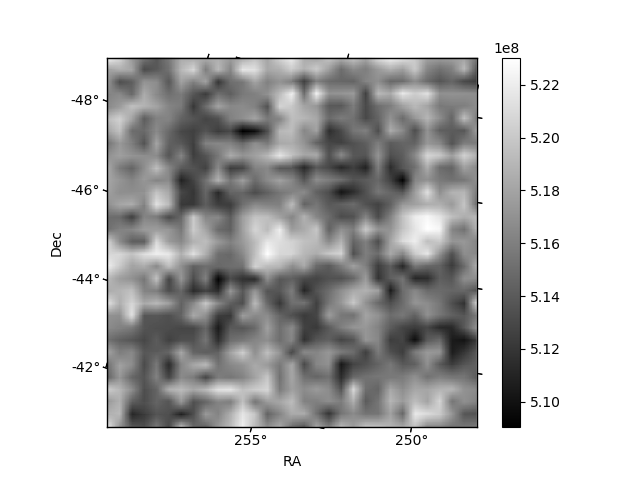
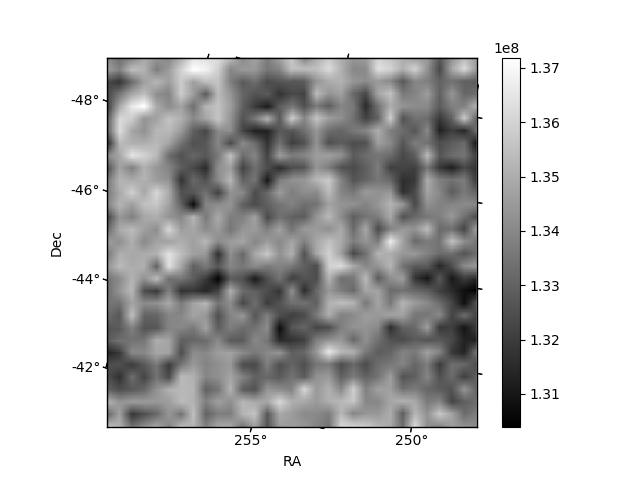
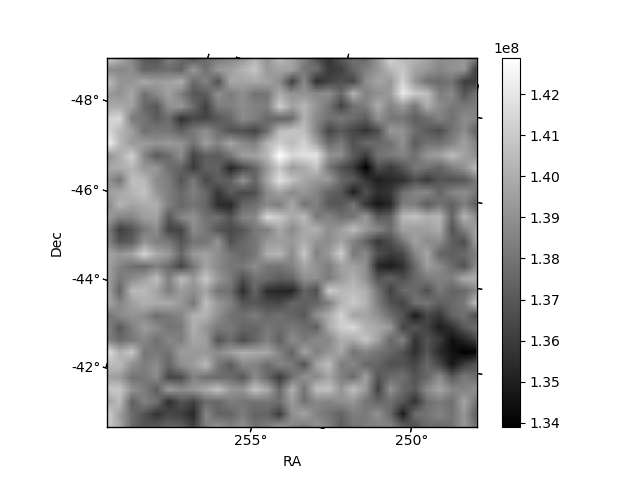
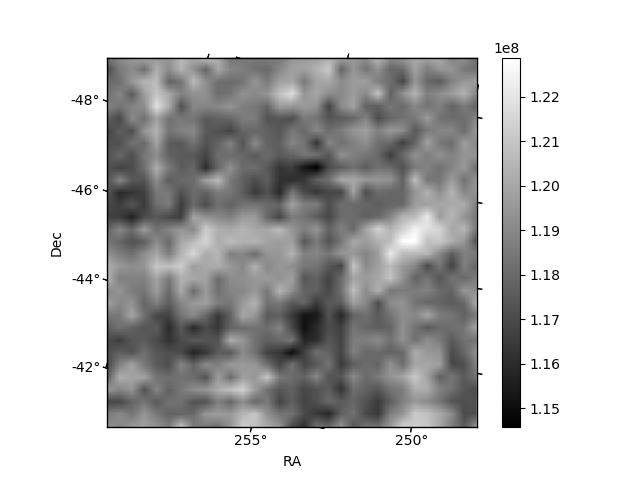
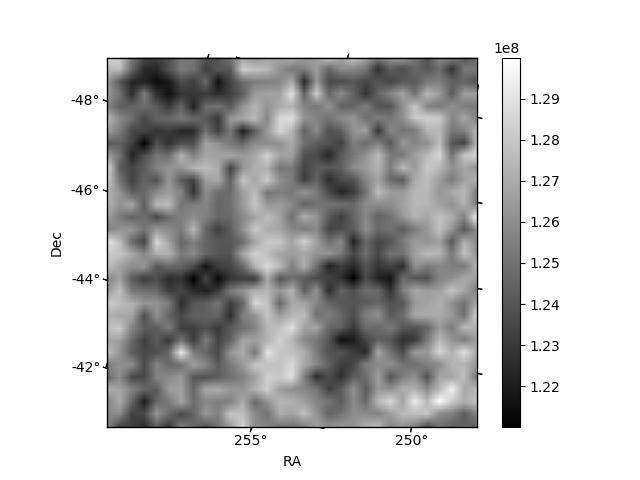
Histogram calculated using DETX and DETY for each event in the final _common_clean file
| Quadrant A | 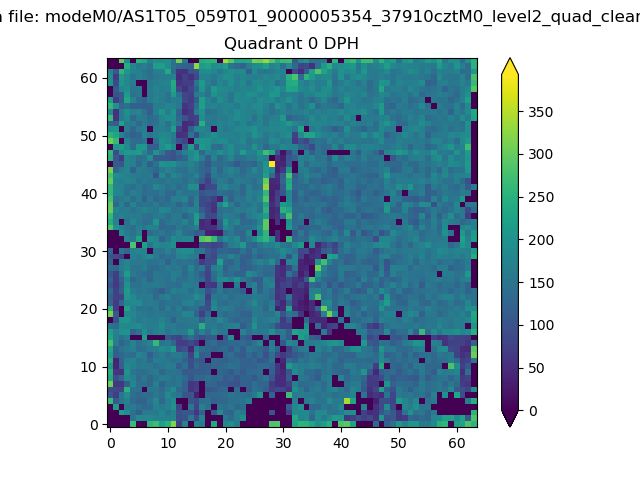 |
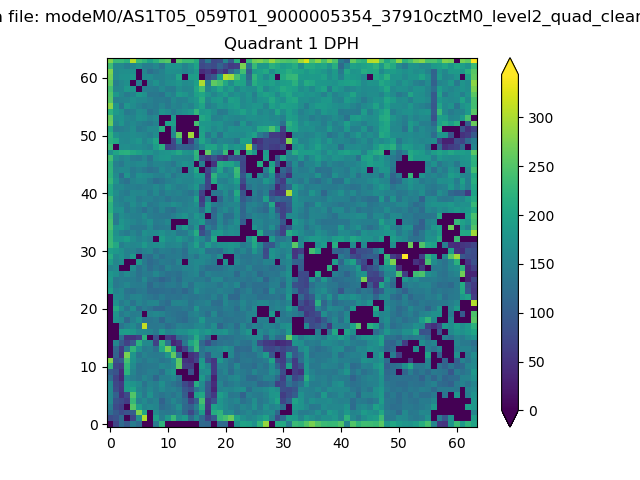 |
Quadrant B |
|---|---|---|---|
| Quadrant D | 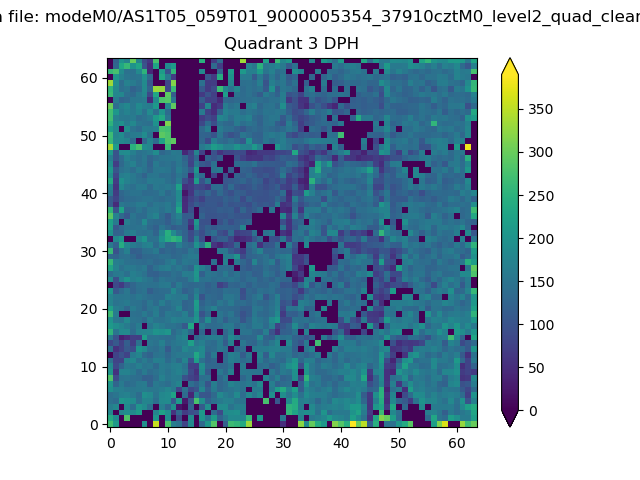 |
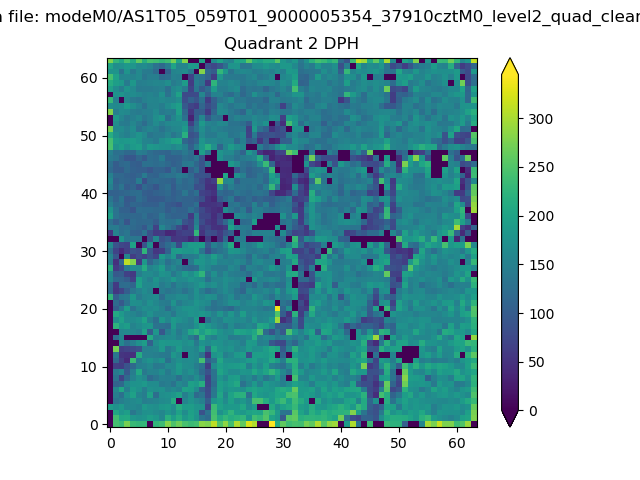 |
Quadrant C |
| Plot type | Count rate plots | Images |
|---|---|---|
| Comparison with Poisson distribution Blue bars denote a histogram of data divided into 1 sec bins. Red curve is a Poisson curve with rate = median count rate of data. |
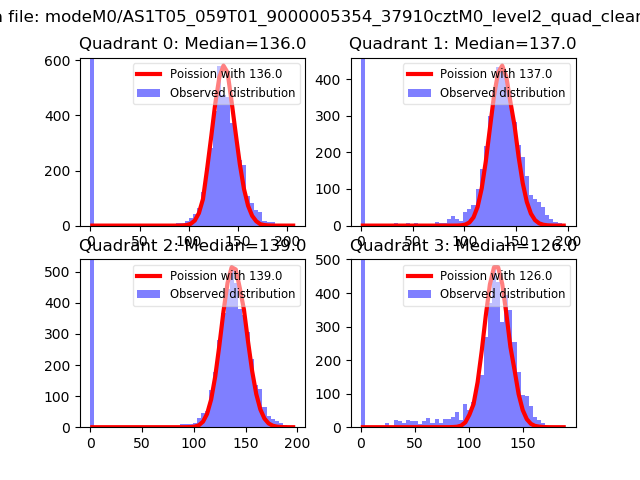 |
 |
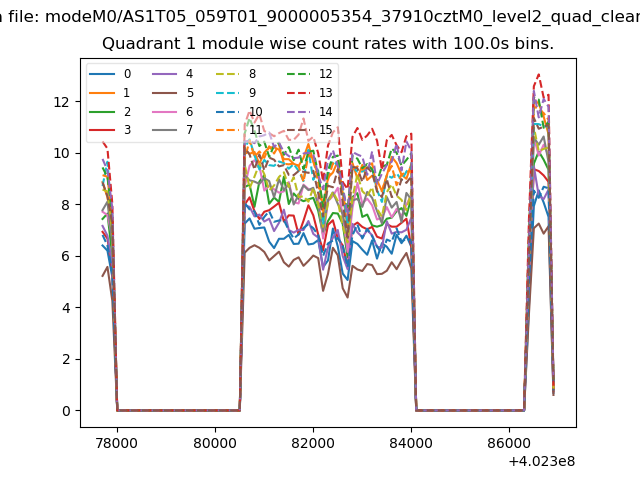
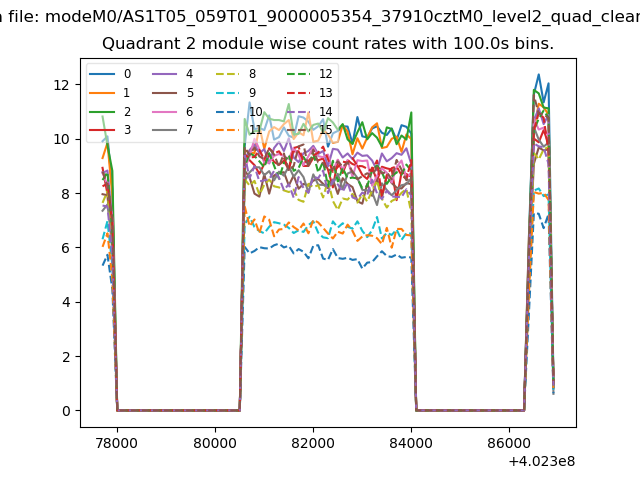
| Quadrant-wise count rates Data is divided into 100 sec bins |
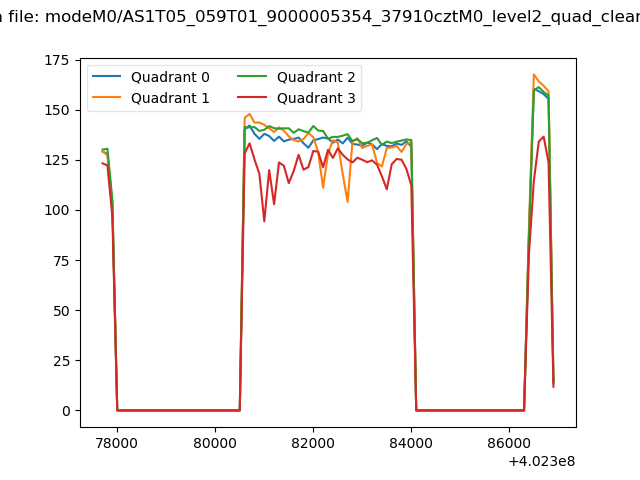 |
|
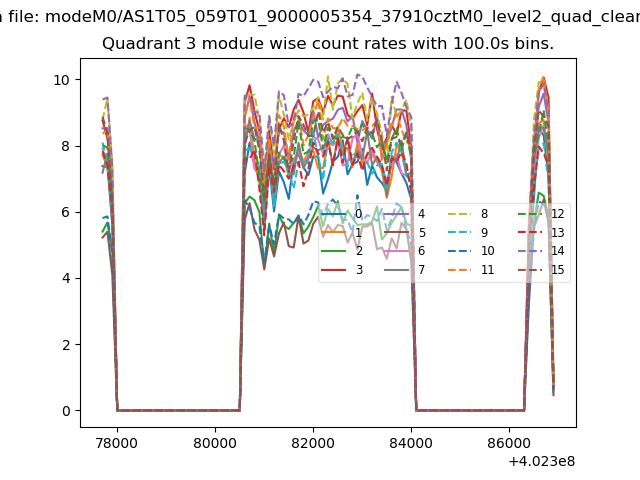
| Module-wise count rates for Quadrant A Data is divided into 100 sec bins |
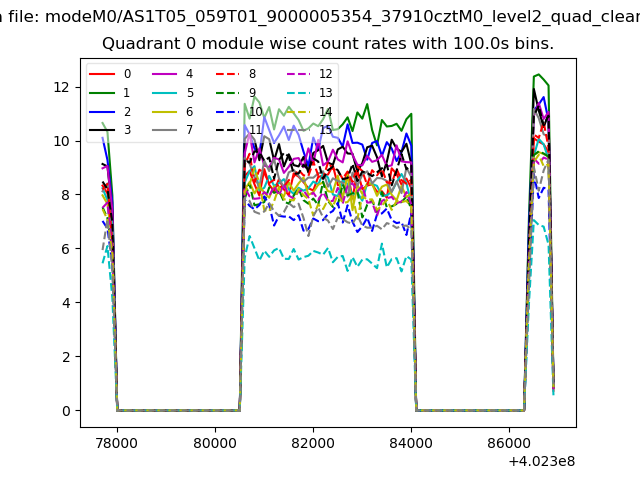 |
 |
| Module-wise count rates for Quadrant B Data is divided into 100 sec bins |
 |
 |
| Module-wise count rates for Quadrant C Data is divided into 100 sec bins |
 |
 |
| Module-wise count rates for Quadrant D Data is divided into 100 sec bins |
 |
 |
| Parameter | Plot |
|---|---|
| CZT HV Monitor | 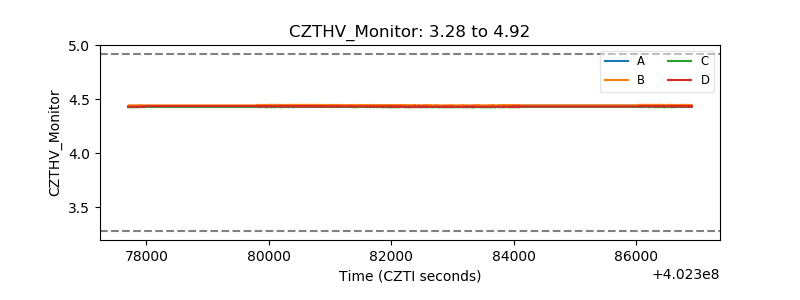 |
| D_VDD | 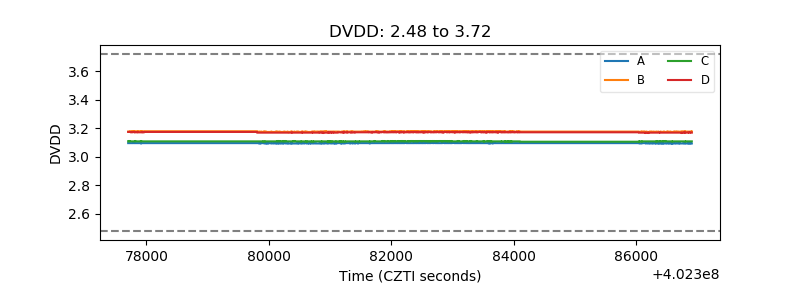 |
| Temperature 1 | 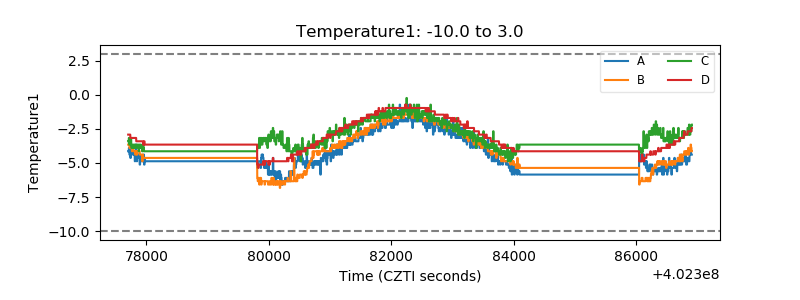 |
| Veto HV Monitor | 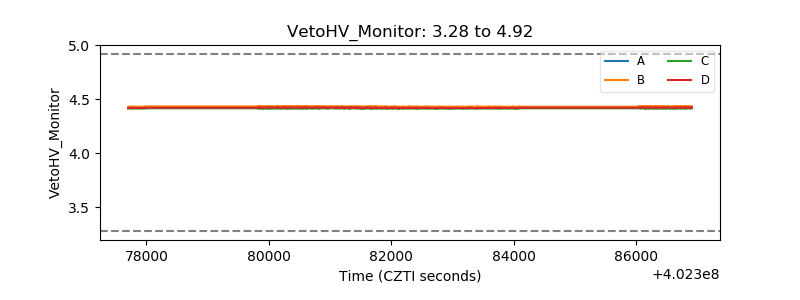 |
| Veto LLD | 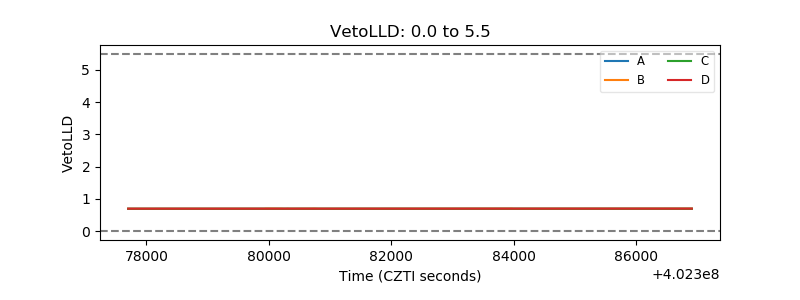 |
| Alpha Counter | 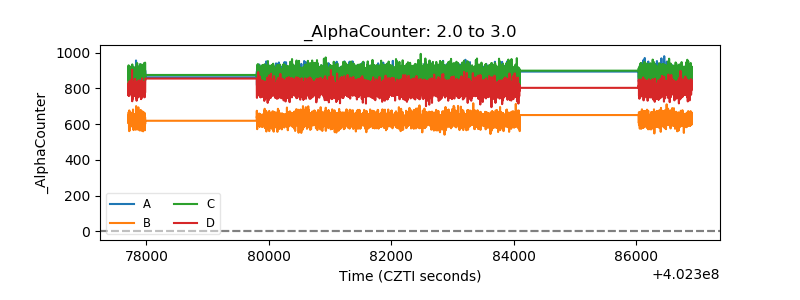 |
| _CPM_Rate | 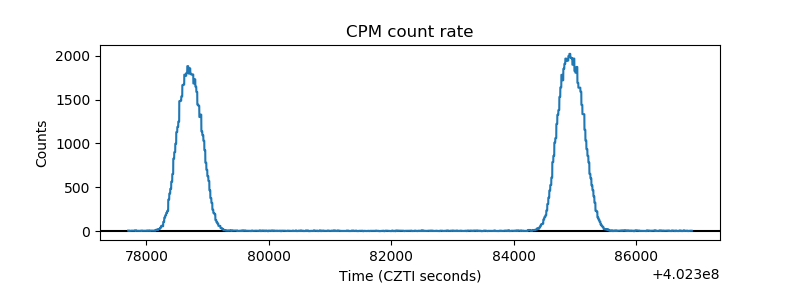 |
| CZT Counter | 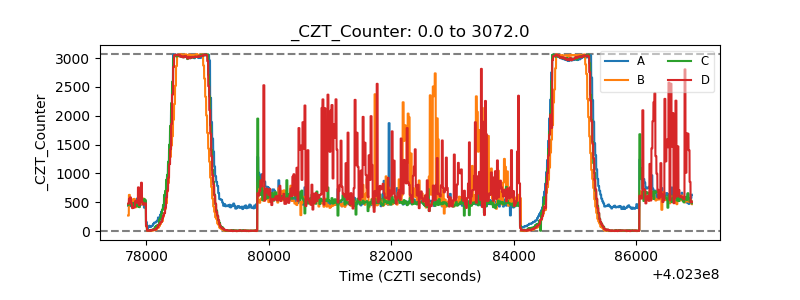 |
| +2.5 Volts monitor | 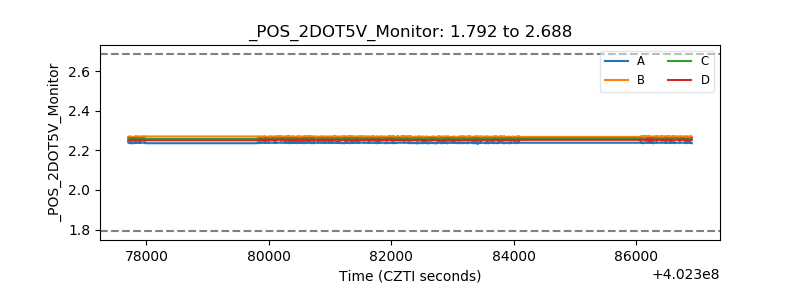 |
| +5 Volts monitor |  |
| _ROLL_ROT | 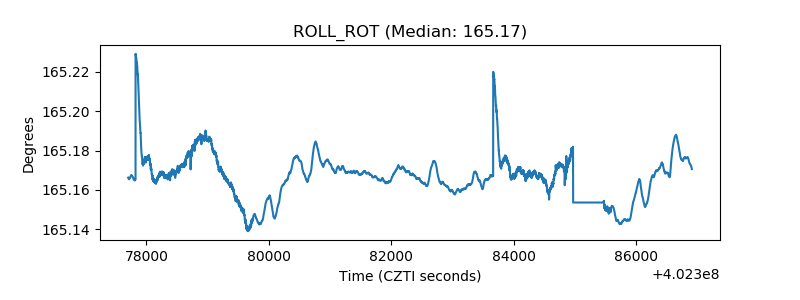 |
| _Roll_DEC | 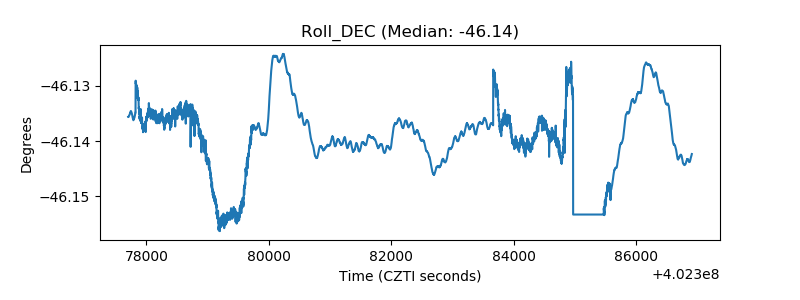 |
| _Roll_RA | 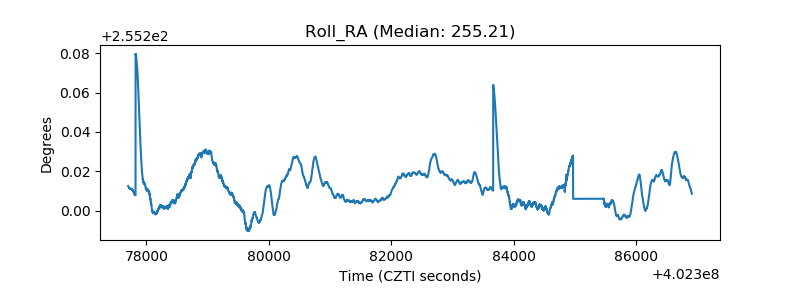 |
| Veto Counter | 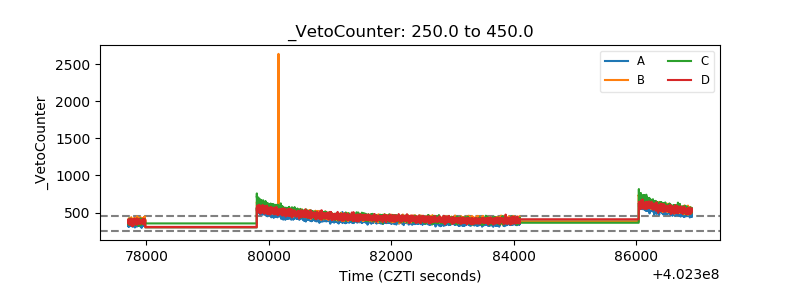 |