| Param | Original file | Final file |
|---|---|---|
| Filename | modeM0/AS1T05_059T01_9000005354_37911cztM0_level2.evt | modeM0/AS1T05_059T01_9000005354_37911cztM0_level2_quad_clean.evt |
| Size (bytes) | 490,063,680 | 99,455,040 |
| Size | 467.4 MB | 94.8 MB |
| Events in quadrant A | 3,120,624 | 685,374 |
| Events in quadrant B | 3,635,739 | 664,958 |
| Events in quadrant C | 2,866,557 | 692,415 |
| Events in quadrant D | 4,874,513 | 613,178 |
| Mode M0 | |||
|---|---|---|---|
| Quadrant | BADHDUFLAG | Total packets | Discarded packets |
| A | 0 | 12387 | 3 |
| B | 0 | 13831 | 2 |
| C | 0 | 11577 | 2 |
| D | 0 | 17919 | 2 |
| Mode SS | |||
|---|---|---|---|
| Quadrant | BADHDUFLAG | Total packets | Discarded packets |
| A | 0 | 104 | 0 |
| B | 0 | 104 | 0 |
| C | 0 | 104 | 0 |
| D | 0 | 104 | 0 |
| Mode M9 | |||
|---|---|---|---|
| Quadrant | BADHDUFLAG | Total packets | Discarded packets |
| A | 0 | 25 | 0 |
| B | 0 | 25 | 0 |
| C | 0 | 25 | 0 |
| D | 0 | 26 | 0 |
| Quadrant | Total seconds | Saturated seconds | Saturation percentage |
|---|---|---|---|
| A | 5075 | 22 | 0.433498% |
| B | 5075 | 359 | 7.073892% |
| C | 5075 | 28 | 0.551724% |
| D | 5075 | 681 | 13.418719% |
Noise dominated data is calculated using 1-second bins in cleaned event files. If a bin has >2000 counts, and if more than 50% of those come from <1% of pixels, then it is considered to be noise-dominated and hence unusable.
| Quadrant | # 1 sec bins | Bins with >0 counts | Bins with >2000 counts | High rate bins dominated by noise | Noise dominated (total time) | Noise dominated (detector-on time) | Marked lightcurve |
|---|---|---|---|---|---|---|---|
| A | 7108 | 5076 | 9 | 9 | 0.13% | 0.18% | 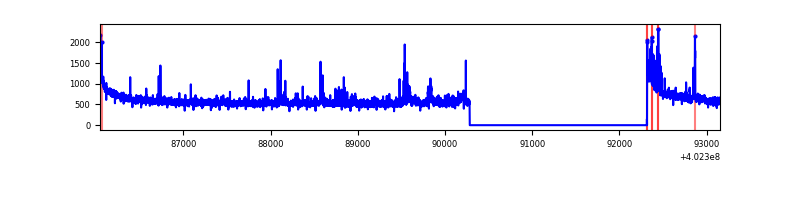 |
| B | 7108 | 5075 | 280 | 280 | 3.94% | 5.52% | 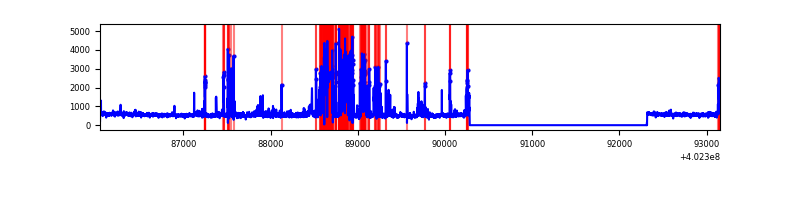 |
| C | 7108 | 5076 | 13 | 13 | 0.18% | 0.26% | 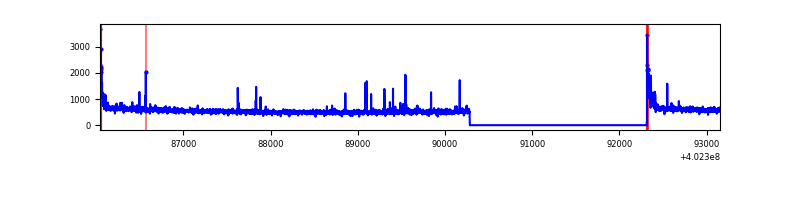 |
| D | 7108 | 5073 | 460 | 460 | 6.47% | 9.07% | 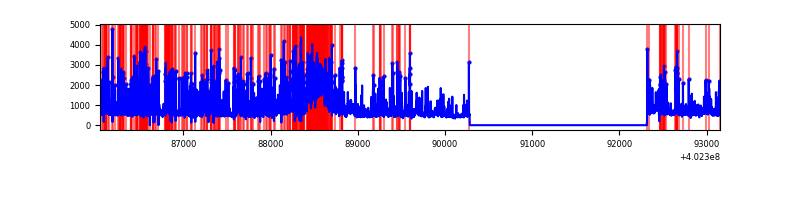 |
Top three noisy pixels from each quadrant. If the there are fewer than three noisy pixels in the level2.evt file, extra rows are filled as -1
| Pixel properties | Quadrant properties | ||||||
|---|---|---|---|---|---|---|---|
| Quadrant | DetID | PixID | Counts | Sigma | Mean | Median | Sigma |
| A | 10 | 83 | 344887 | 2670.48 | 649 | 640 | 128.9 |
| A | 12 | 227 | 130172 | 1004.84 | 649 | 640 | 128.9 |
| A | 15 | 222 | 88739 | 683.42 | 649 | 640 | 128.9 |
| B | 5 | 172 | 934282 | 8100.33 | 617 | 603 | 115.3 |
| B | 4 | 81 | 93701 | 807.69 | 617 | 603 | 115.3 |
| B | 0 | 230 | 75524 | 649.99 | 617 | 603 | 115.3 |
| C | 15 | 214 | 216666 | 1504.48 | 628 | 634 | 143.6 |
| C | 0 | 10 | 114940 | 796.05 | 628 | 634 | 143.6 |
| C | 14 | 254 | 51841 | 356.61 | 628 | 634 | 143.6 |
| D | 1 | 52 | 1660272 | 11339.45 | 601 | 588 | 146.4 |
| D | 12 | 233 | 546900 | 3732.57 | 601 | 588 | 146.4 |
| D | 1 | 47 | 109533 | 744.34 | 601 | 588 | 146.4 |
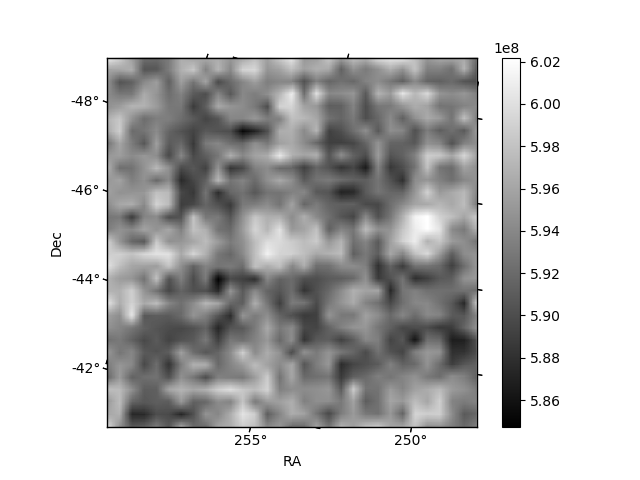
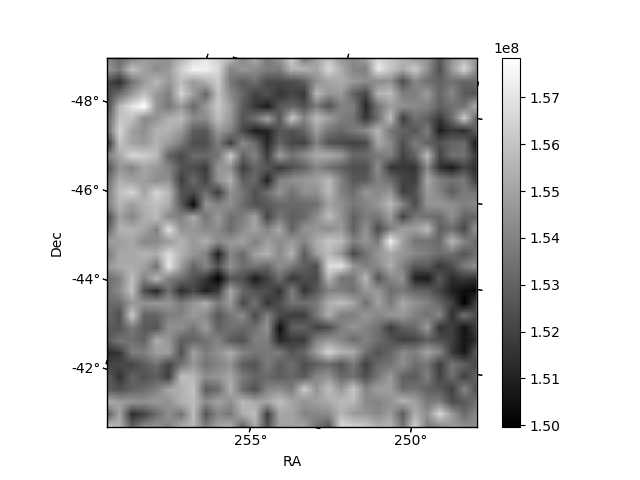
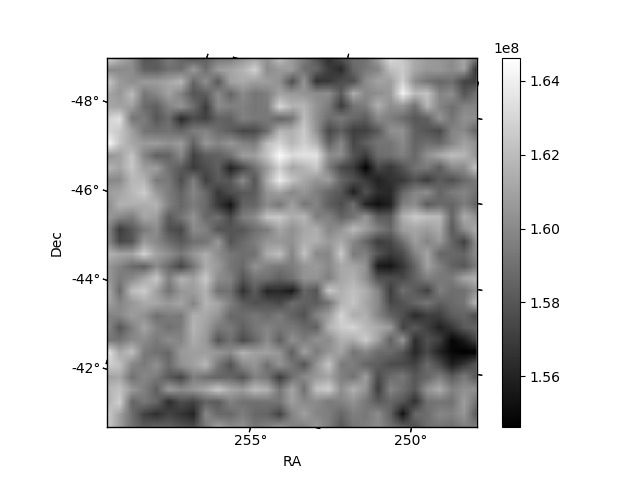
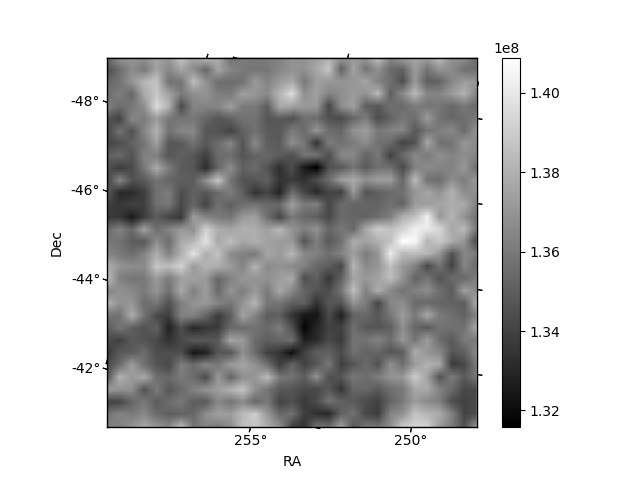
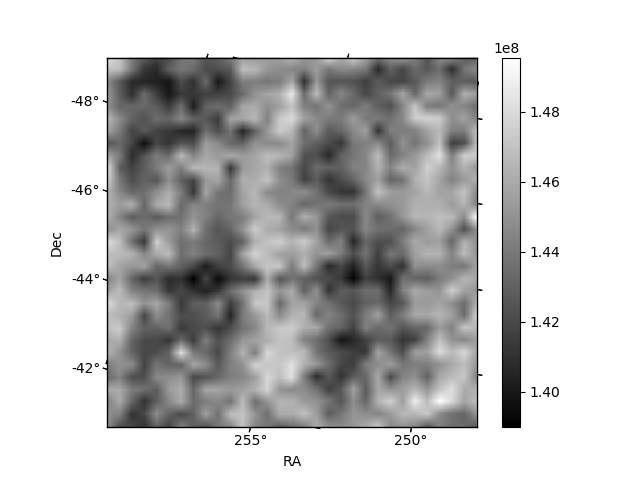
Histogram calculated using DETX and DETY for each event in the final _common_clean file
| Quadrant A | 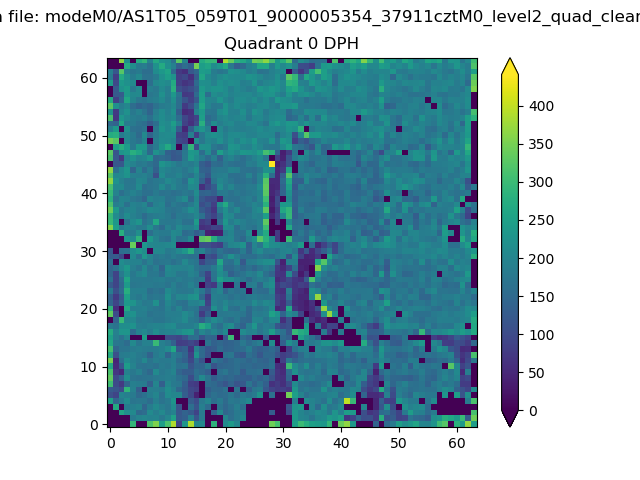 |
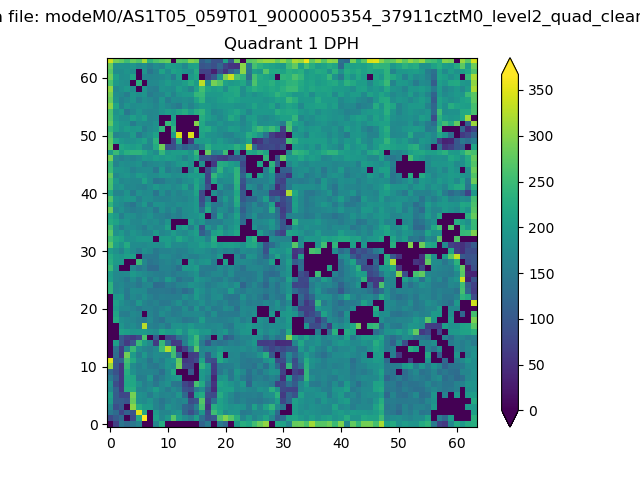 |
Quadrant B |
|---|---|---|---|
| Quadrant D | 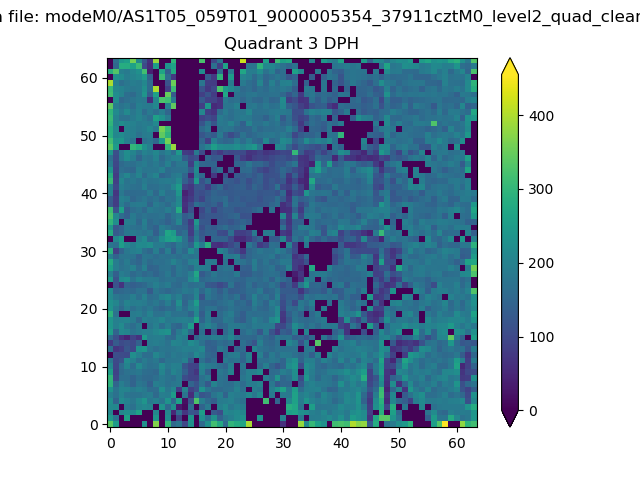 |
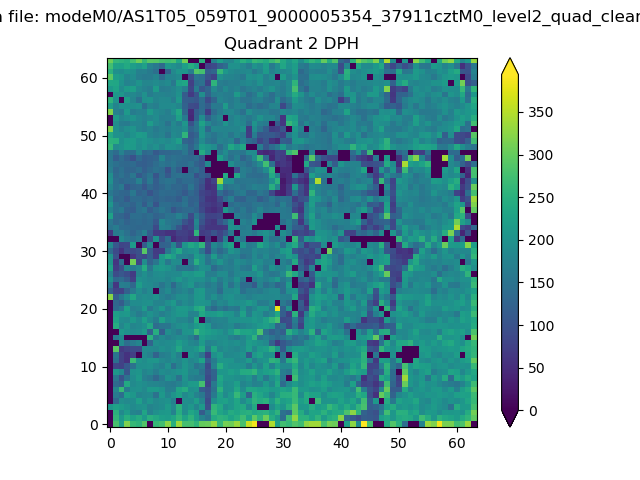 |
Quadrant C |
| Plot type | Count rate plots | Images |
|---|---|---|
| Comparison with Poisson distribution Blue bars denote a histogram of data divided into 1 sec bins. Red curve is a Poisson curve with rate = median count rate of data. |
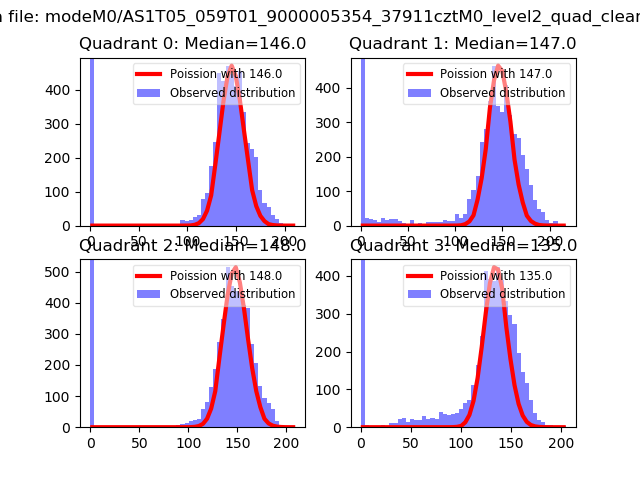 |
 |
| Quadrant-wise count rates Data is divided into 100 sec bins |
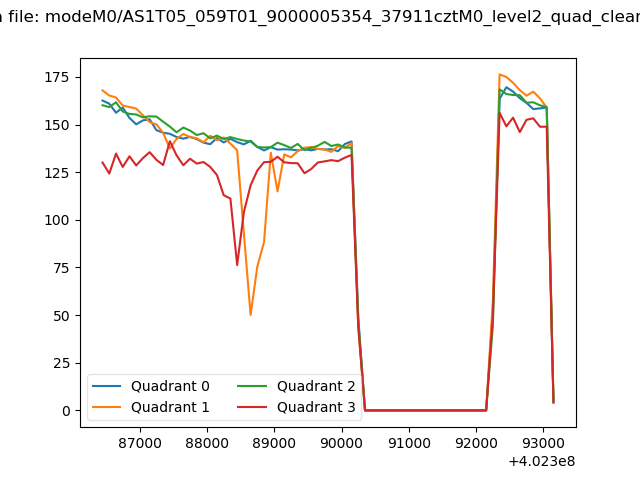 |
|
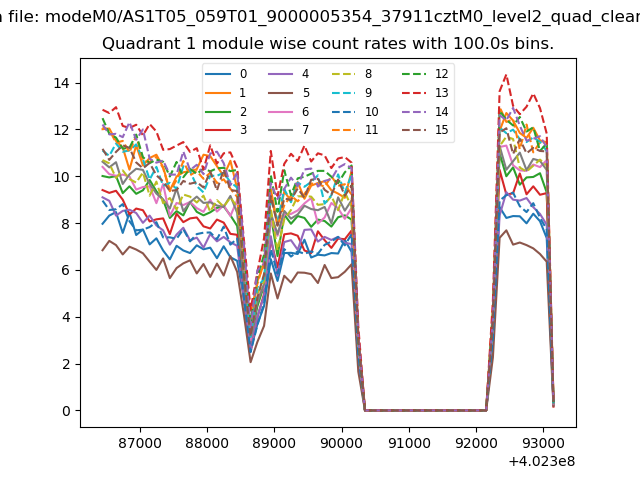
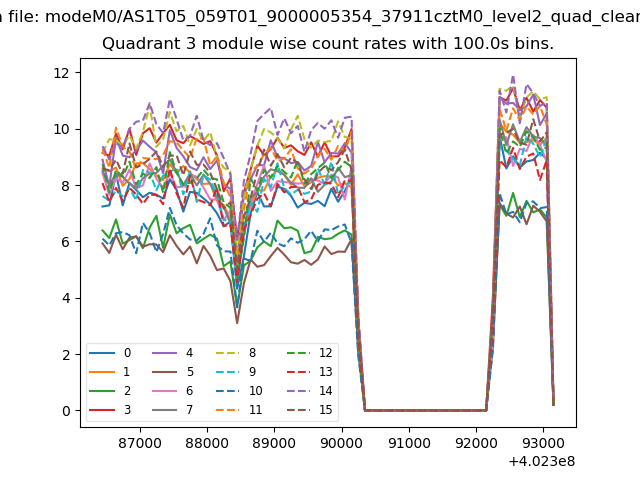
| Module-wise count rates for Quadrant A Data is divided into 100 sec bins |
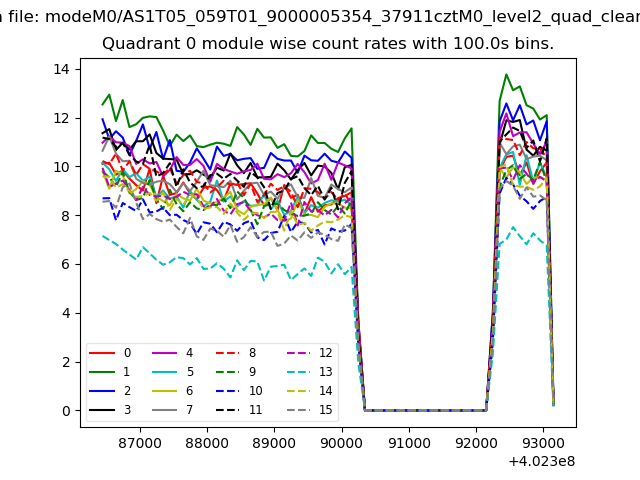 |
 |
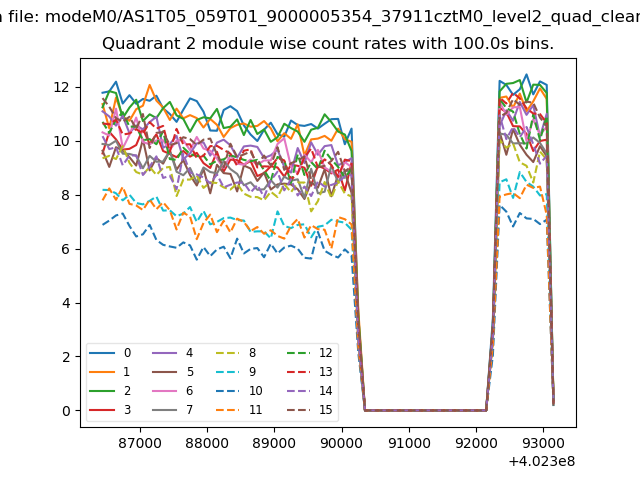
| Module-wise count rates for Quadrant B Data is divided into 100 sec bins |
 |
 |
| Module-wise count rates for Quadrant C Data is divided into 100 sec bins |
 |
 |
| Module-wise count rates for Quadrant D Data is divided into 100 sec bins |
 |
 |
| Parameter | Plot |
|---|---|
| CZT HV Monitor | 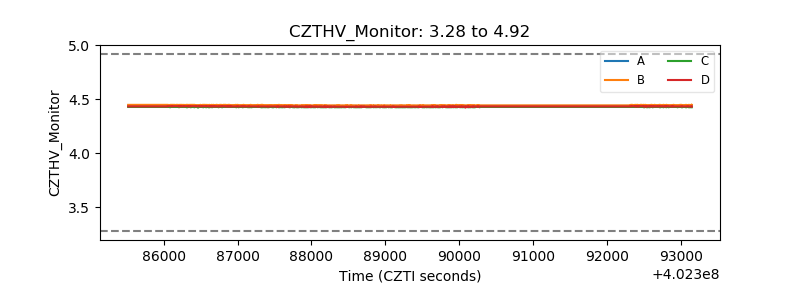 |
| D_VDD | 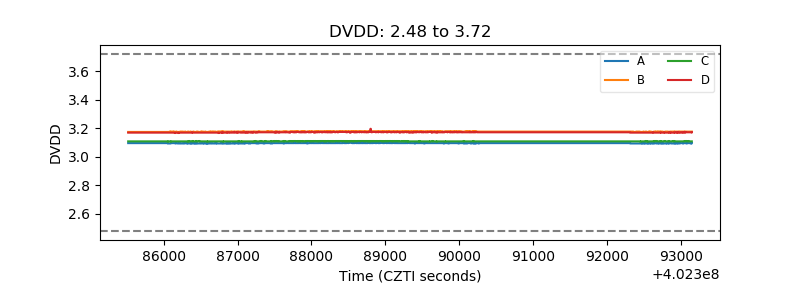 |
| Temperature 1 | 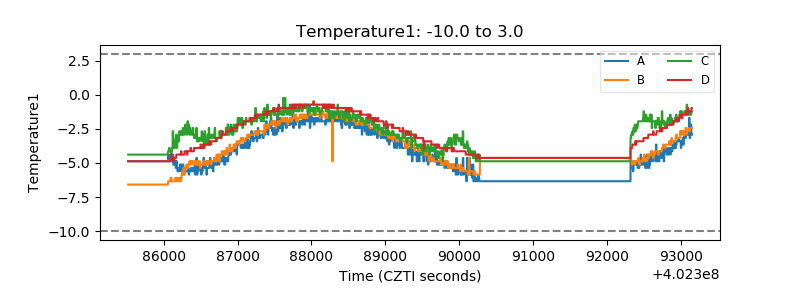 |
| Veto HV Monitor | 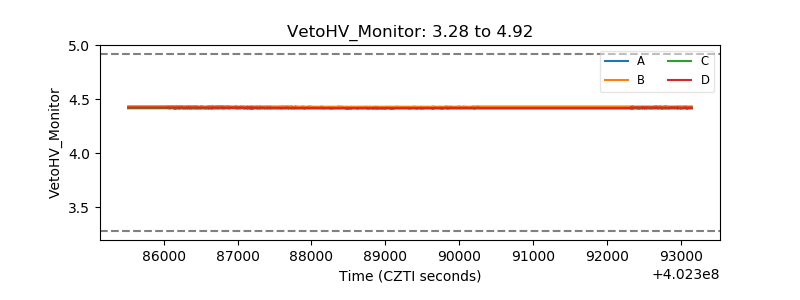 |
| Veto LLD | 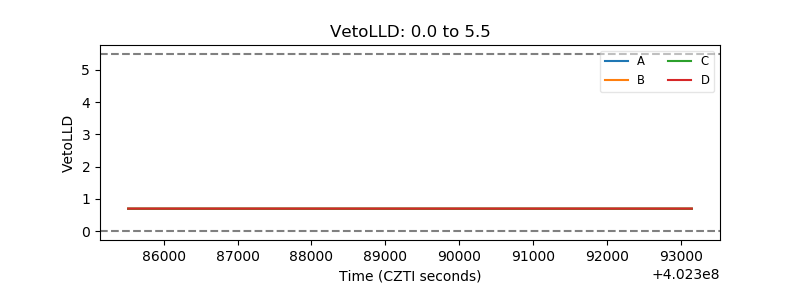 |
| Alpha Counter | 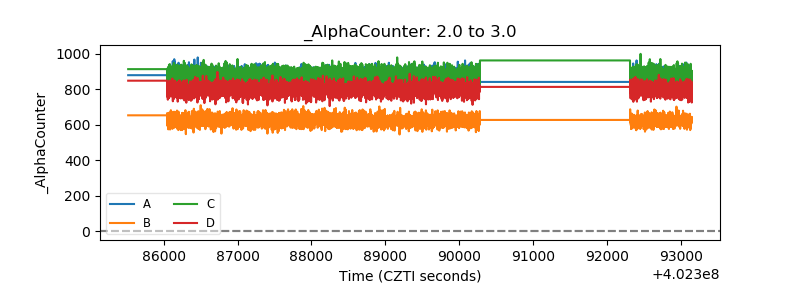 |
| _CPM_Rate | 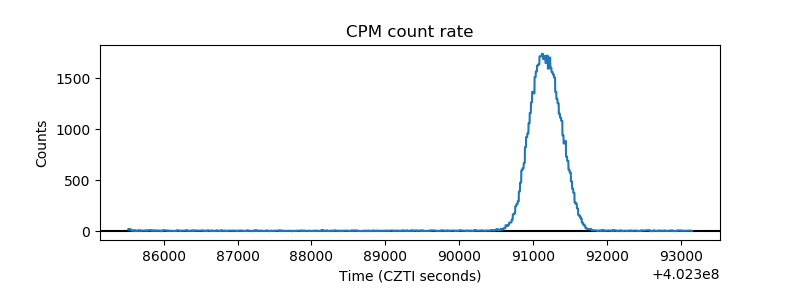 |
| CZT Counter | 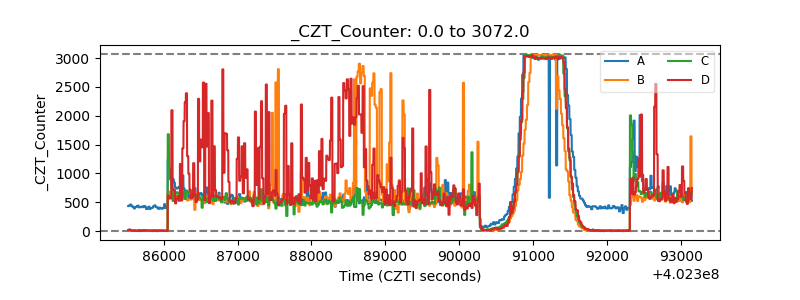 |
| +2.5 Volts monitor | 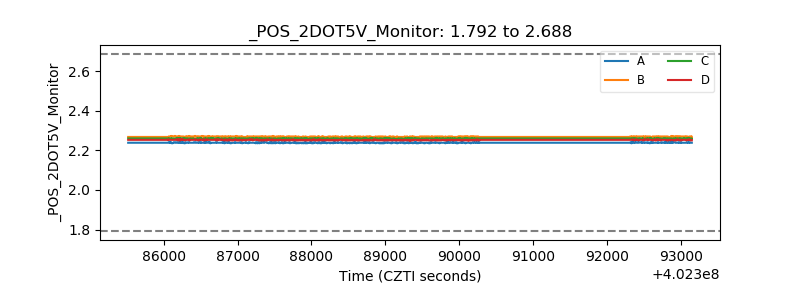 |
| +5 Volts monitor | 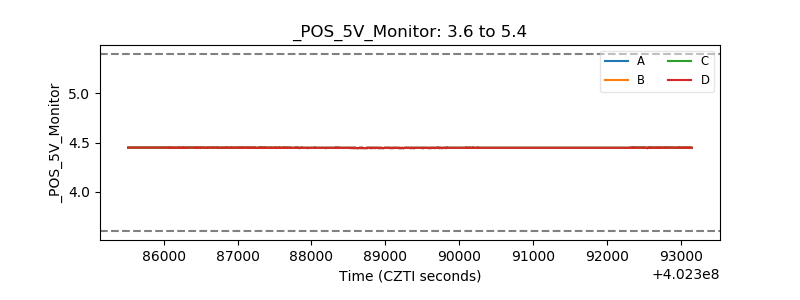 |
| _ROLL_ROT | 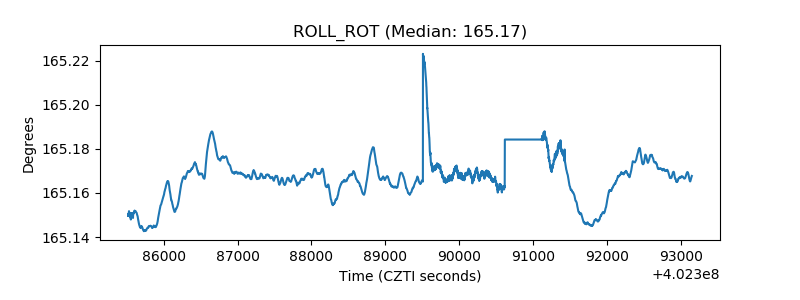 |
| _Roll_DEC | 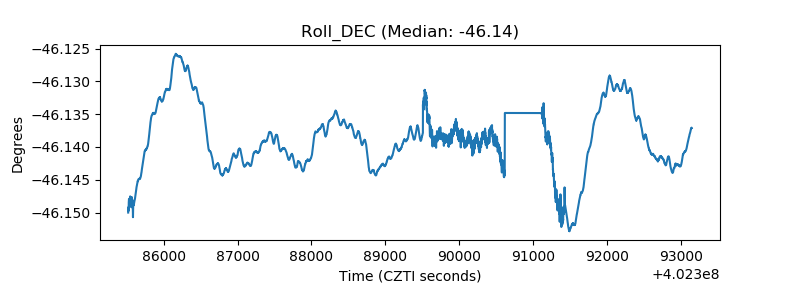 |
| _Roll_RA | 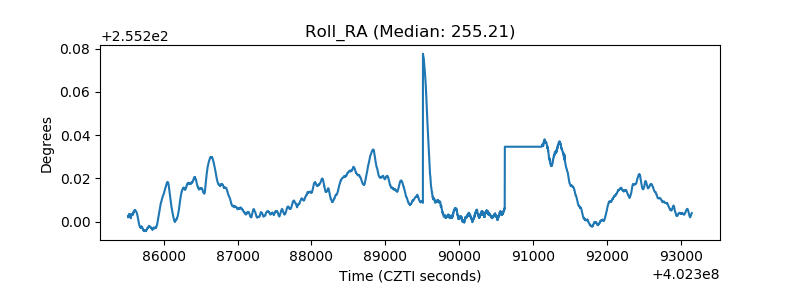 |
| Veto Counter | 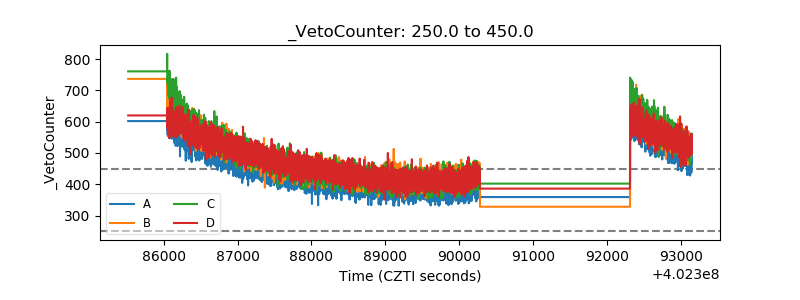 |