| Param | Original file | Final file |
|---|---|---|
| Filename | modeM0/AS1T05_059T01_9000005354_37913cztM0_level2.evt | modeM0/AS1T05_059T01_9000005354_37913cztM0_level2_quad_clean.evt |
| Size (bytes) | 425,145,600 | 95,460,480 |
| Size | 405.5 MB | 91.0 MB |
| Events in quadrant A | 2,873,671 | 644,605 |
| Events in quadrant B | 3,436,720 | 630,995 |
| Events in quadrant C | 2,859,520 | 642,118 |
| Events in quadrant D | 3,350,507 | 607,051 |
| Mode M0 | |||
|---|---|---|---|
| Quadrant | BADHDUFLAG | Total packets | Discarded packets |
| A | 0 | 11634 | 3 |
| B | 0 | 13460 | 2 |
| C | 0 | 11625 | 2 |
| D | 0 | 13302 | 2 |
| Mode SS | |||
|---|---|---|---|
| Quadrant | BADHDUFLAG | Total packets | Discarded packets |
| A | 0 | 108 | 0 |
| B | 0 | 108 | 0 |
| C | 0 | 108 | 0 |
| D | 0 | 108 | 0 |
| Mode M9 | |||
|---|---|---|---|
| Quadrant | BADHDUFLAG | Total packets | Discarded packets |
| A | 0 | 37 | 0 |
| B | 0 | 37 | 0 |
| C | 0 | 37 | 0 |
| D | 0 | 38 | 0 |
| Quadrant | Total seconds | Saturated seconds | Saturation percentage |
|---|---|---|---|
| A | 5222 | 17 | 0.325546% |
| B | 5222 | 226 | 4.327844% |
| C | 5222 | 57 | 1.091536% |
| D | 5222 | 176 | 3.370356% |
Noise dominated data is calculated using 1-second bins in cleaned event files. If a bin has >2000 counts, and if more than 50% of those come from <1% of pixels, then it is considered to be noise-dominated and hence unusable.
| Quadrant | # 1 sec bins | Bins with >0 counts | Bins with >2000 counts | High rate bins dominated by noise | Noise dominated (total time) | Noise dominated (detector-on time) | Marked lightcurve |
|---|---|---|---|---|---|---|---|
| A | 7344 | 5223 | 10 | 10 | 0.14% | 0.19% | 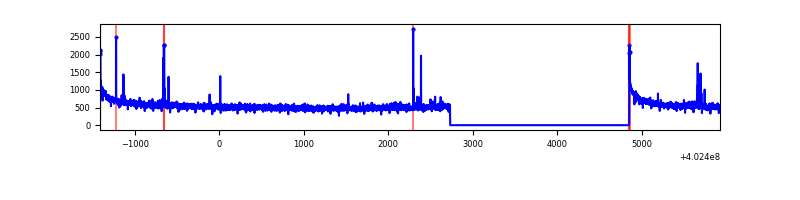 |
| B | 7344 | 5223 | 147 | 147 | 2.00% | 2.81% | 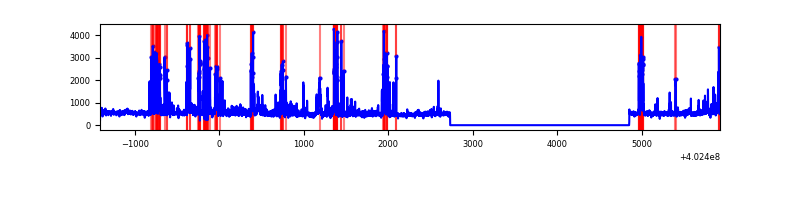 |
| C | 7344 | 5223 | 42 | 42 | 0.57% | 0.80% | 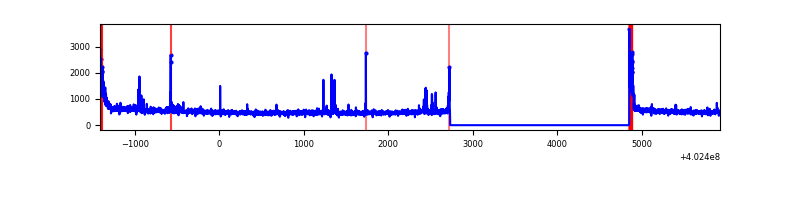 |
| D | 7344 | 5223 | 142 | 142 | 1.93% | 2.72% | 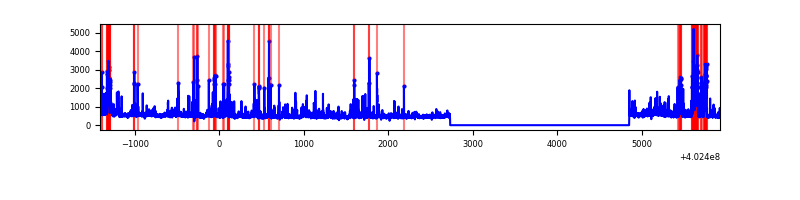 |
Top three noisy pixels from each quadrant. If the there are fewer than three noisy pixels in the level2.evt file, extra rows are filled as -1
| Pixel properties | Quadrant properties | ||||||
|---|---|---|---|---|---|---|---|
| Quadrant | DetID | PixID | Counts | Sigma | Mean | Median | Sigma |
| A | 10 | 83 | 362911 | 2863.18 | 629 | 619 | 126.5 |
| A | 13 | 248 | 32236 | 249.87 | 629 | 619 | 126.5 |
| A | 12 | 189 | 24391 | 187.87 | 629 | 619 | 126.5 |
| B | 5 | 172 | 732736 | 6362.85 | 608 | 595 | 115.1 |
| B | 0 | 230 | 75610 | 651.94 | 608 | 595 | 115.1 |
| B | 0 | 189 | 51906 | 445.93 | 608 | 595 | 115.1 |
| C | 15 | 214 | 222686 | 1611.37 | 599 | 607 | 137.8 |
| C | 0 | 10 | 189518 | 1370.71 | 599 | 607 | 137.8 |
| C | 14 | 254 | 90426 | 651.71 | 599 | 607 | 137.8 |
| D | 1 | 52 | 334009 | 2261.31 | 605 | 591 | 147.4 |
| D | 2 | 250 | 182122 | 1231.18 | 605 | 591 | 147.4 |
| D | 2 | 249 | 120971 | 816.44 | 605 | 591 | 147.4 |
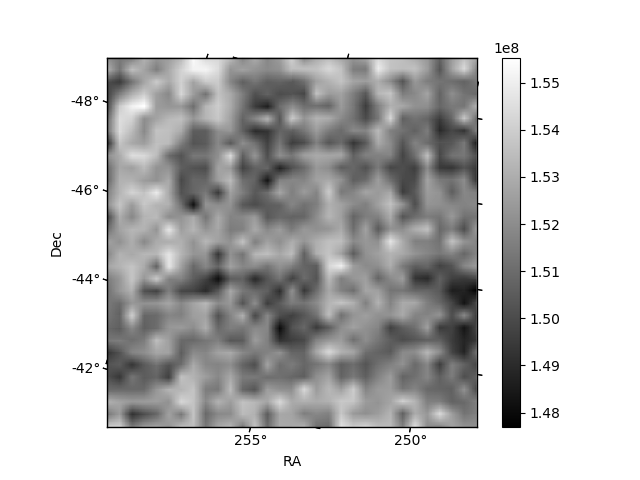
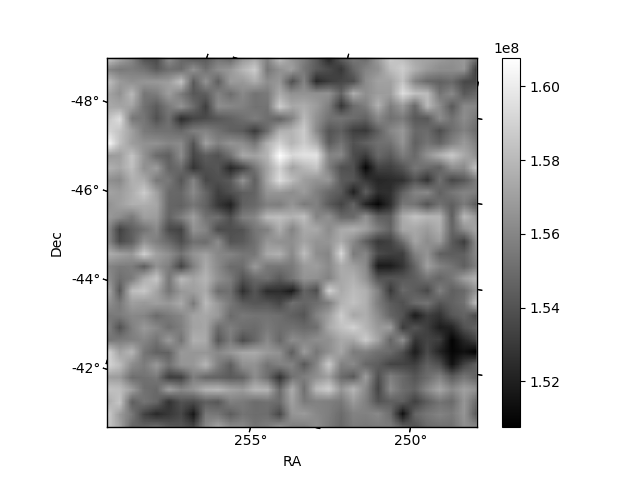
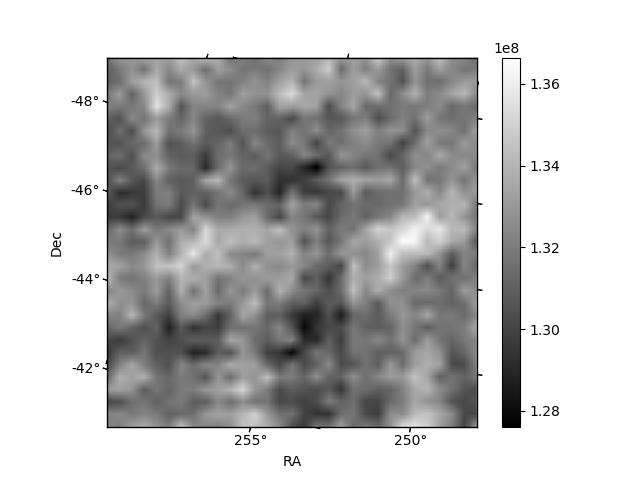
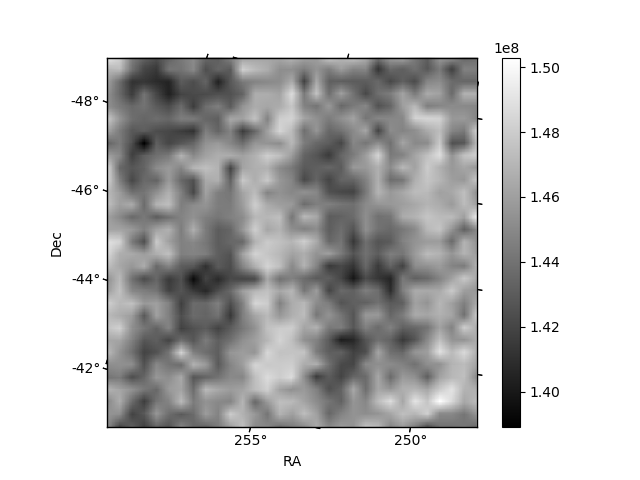
Histogram calculated using DETX and DETY for each event in the final _common_clean file
| Quadrant A | 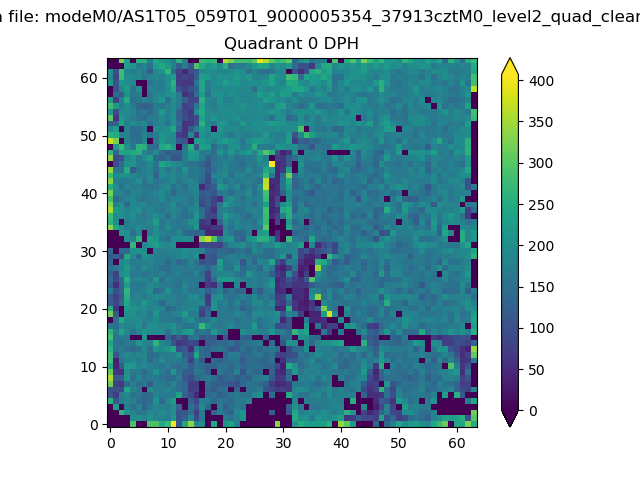 |
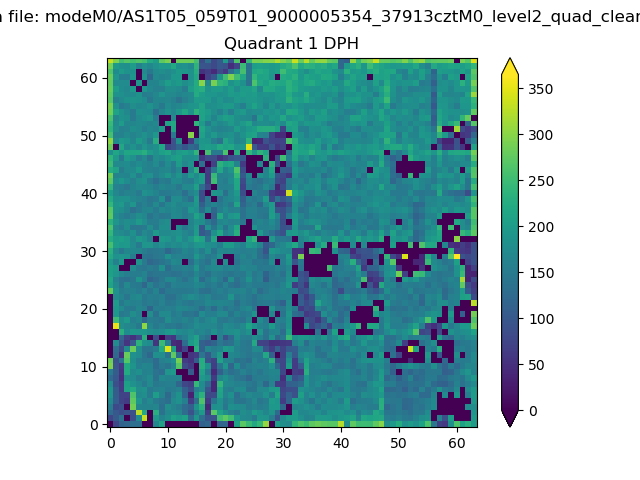 |
Quadrant B |
|---|---|---|---|
| Quadrant D | 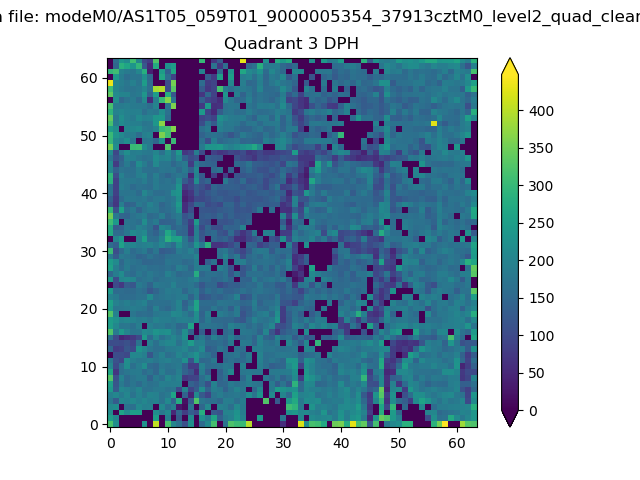 |
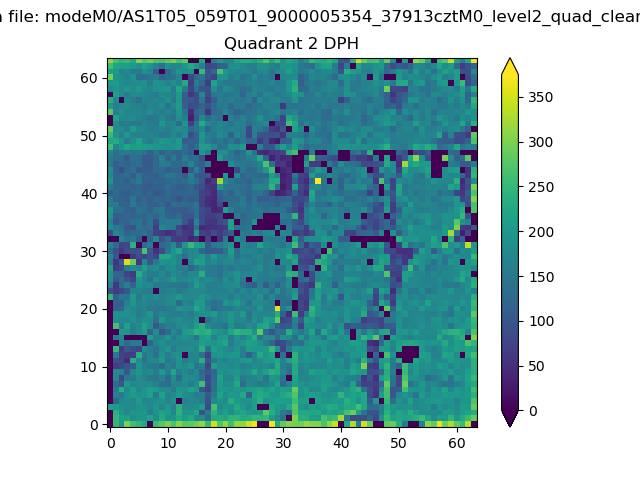 |
Quadrant C |
| Plot type | Count rate plots | Images |
|---|---|---|
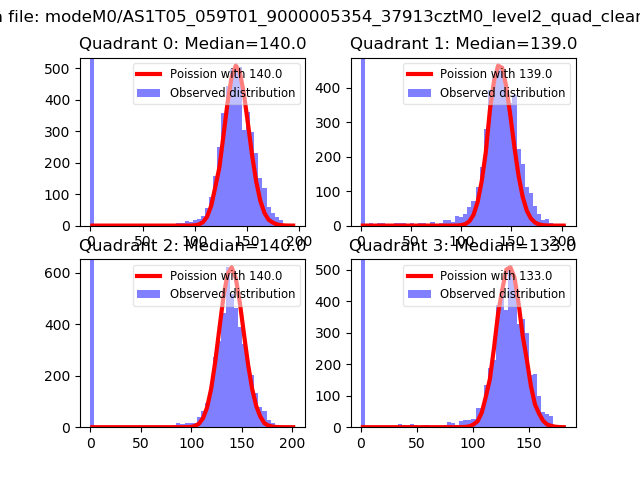
| Comparison with Poisson distribution Blue bars denote a histogram of data divided into 1 sec bins. Red curve is a Poisson curve with rate = median count rate of data. |
 |
 |
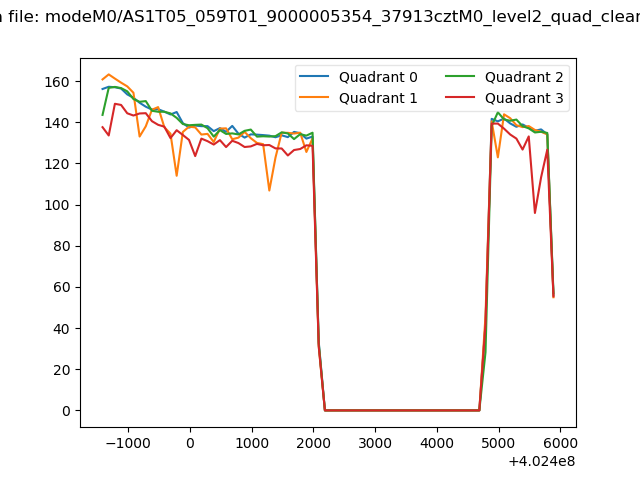
| Quadrant-wise count rates Data is divided into 100 sec bins |
 |
|
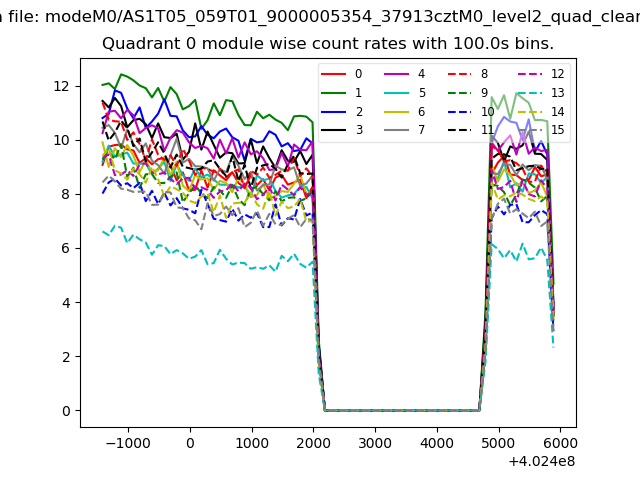
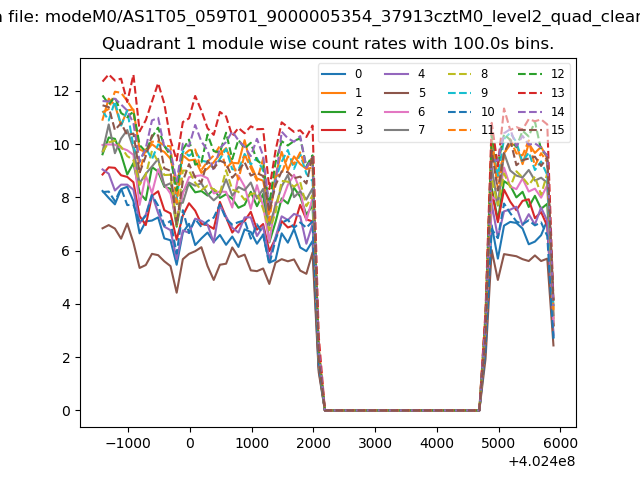
| Module-wise count rates for Quadrant A Data is divided into 100 sec bins |
 |
 |
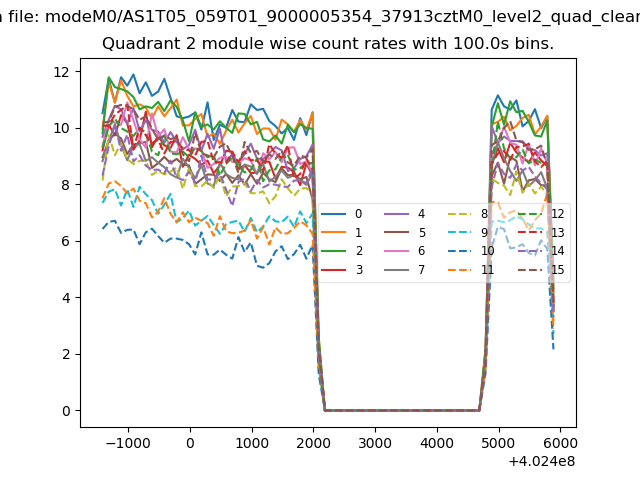
| Module-wise count rates for Quadrant B Data is divided into 100 sec bins |
 |
 |
| Module-wise count rates for Quadrant C Data is divided into 100 sec bins |
 |
 |
| Module-wise count rates for Quadrant D Data is divided into 100 sec bins |
 |
 |
| Parameter | Plot |
|---|---|
| CZT HV Monitor | 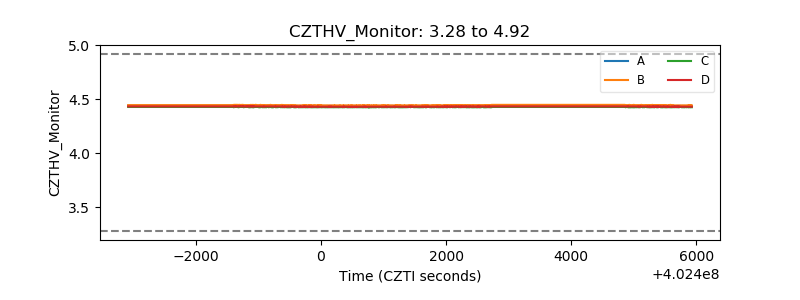 |
| D_VDD | 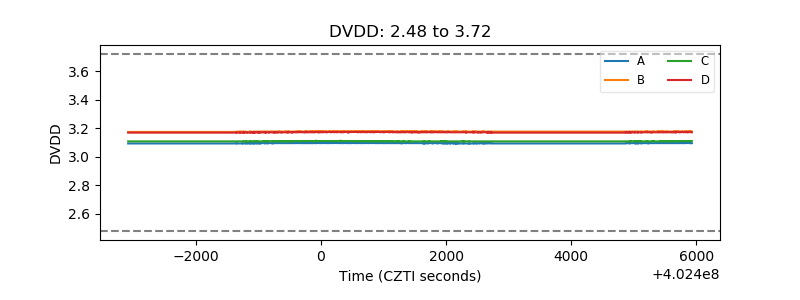 |
| Temperature 1 | 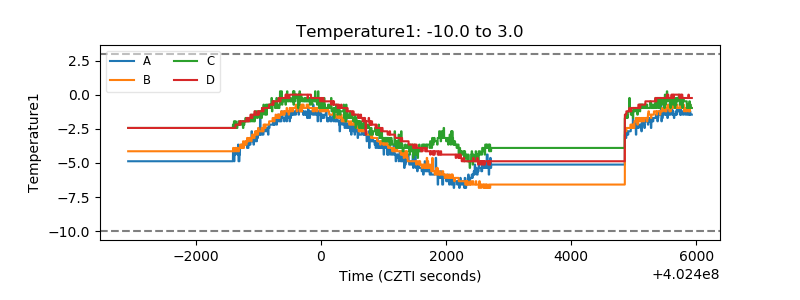 |
| Veto HV Monitor | 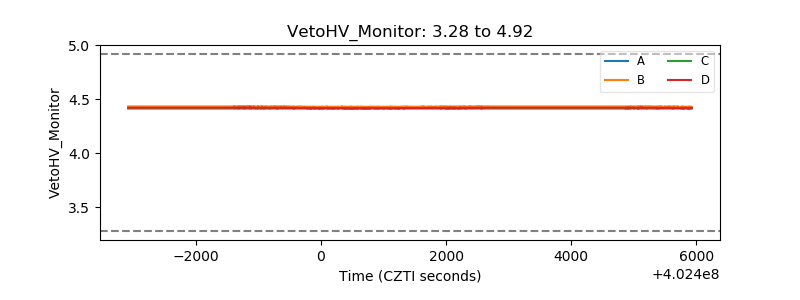 |
| Veto LLD | 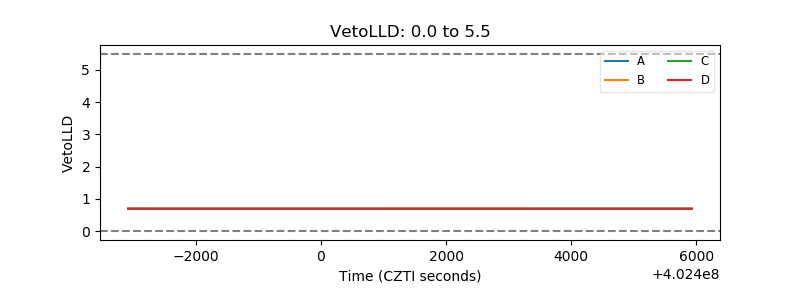 |
| Alpha Counter | 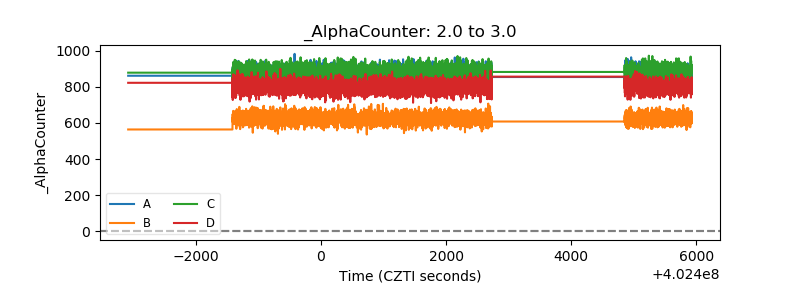 |
| _CPM_Rate | 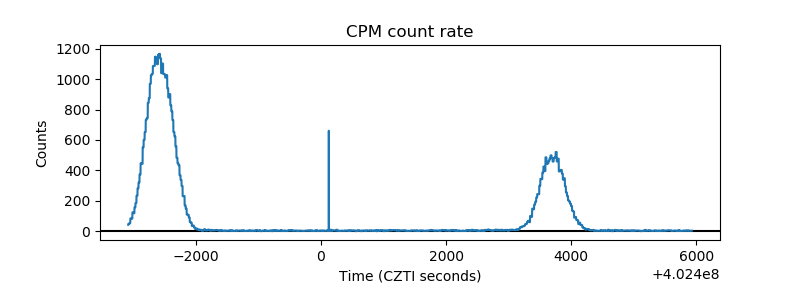 |
| CZT Counter | 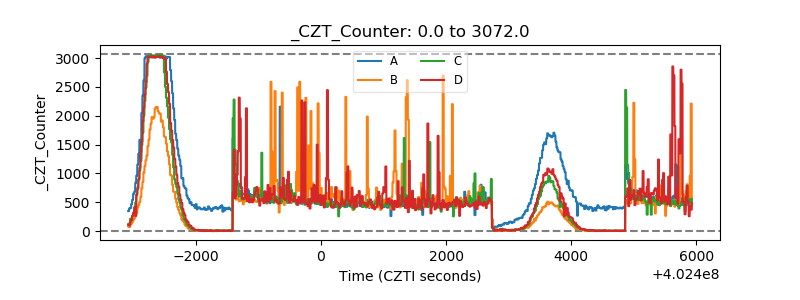 |
| +2.5 Volts monitor |  |
| +5 Volts monitor |  |
| _ROLL_ROT | 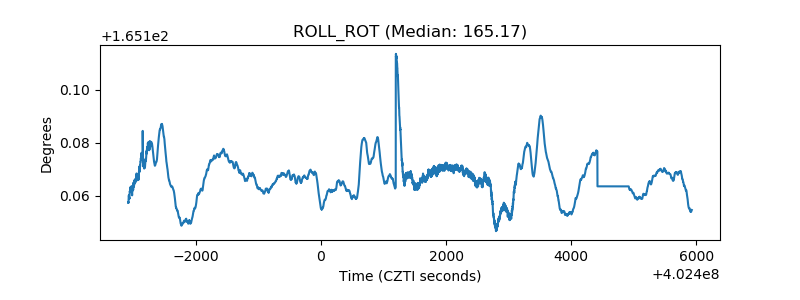 |
| _Roll_DEC | 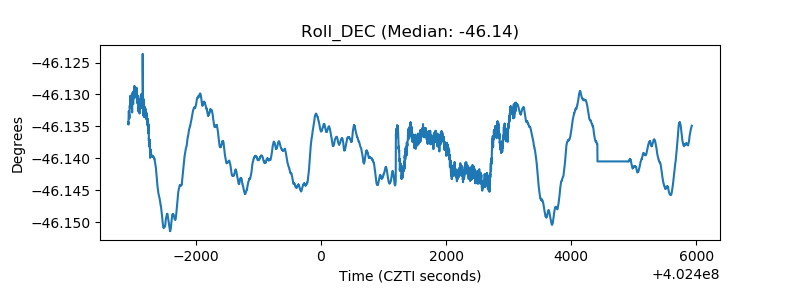 |
| _Roll_RA | 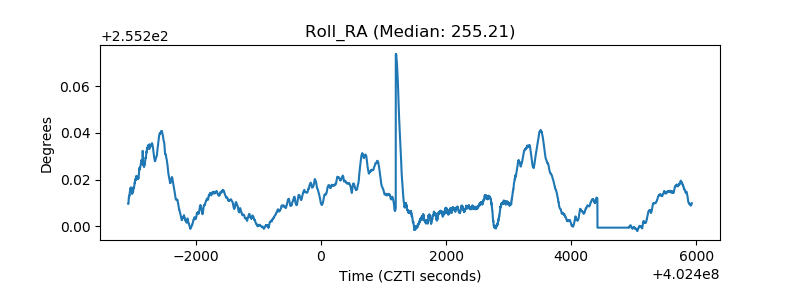 |
| Veto Counter | 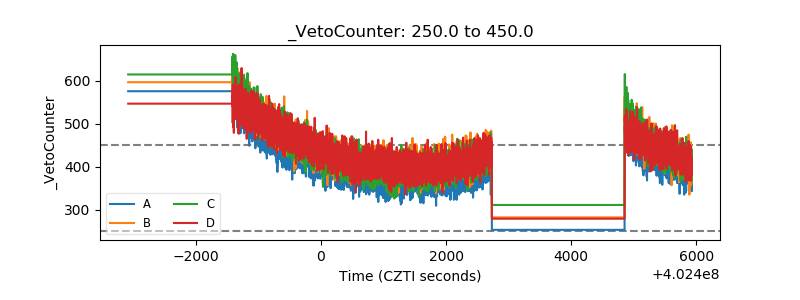 |