| Param | Original file | Final file |
|---|---|---|
| Filename | modeM0/AS1T05_059T01_9000005354_37914cztM0_level2.evt | modeM0/AS1T05_059T01_9000005354_37914cztM0_level2_quad_clean.evt |
| Size (bytes) | 449,809,920 | 80,688,960 |
| Size | 429.0 MB | 77.0 MB |
| Events in quadrant A | 2,730,467 | 532,602 |
| Events in quadrant B | 3,460,175 | 516,265 |
| Events in quadrant C | 2,587,491 | 532,709 |
| Events in quadrant D | 4,488,598 | 494,748 |
| Mode M0 | |||
|---|---|---|---|
| Quadrant | BADHDUFLAG | Total packets | Discarded packets |
| A | 0 | 11284 | 2 |
| B | 0 | 13647 | 1 |
| C | 0 | 10908 | 1 |
| D | 0 | 16824 | 1 |
| Mode SS | |||
|---|---|---|---|
| Quadrant | BADHDUFLAG | Total packets | Discarded packets |
| A | 0 | 106 | 0 |
| B | 0 | 106 | 0 |
| C | 0 | 106 | 0 |
| D | 0 | 106 | 0 |
| Mode M9 | |||
|---|---|---|---|
| Quadrant | BADHDUFLAG | Total packets | Discarded packets |
| A | 0 | 20 | 0 |
| B | 0 | 20 | 0 |
| C | 0 | 20 | 0 |
| D | 0 | 20 | 0 |
| Quadrant | Total seconds | Saturated seconds | Saturation percentage |
|---|---|---|---|
| A | 5243 | 10 | 0.190730% |
| B | 5243 | 255 | 4.863628% |
| C | 5243 | 14 | 0.267023% |
| D | 5243 | 438 | 8.353996% |
Noise dominated data is calculated using 1-second bins in cleaned event files. If a bin has >2000 counts, and if more than 50% of those come from <1% of pixels, then it is considered to be noise-dominated and hence unusable.
| Quadrant | # 1 sec bins | Bins with >0 counts | Bins with >2000 counts | High rate bins dominated by noise | Noise dominated (total time) | Noise dominated (detector-on time) | Marked lightcurve |
|---|---|---|---|---|---|---|---|
| A | 7245 | 5244 | 4 | 4 | 0.06% | 0.08% | 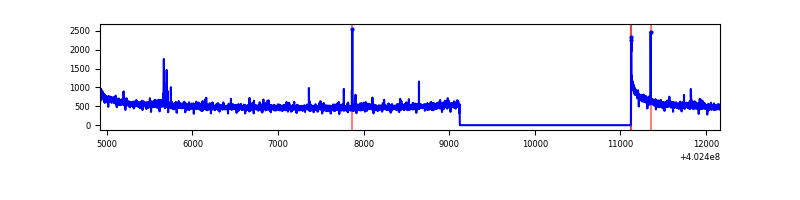 |
| B | 7245 | 5244 | 184 | 184 | 2.54% | 3.51% | 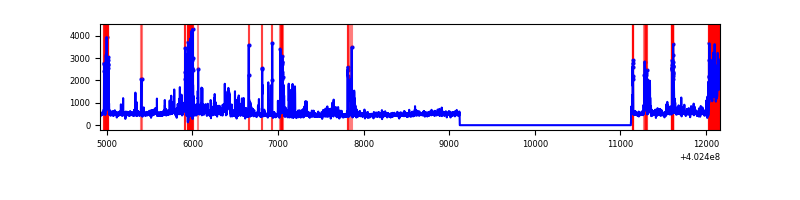 |
| C | 7245 | 5244 | 8 | 8 | 0.11% | 0.15% | 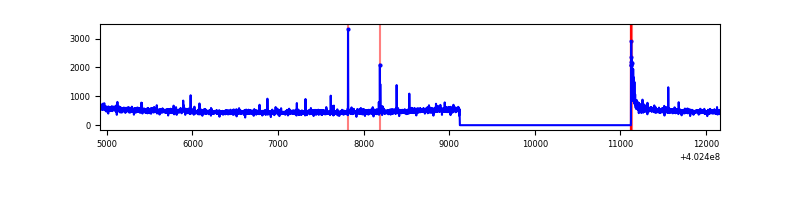 |
| D | 7245 | 5244 | 442 | 442 | 6.10% | 8.43% | 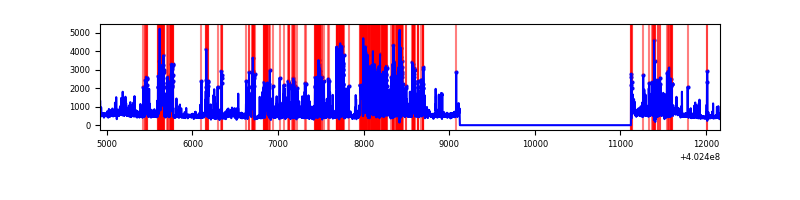 |
Top three noisy pixels from each quadrant. If the there are fewer than three noisy pixels in the level2.evt file, extra rows are filled as -1
| Pixel properties | Quadrant properties | ||||||
|---|---|---|---|---|---|---|---|
| Quadrant | DetID | PixID | Counts | Sigma | Mean | Median | Sigma |
| A | 10 | 83 | 341591 | 2795.98 | 601 | 591 | 122.0 |
| A | 12 | 189 | 19940 | 158.65 | 601 | 591 | 122.0 |
| A | 13 | 6 | 15207 | 119.84 | 601 | 591 | 122.0 |
| B | 5 | 172 | 806411 | 7276.02 | 580 | 566 | 110.8 |
| B | 0 | 229 | 108516 | 974.69 | 580 | 566 | 110.8 |
| B | 0 | 230 | 104469 | 938.15 | 580 | 566 | 110.8 |
| C | 15 | 214 | 224206 | 1685.66 | 574 | 579 | 132.7 |
| C | 0 | 10 | 69664 | 520.75 | 574 | 579 | 132.7 |
| C | 14 | 254 | 34480 | 255.54 | 574 | 579 | 132.7 |
| D | 12 | 227 | 869029 | 6260.1 | 563 | 548 | 138.7 |
| D | 1 | 52 | 613616 | 4419.06 | 563 | 548 | 138.7 |
| D | 2 | 250 | 256809 | 1847.15 | 563 | 548 | 138.7 |
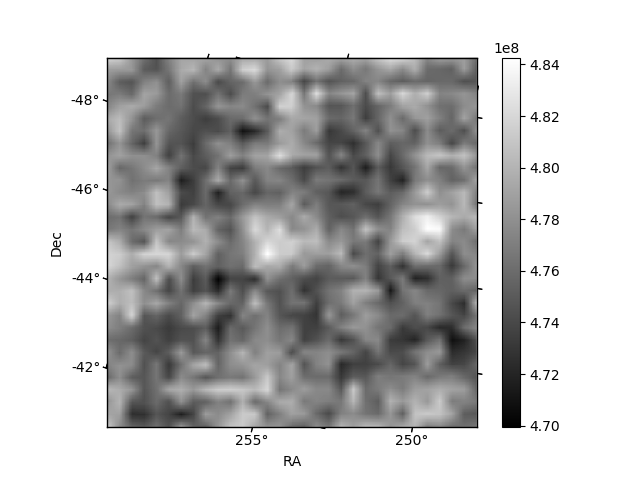
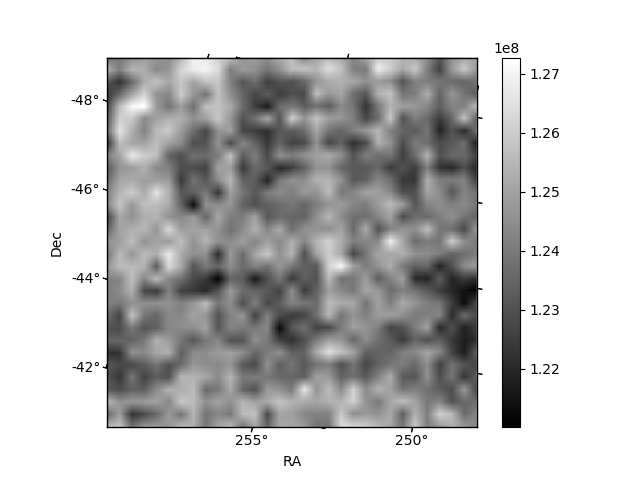
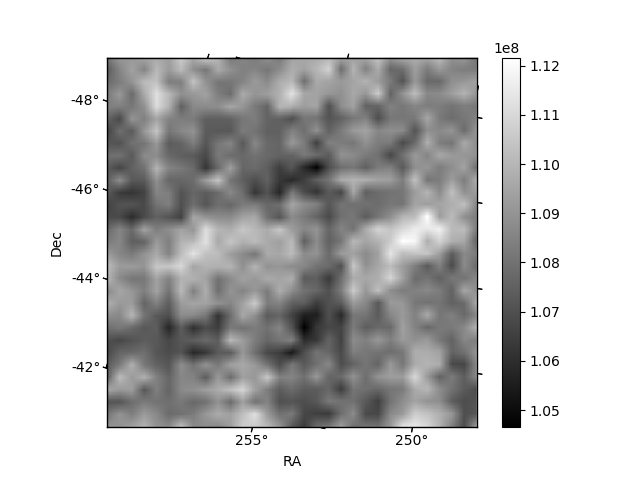
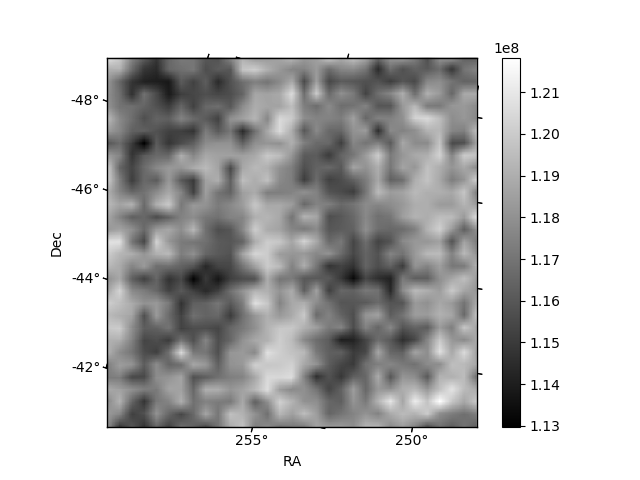
Histogram calculated using DETX and DETY for each event in the final _common_clean file
| Quadrant A | 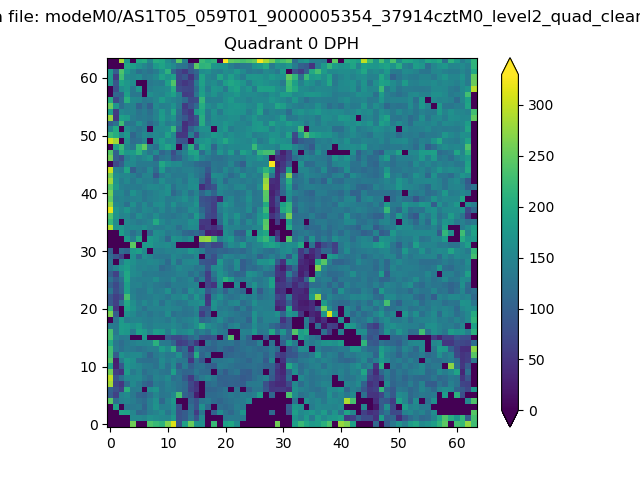 |
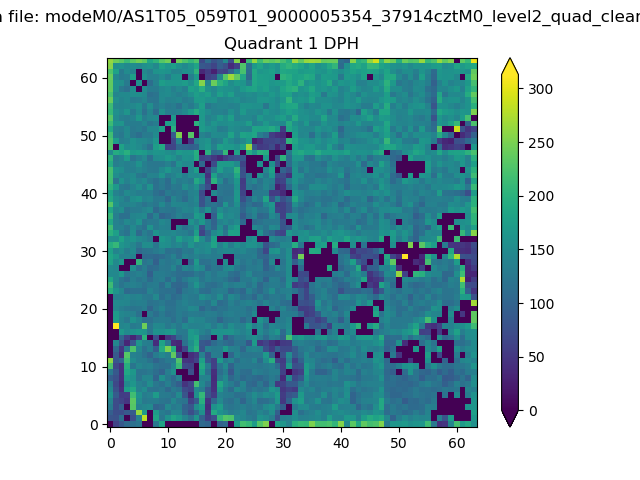 |
Quadrant B |
|---|---|---|---|
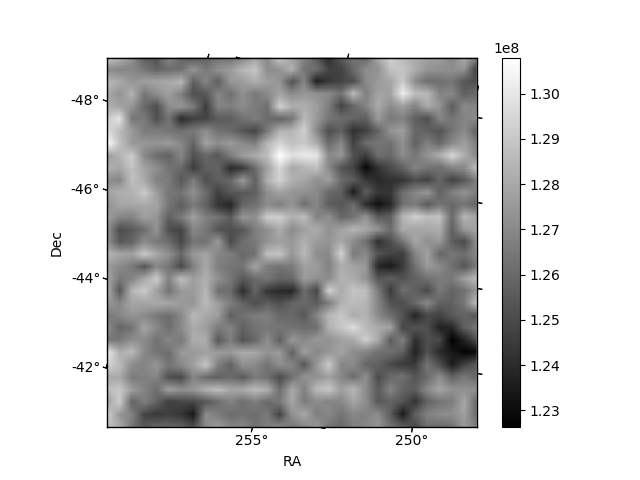
| Quadrant D | 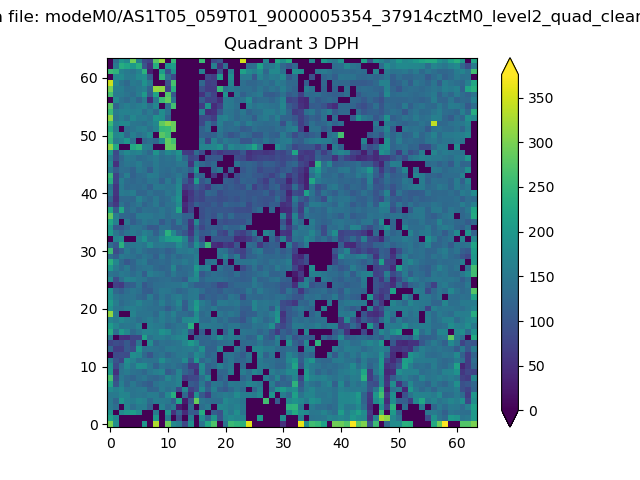 |
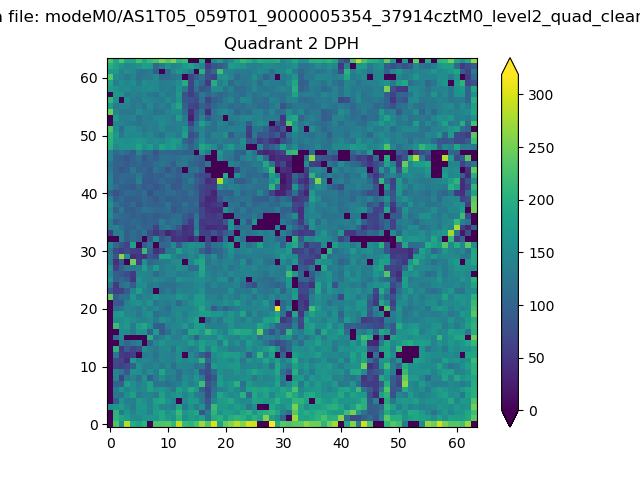 |
Quadrant C |
| Plot type | Count rate plots | Images |
|---|---|---|
| Comparison with Poisson distribution Blue bars denote a histogram of data divided into 1 sec bins. Red curve is a Poisson curve with rate = median count rate of data. |
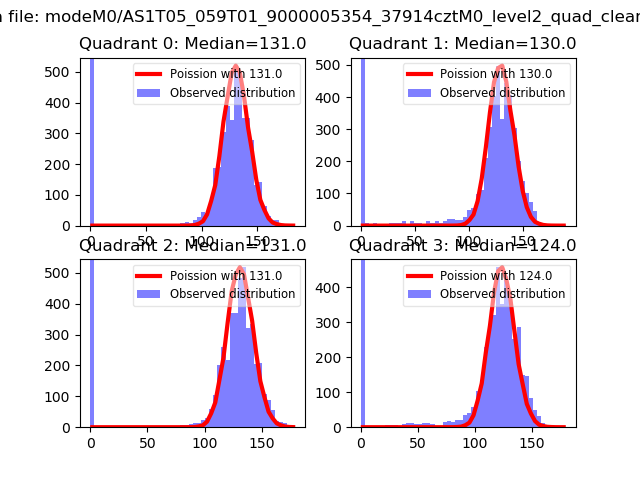 |
 |
| Quadrant-wise count rates Data is divided into 100 sec bins |
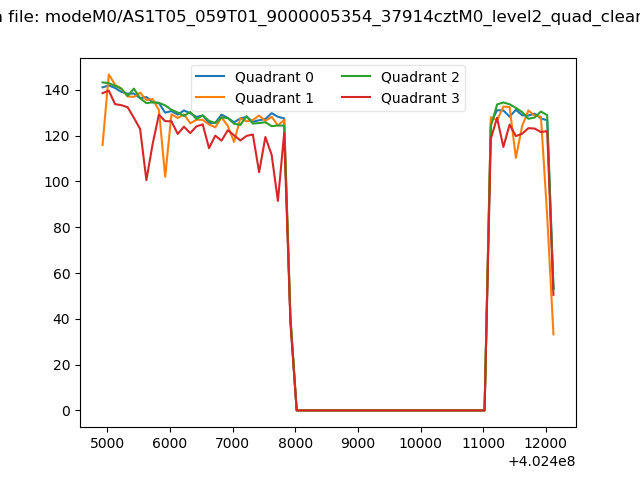 |
|
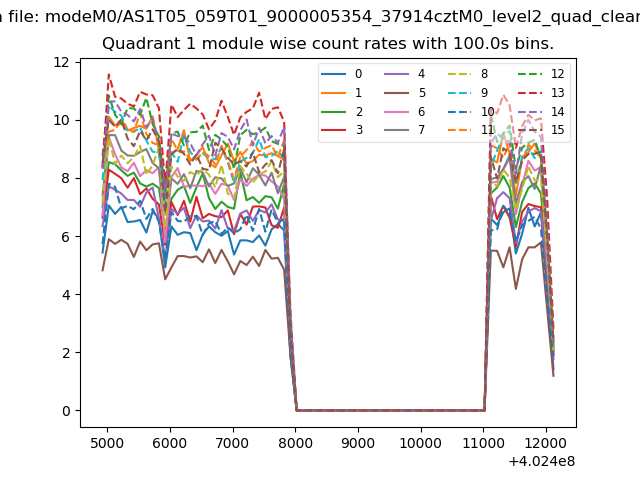
| Module-wise count rates for Quadrant A Data is divided into 100 sec bins |
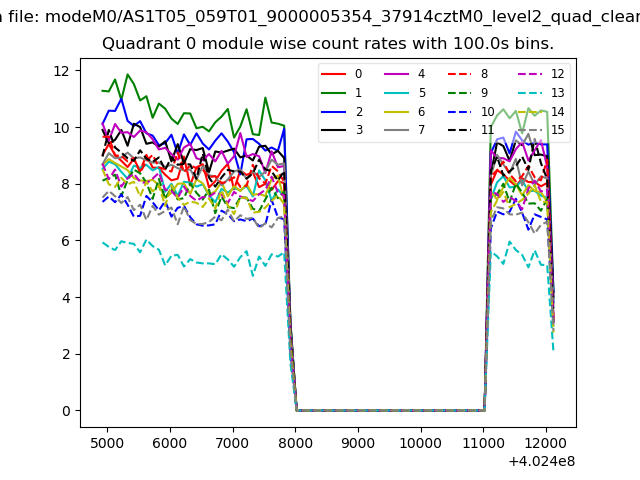 |
 |
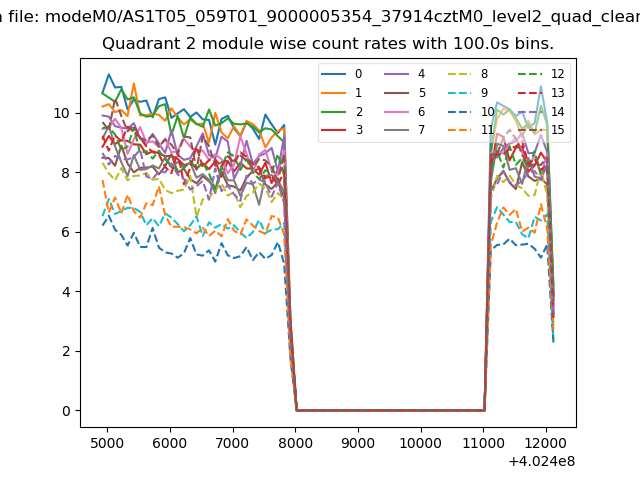
| Module-wise count rates for Quadrant B Data is divided into 100 sec bins |
 |
 |
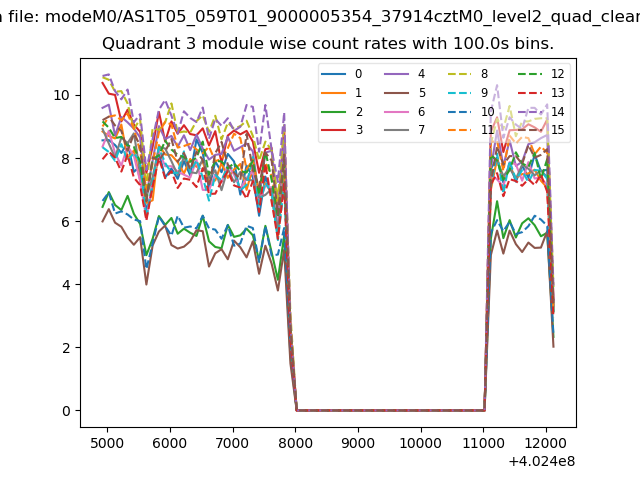
| Module-wise count rates for Quadrant C Data is divided into 100 sec bins |
 |
 |
| Module-wise count rates for Quadrant D Data is divided into 100 sec bins |
 |
 |
| Parameter | Plot |
|---|---|
| CZT HV Monitor | 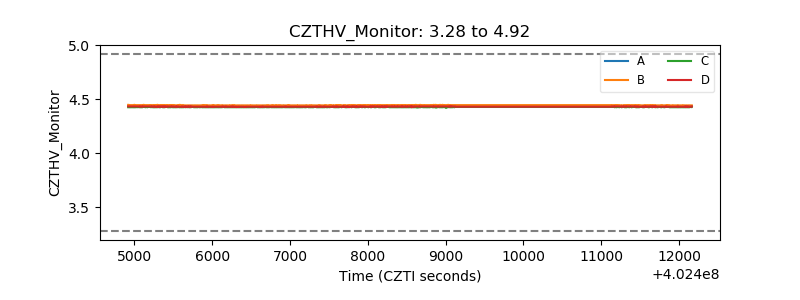 |
| D_VDD | 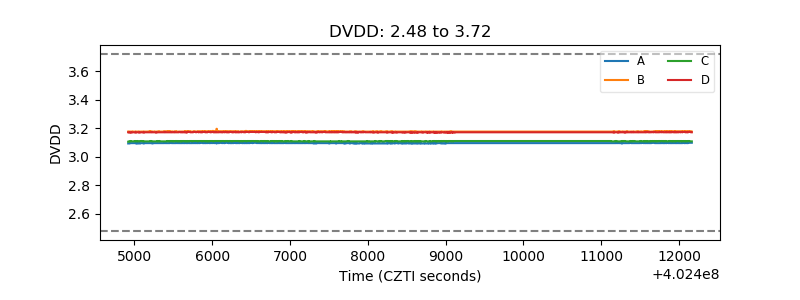 |
| Temperature 1 | 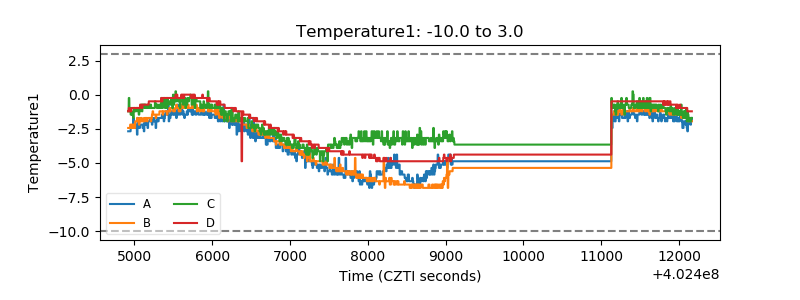 |
| Veto HV Monitor | 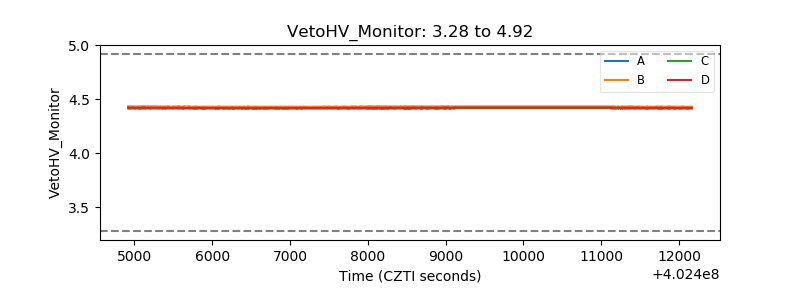 |
| Veto LLD | 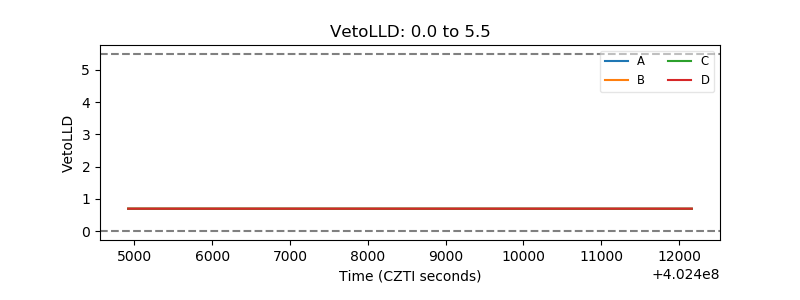 |
| Alpha Counter | 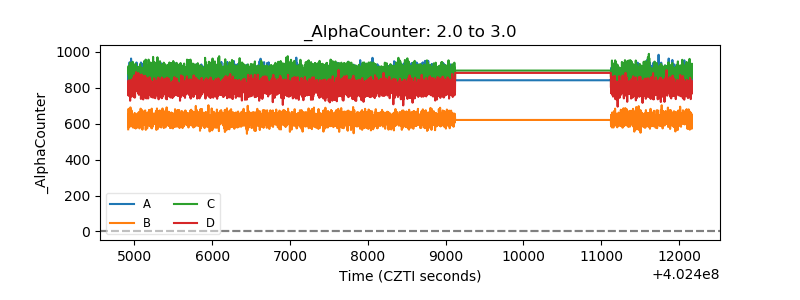 |
| _CPM_Rate | 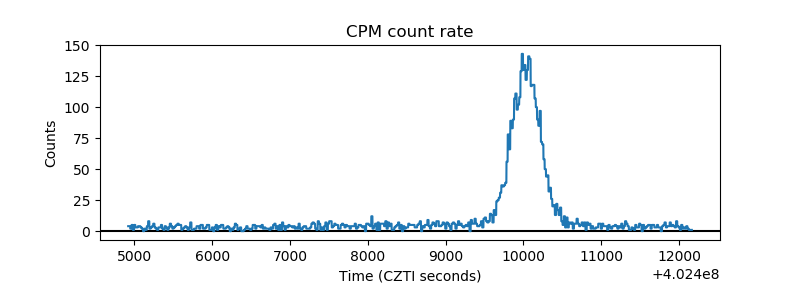 |
| CZT Counter | 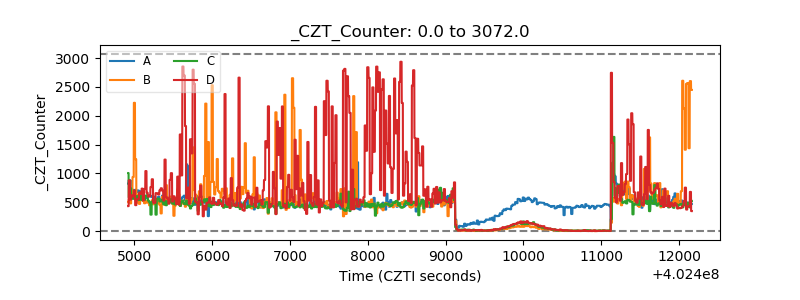 |
| +2.5 Volts monitor | 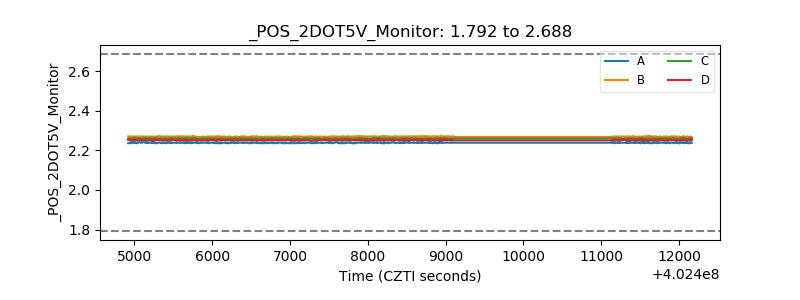 |
| +5 Volts monitor |  |
| _ROLL_ROT | 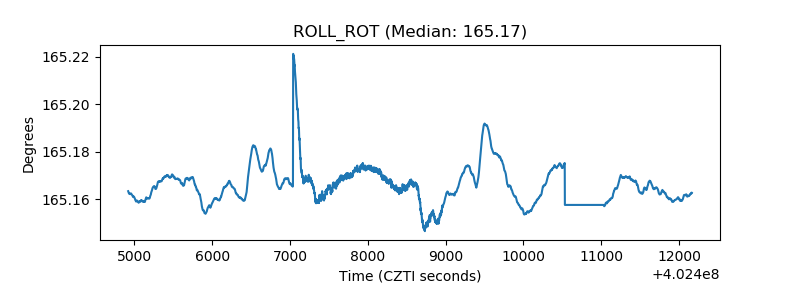 |
| _Roll_DEC | 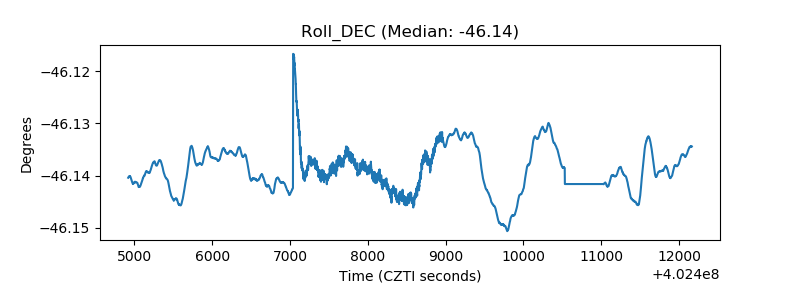 |
| _Roll_RA | 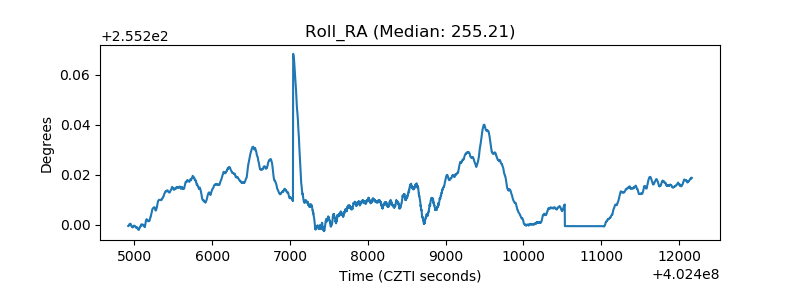 |
| Veto Counter | 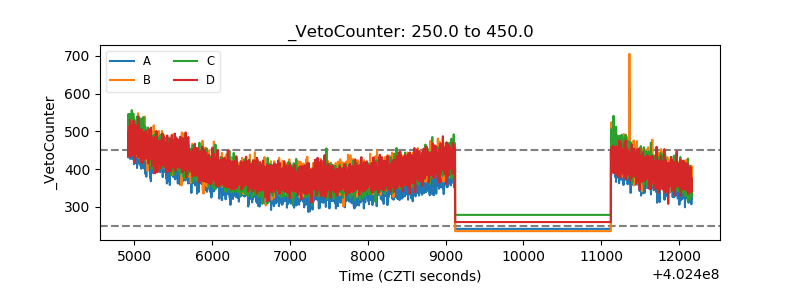 |