| Param | Original file | Final file |
|---|---|---|
| Filename | modeM0/AS1T05_059T01_9000005354_37915cztM0_level2.evt | modeM0/AS1T05_059T01_9000005354_37915cztM0_level2_quad_clean.evt |
| Size (bytes) | 454,302,720 | 70,744,320 |
| Size | 433.3 MB | 67.5 MB |
| Events in quadrant A | 2,829,446 | 451,456 |
| Events in quadrant B | 3,856,995 | 432,038 |
| Events in quadrant C | 2,712,677 | 455,394 |
| Events in quadrant D | 3,986,793 | 418,854 |
| Mode M0 | |||
|---|---|---|---|
| Quadrant | BADHDUFLAG | Total packets | Discarded packets |
| A | 0 | 11743 | 3 |
| B | 0 | 15059 | 2 |
| C | 0 | 11509 | 2 |
| D | 0 | 15645 | 2 |
| Mode SS | |||
|---|---|---|---|
| Quadrant | BADHDUFLAG | Total packets | Discarded packets |
| A | 0 | 112 | 0 |
| B | 0 | 112 | 0 |
| C | 0 | 112 | 0 |
| D | 0 | 112 | 0 |
| Mode M9 | |||
|---|---|---|---|
| Quadrant | BADHDUFLAG | Total packets | Discarded packets |
| A | 0 | 16 | 0 |
| B | 0 | 16 | 0 |
| C | 0 | 16 | 0 |
| D | 0 | 17 | 0 |
| Quadrant | Total seconds | Saturated seconds | Saturation percentage |
|---|---|---|---|
| A | 5487 | 12 | 0.218699% |
| B | 5487 | 350 | 6.378713% |
| C | 5487 | 26 | 0.473847% |
| D | 5487 | 291 | 5.303445% |
Noise dominated data is calculated using 1-second bins in cleaned event files. If a bin has >2000 counts, and if more than 50% of those come from <1% of pixels, then it is considered to be noise-dominated and hence unusable.
| Quadrant | # 1 sec bins | Bins with >0 counts | Bins with >2000 counts | High rate bins dominated by noise | Noise dominated (total time) | Noise dominated (detector-on time) | Marked lightcurve |
|---|---|---|---|---|---|---|---|
| A | 7160 | 5488 | 6 | 6 | 0.08% | 0.11% | 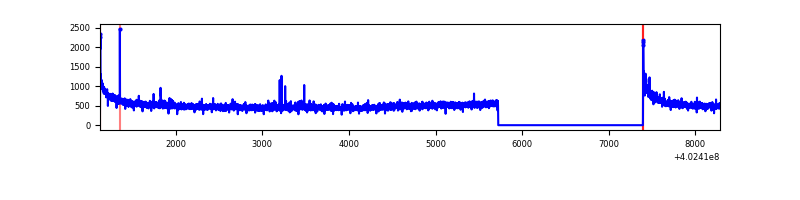 |
| B | 7160 | 5488 | 258 | 258 | 3.60% | 4.70% | 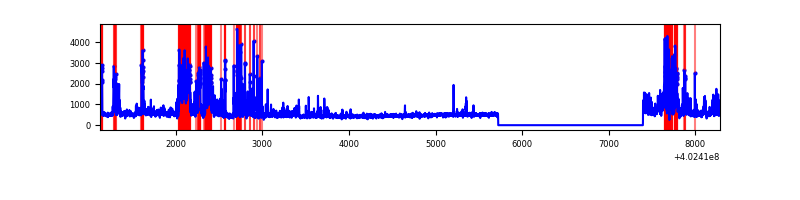 |
| C | 7160 | 5488 | 17 | 17 | 0.24% | 0.31% | 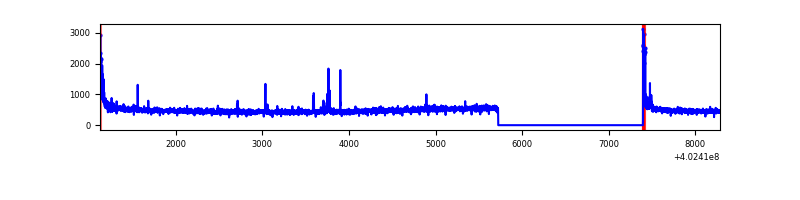 |
| D | 7160 | 5488 | 284 | 284 | 3.97% | 5.17% | 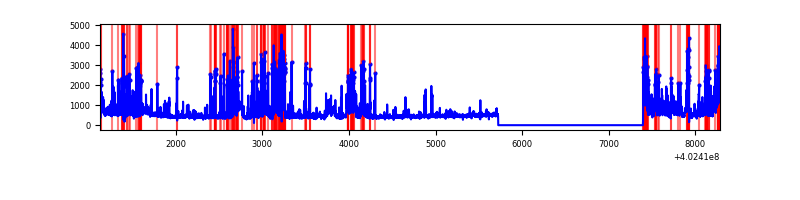 |
Top three noisy pixels from each quadrant. If the there are fewer than three noisy pixels in the level2.evt file, extra rows are filled as -1
| Pixel properties | Quadrant properties | ||||||
|---|---|---|---|---|---|---|---|
| Quadrant | DetID | PixID | Counts | Sigma | Mean | Median | Sigma |
| A | 10 | 83 | 377637 | 3009.67 | 615 | 605 | 125.3 |
| A | 12 | 189 | 27569 | 215.24 | 615 | 605 | 125.3 |
| A | 13 | 6 | 18197 | 140.43 | 615 | 605 | 125.3 |
| B | 5 | 172 | 1056391 | 9137.49 | 598 | 583 | 115.5 |
| B | 0 | 229 | 163091 | 1406.42 | 598 | 583 | 115.5 |
| B | 0 | 230 | 102182 | 879.29 | 598 | 583 | 115.5 |
| C | 15 | 214 | 231420 | 1663.65 | 592 | 596 | 138.7 |
| C | 0 | 10 | 122721 | 880.21 | 592 | 596 | 138.7 |
| C | 15 | 159 | 20320 | 142.16 | 592 | 596 | 138.7 |
| D | 1 | 52 | 702865 | 4819.91 | 584 | 567 | 145.7 |
| D | 13 | 171 | 344013 | 2357.09 | 584 | 567 | 145.7 |
| D | 2 | 249 | 160656 | 1098.7 | 584 | 567 | 145.7 |
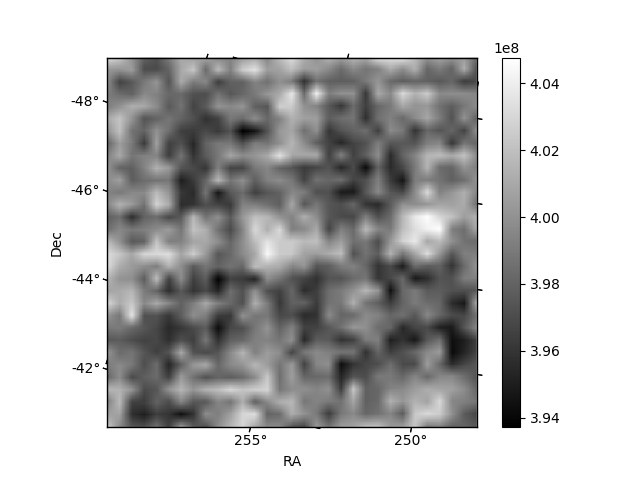
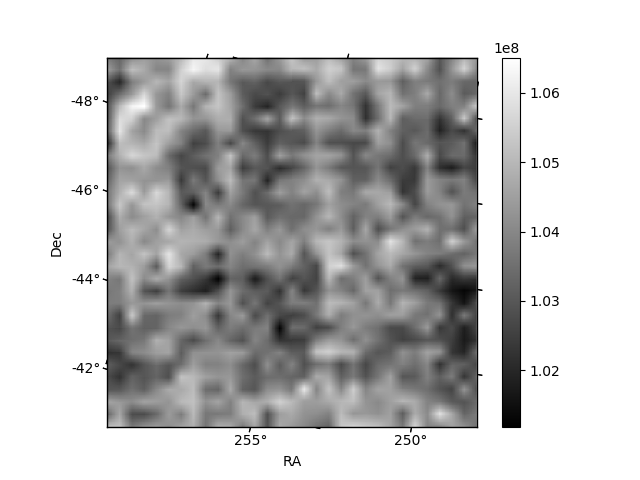
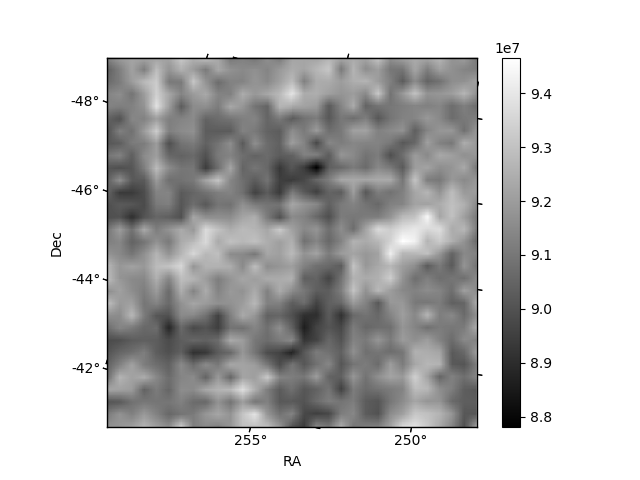
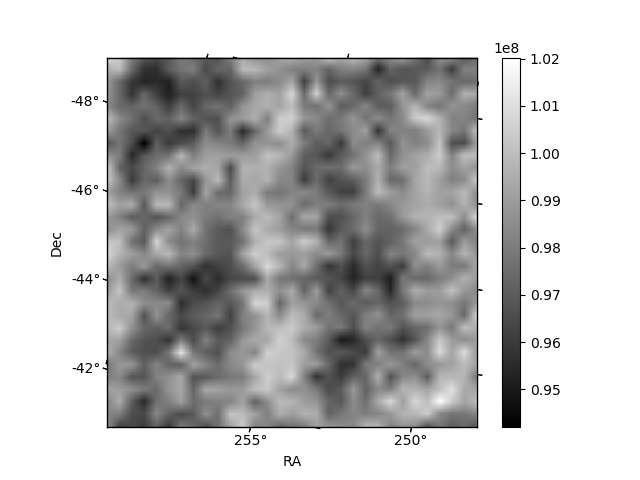
Histogram calculated using DETX and DETY for each event in the final _common_clean file
| Quadrant A | 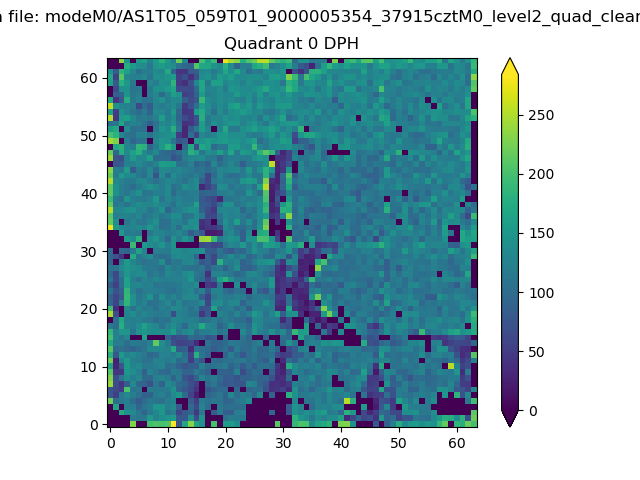 |
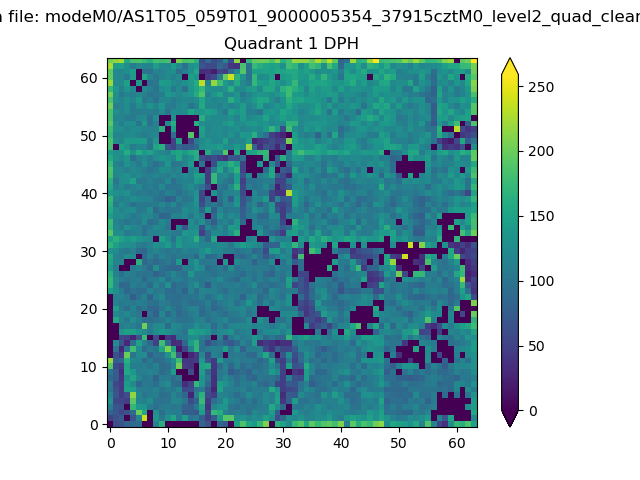 |
Quadrant B |
|---|---|---|---|
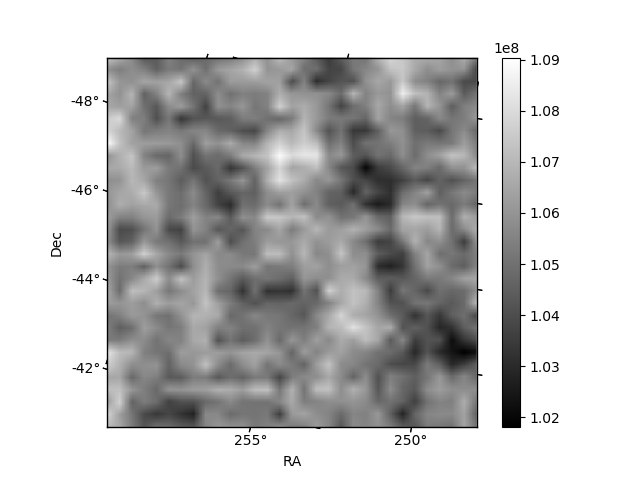
| Quadrant D | 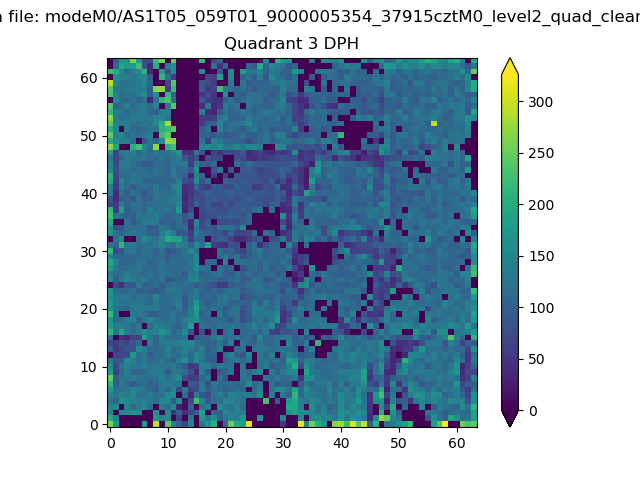 |
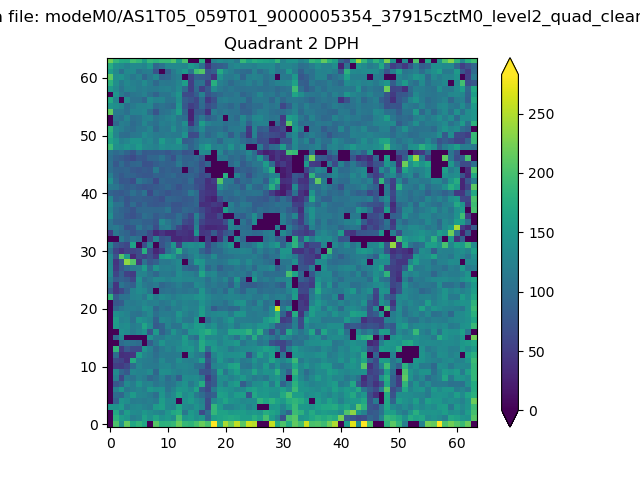 |
Quadrant C |
| Plot type | Count rate plots | Images |
|---|---|---|
| Comparison with Poisson distribution Blue bars denote a histogram of data divided into 1 sec bins. Red curve is a Poisson curve with rate = median count rate of data. |
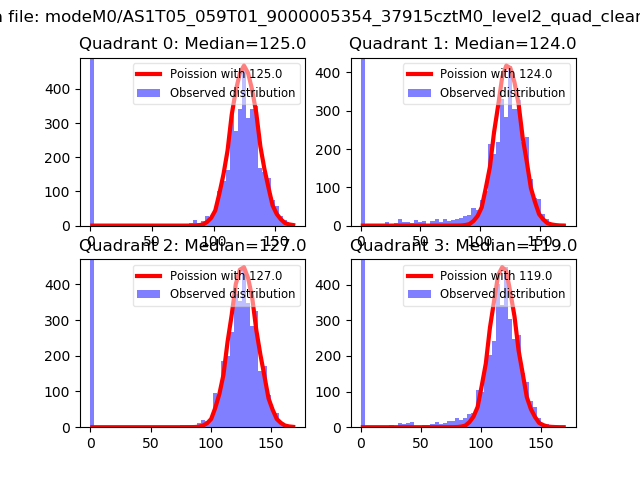 |
 |
| Quadrant-wise count rates Data is divided into 100 sec bins |
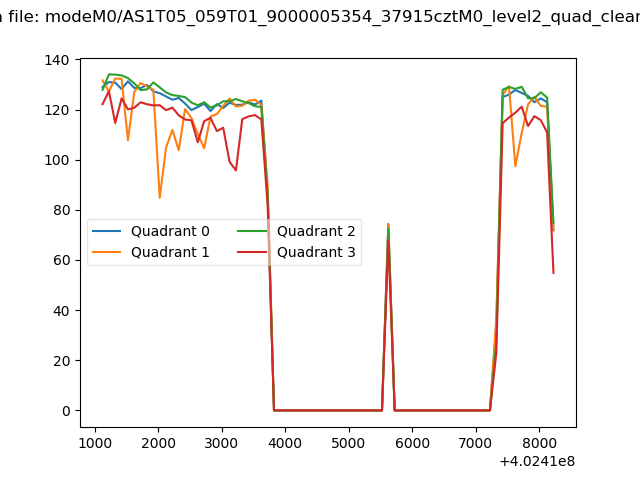 |
|
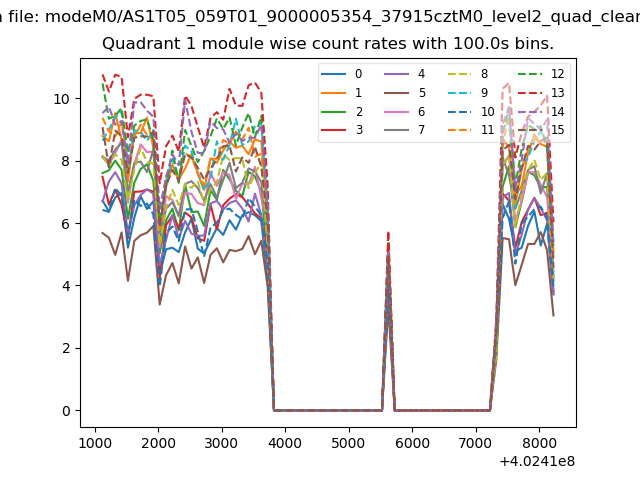
| Module-wise count rates for Quadrant A Data is divided into 100 sec bins |
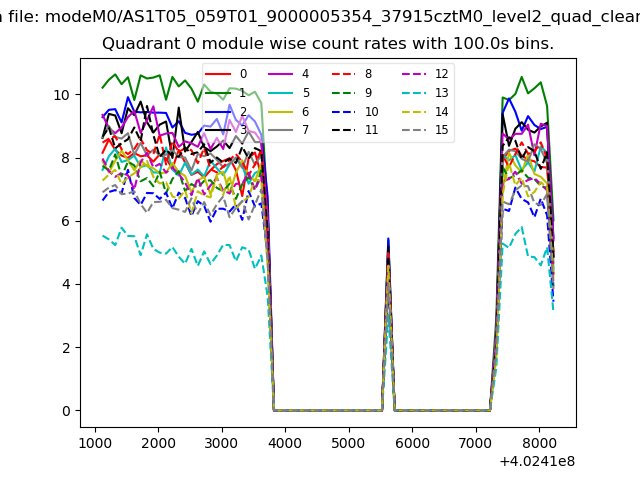 |
 |
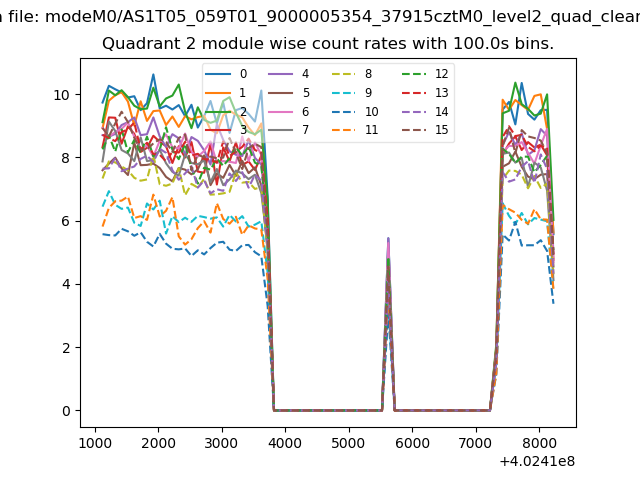
| Module-wise count rates for Quadrant B Data is divided into 100 sec bins |
 |
 |
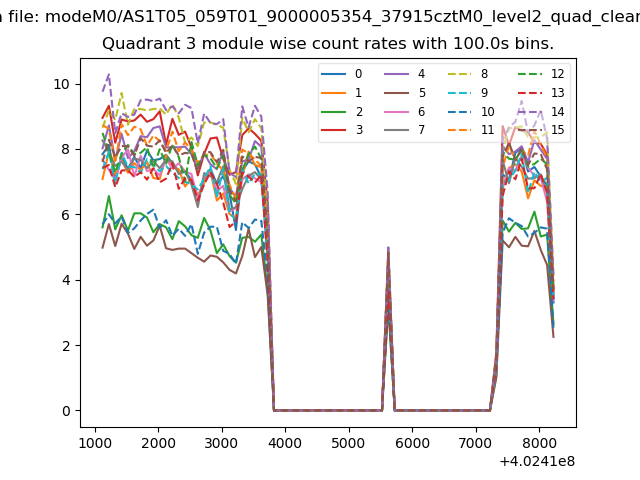
| Module-wise count rates for Quadrant C Data is divided into 100 sec bins |
 |
 |
| Module-wise count rates for Quadrant D Data is divided into 100 sec bins |
 |
 |
| Parameter | Plot |
|---|---|
| CZT HV Monitor | 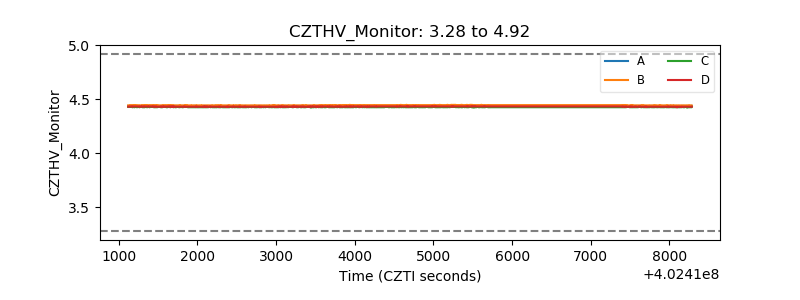 |
| D_VDD | 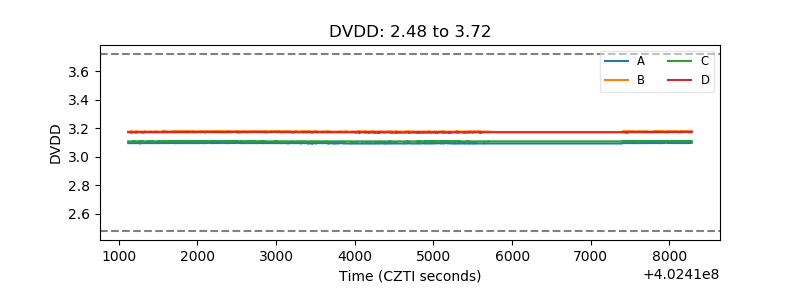 |
| Temperature 1 |  |
| Veto HV Monitor | 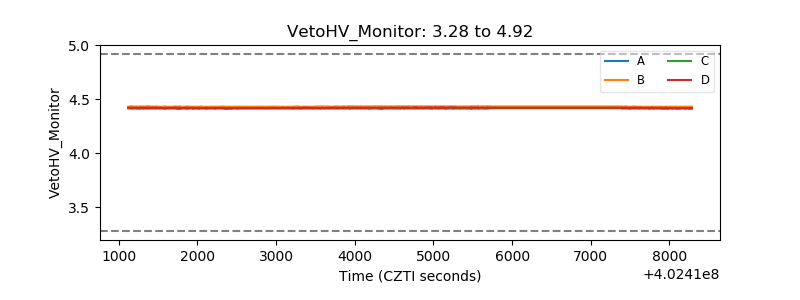 |
| Veto LLD | 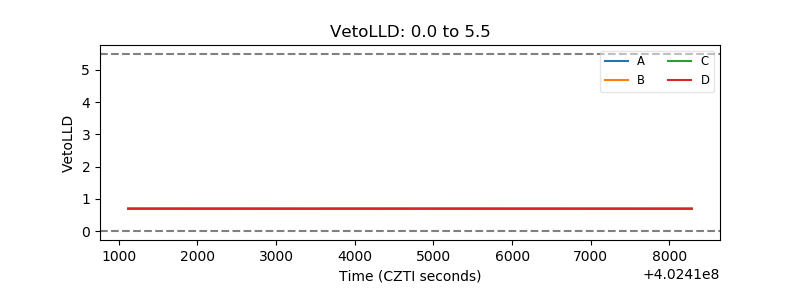 |
| Alpha Counter | 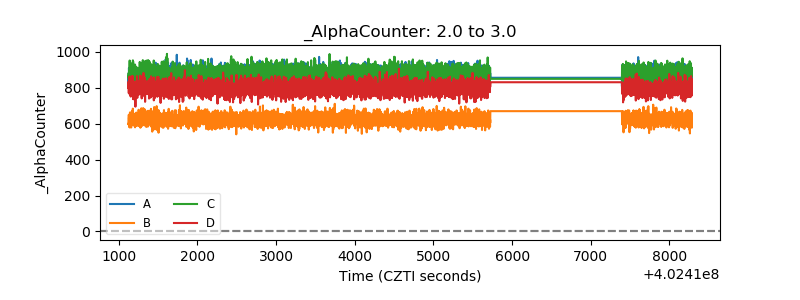 |
| _CPM_Rate | 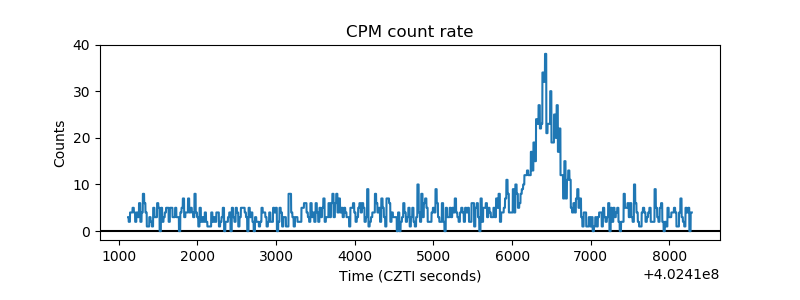 |
| CZT Counter | 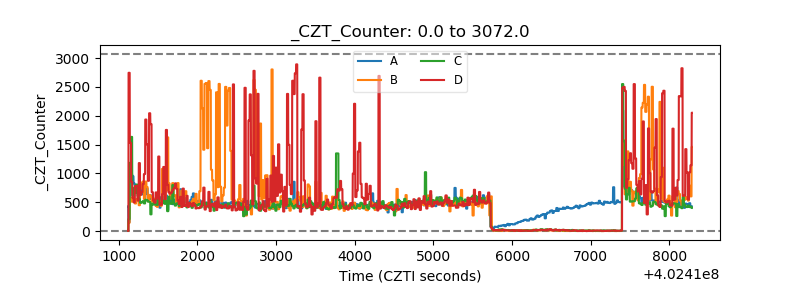 |
| +2.5 Volts monitor | 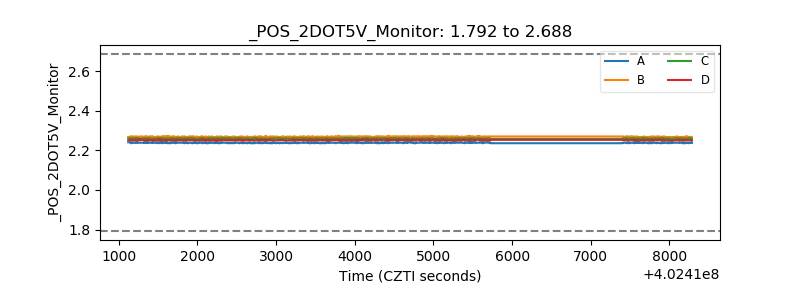 |
| +5 Volts monitor | 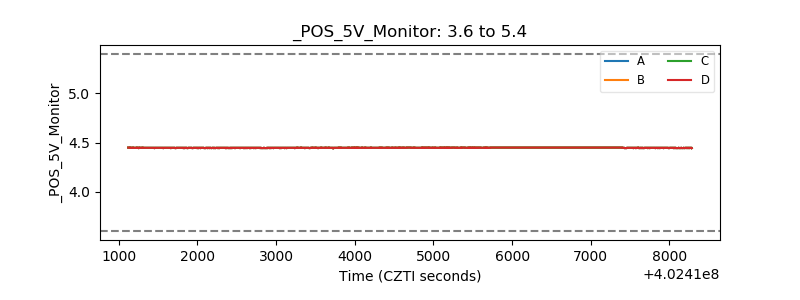 |
| _ROLL_ROT | 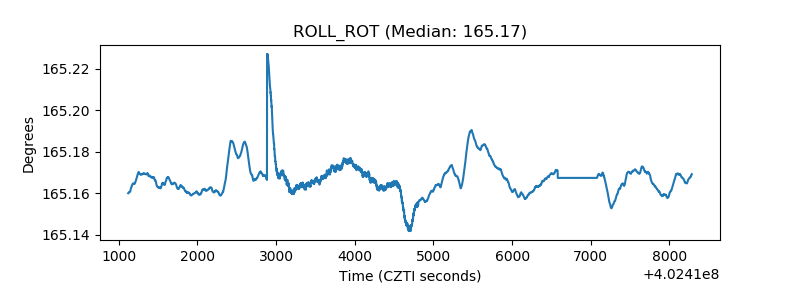 |
| _Roll_DEC | 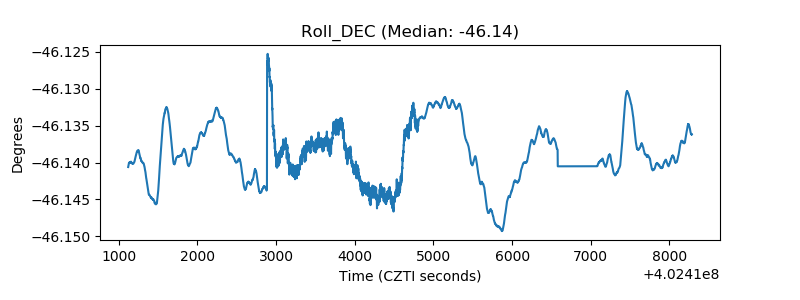 |
| _Roll_RA | 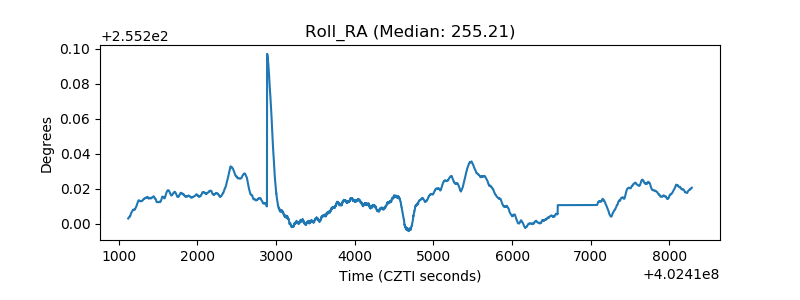 |
| Veto Counter | 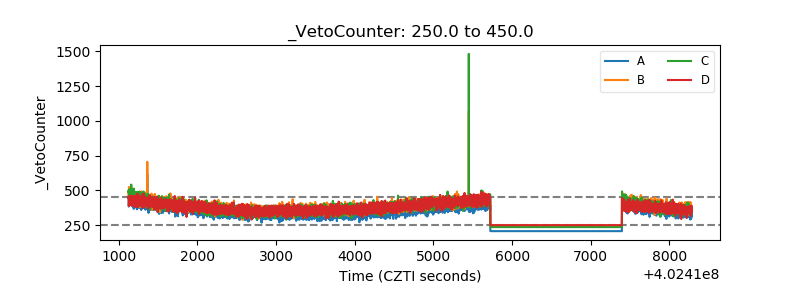 |