| Param | Original file | Final file |
|---|---|---|
| Filename | modeM0/AS1T05_059T01_9000005354_37917cztM0_level2.evt | modeM0/AS1T05_059T01_9000005354_37917cztM0_level2_quad_clean.evt |
| Size (bytes) | 469,728,000 | 70,830,720 |
| Size | 448.0 MB | 67.5 MB |
| Events in quadrant A | 3,143,644 | 449,363 |
| Events in quadrant B | 3,454,316 | 448,329 |
| Events in quadrant C | 3,009,020 | 441,105 |
| Events in quadrant D | 4,218,265 | 393,251 |
| Mode M0 | |||
|---|---|---|---|
| Quadrant | BADHDUFLAG | Total packets | Discarded packets |
| A | 0 | 13023 | 3 |
| B | 0 | 14067 | 2 |
| C | 0 | 12656 | 2 |
| D | 0 | 16706 | 2 |
| Mode SS | |||
|---|---|---|---|
| Quadrant | BADHDUFLAG | Total packets | Discarded packets |
| A | 0 | 120 | 0 |
| B | 0 | 120 | 0 |
| C | 0 | 120 | 0 |
| D | 0 | 120 | 0 |
| Mode M9 | |||
|---|---|---|---|
| Quadrant | BADHDUFLAG | Total packets | Discarded packets |
| A | 0 | 22 | 0 |
| B | 0 | 22 | 0 |
| C | 0 | 22 | 0 |
| D | 0 | 23 | 0 |
| Quadrant | Total seconds | Saturated seconds | Saturation percentage |
|---|---|---|---|
| A | 5902 | 28 | 0.474415% |
| B | 5902 | 120 | 2.033209% |
| C | 5902 | 49 | 0.830227% |
| D | 5902 | 293 | 4.964419% |
Noise dominated data is calculated using 1-second bins in cleaned event files. If a bin has >2000 counts, and if more than 50% of those come from <1% of pixels, then it is considered to be noise-dominated and hence unusable.
| Quadrant | # 1 sec bins | Bins with >0 counts | Bins with >2000 counts | High rate bins dominated by noise | Noise dominated (total time) | Noise dominated (detector-on time) | Marked lightcurve |
|---|---|---|---|---|---|---|---|
| A | 7185 | 5903 | 14 | 14 | 0.19% | 0.24% | 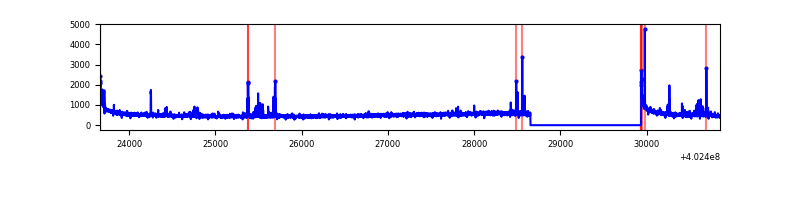 |
| B | 7185 | 5903 | 71 | 71 | 0.99% | 1.20% | 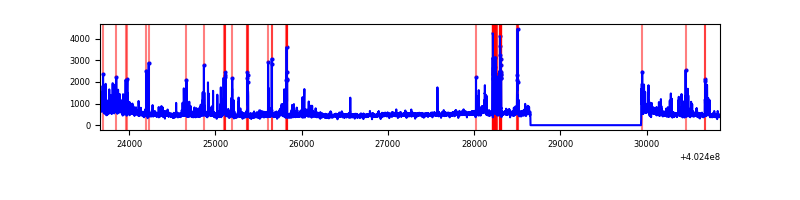 |
| C | 7185 | 5903 | 34 | 34 | 0.47% | 0.58% | 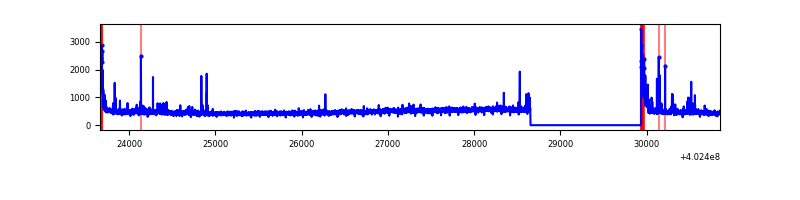 |
| D | 7185 | 5903 | 306 | 306 | 4.26% | 5.18% | 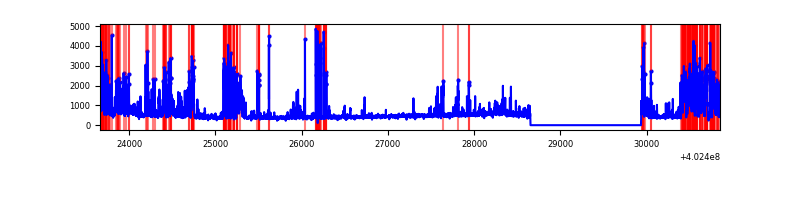 |
Top three noisy pixels from each quadrant. If the there are fewer than three noisy pixels in the level2.evt file, extra rows are filled as -1
| Pixel properties | Quadrant properties | ||||||
|---|---|---|---|---|---|---|---|
| Quadrant | DetID | PixID | Counts | Sigma | Mean | Median | Sigma |
| A | 10 | 83 | 404995 | 3014.71 | 660 | 646 | 134.1 |
| A | 13 | 248 | 112225 | 831.9 | 660 | 646 | 134.1 |
| A | 13 | 6 | 22884 | 165.8 | 660 | 646 | 134.1 |
| B | 0 | 229 | 260977 | 2062.84 | 653 | 637 | 126.2 |
| B | 5 | 172 | 251804 | 1990.16 | 653 | 637 | 126.2 |
| B | 4 | 171 | 150607 | 1188.31 | 653 | 637 | 126.2 |
| C | 15 | 214 | 246650 | 1629.62 | 640 | 645 | 151.0 |
| C | 0 | 10 | 150218 | 990.82 | 640 | 645 | 151.0 |
| C | 14 | 254 | 64609 | 423.72 | 640 | 645 | 151.0 |
| D | 12 | 227 | 676238 | 4279.21 | 632 | 611 | 157.9 |
| D | 2 | 249 | 384441 | 2431.06 | 632 | 611 | 157.9 |
| D | 1 | 52 | 342407 | 2164.83 | 632 | 611 | 157.9 |
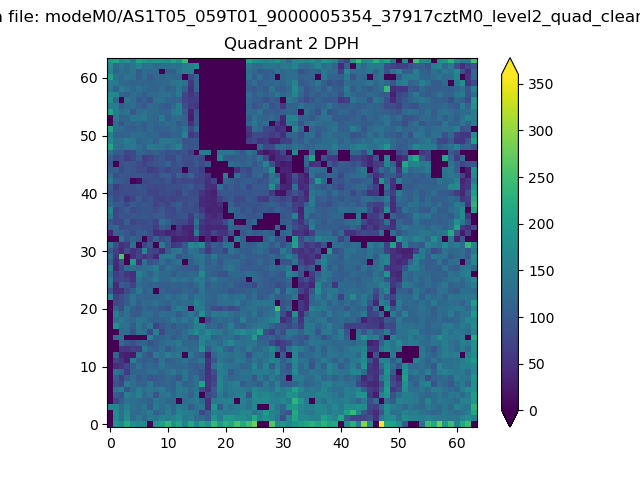
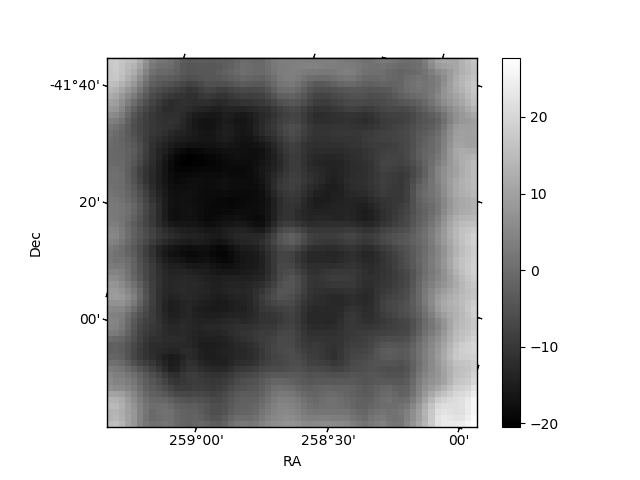
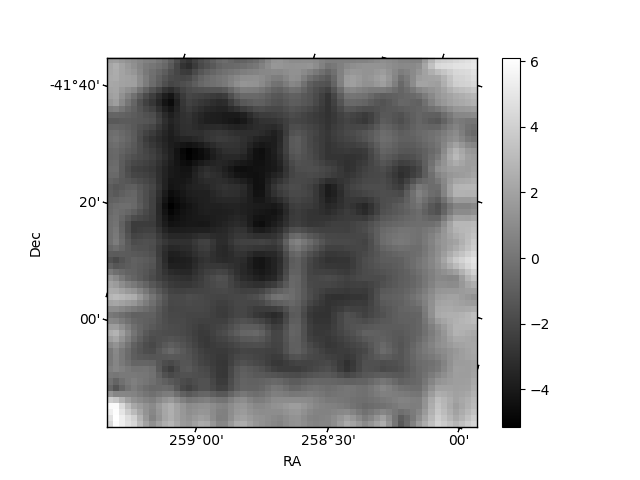
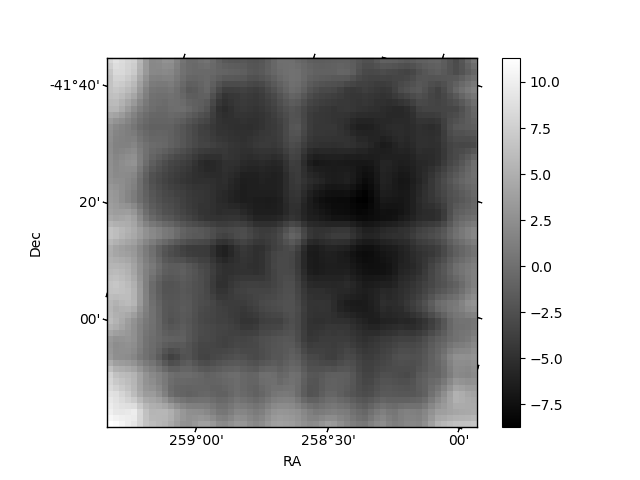
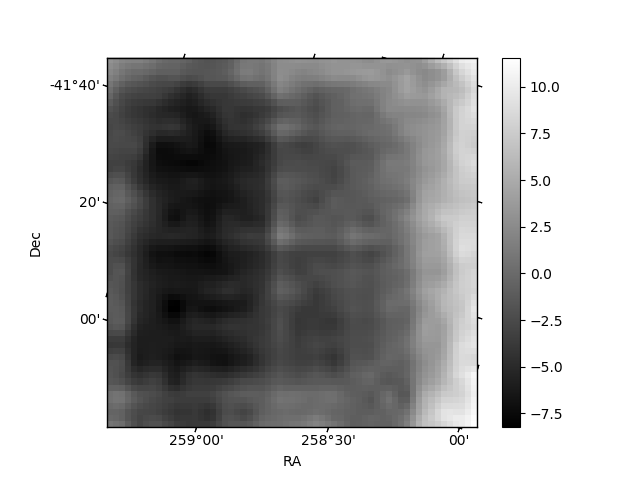
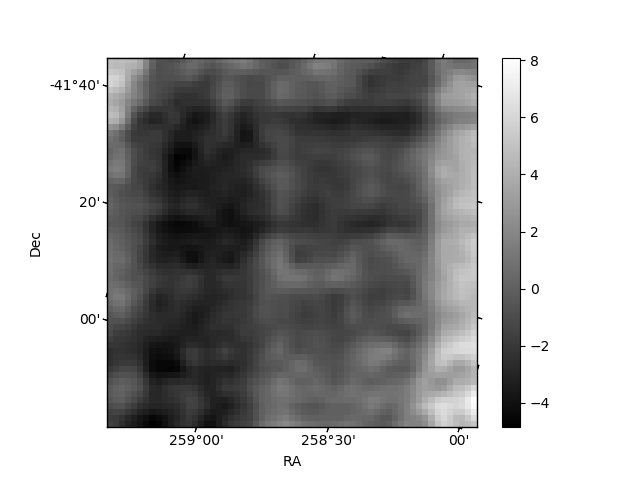
Histogram calculated using DETX and DETY for each event in the final _common_clean file
| Quadrant A | 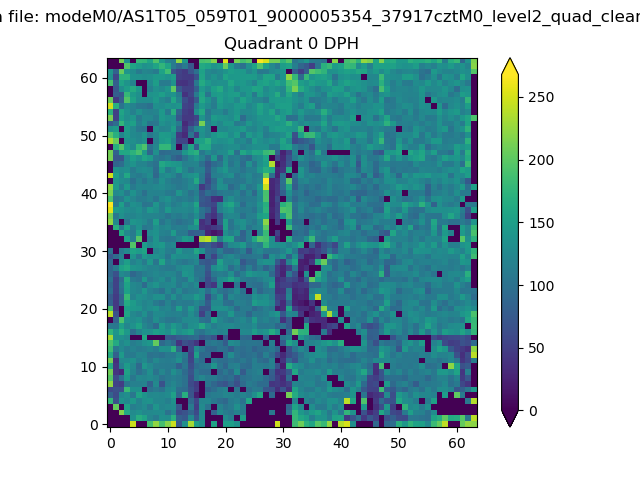 |
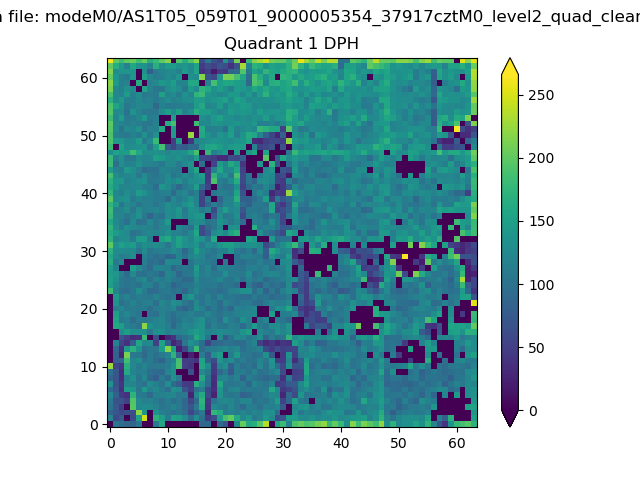 |
Quadrant B |
|---|---|---|---|
| Quadrant D | 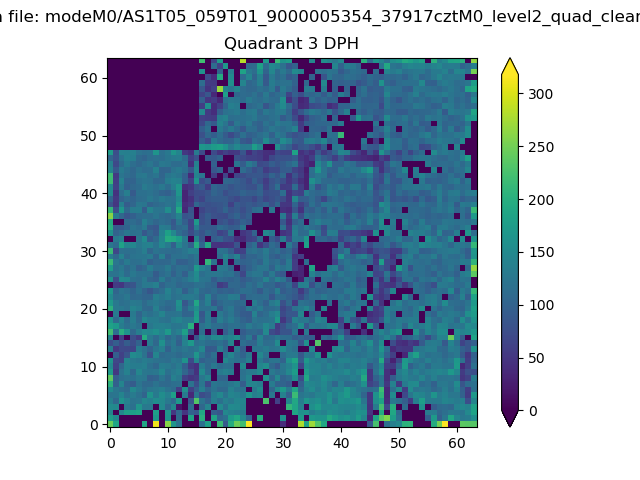 |
 |
Quadrant C |
| Plot type | Count rate plots | Images |
|---|---|---|
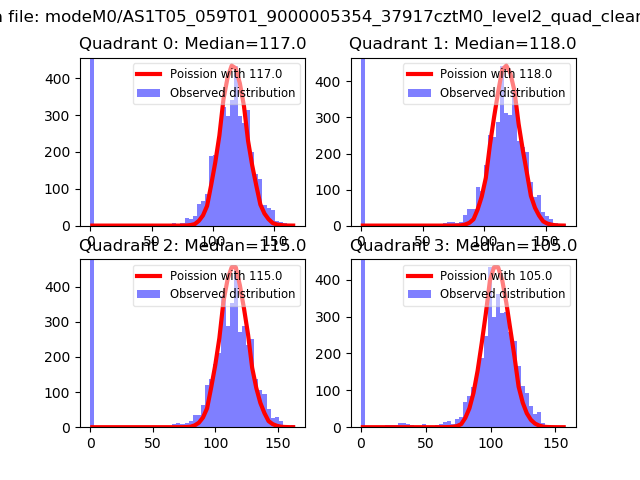
| Comparison with Poisson distribution Blue bars denote a histogram of data divided into 1 sec bins. Red curve is a Poisson curve with rate = median count rate of data. |
 |
 |
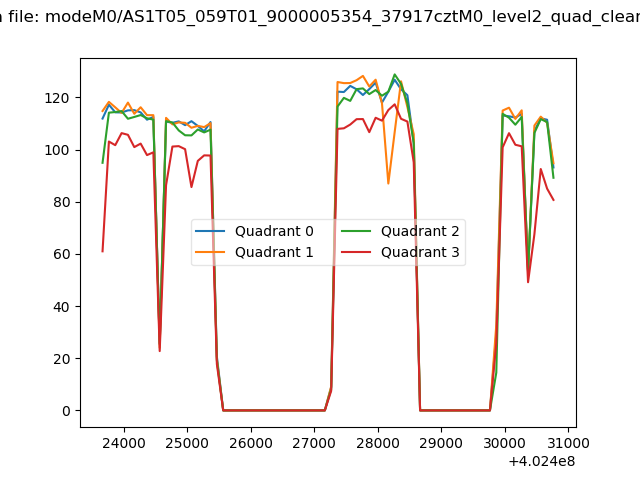
| Quadrant-wise count rates Data is divided into 100 sec bins |
 |
|
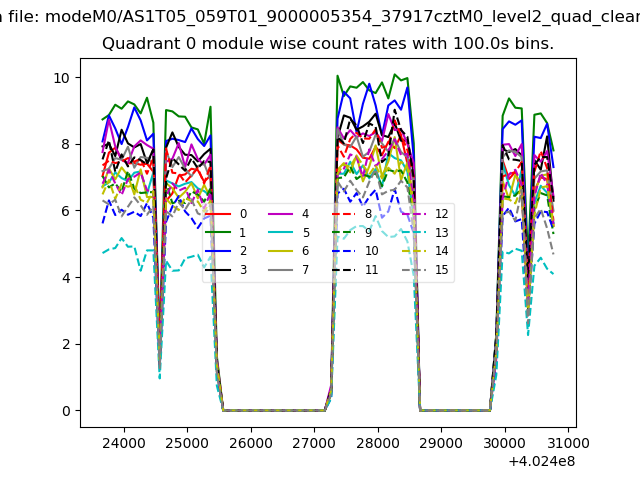
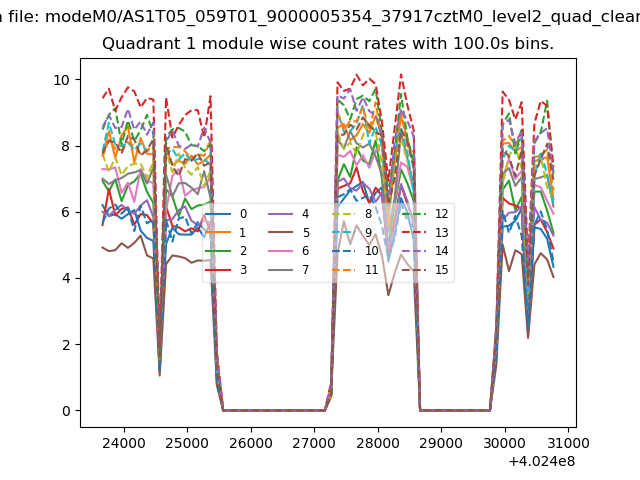
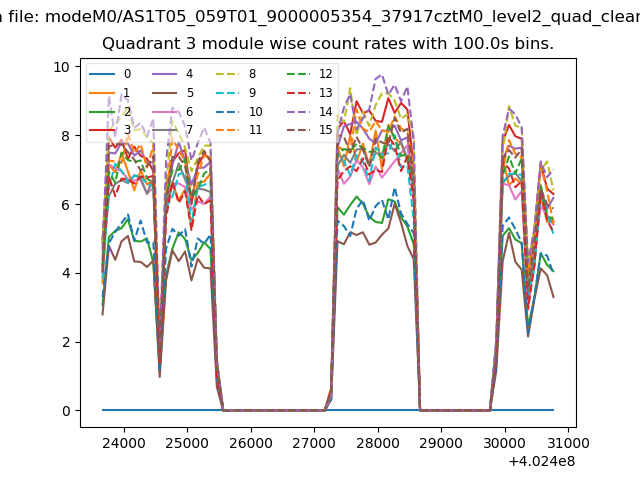
| Module-wise count rates for Quadrant A Data is divided into 100 sec bins |
 |
 |
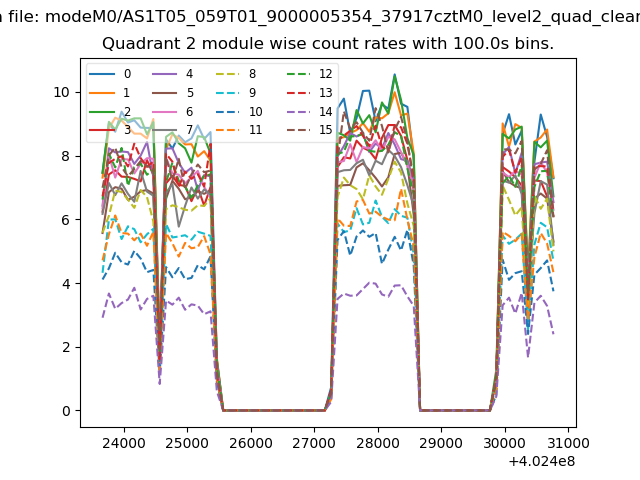
| Module-wise count rates for Quadrant B Data is divided into 100 sec bins |
 |
 |
| Module-wise count rates for Quadrant C Data is divided into 100 sec bins |
 |
 |
| Module-wise count rates for Quadrant D Data is divided into 100 sec bins |
 |
 |
| Parameter | Plot |
|---|---|
| CZT HV Monitor | 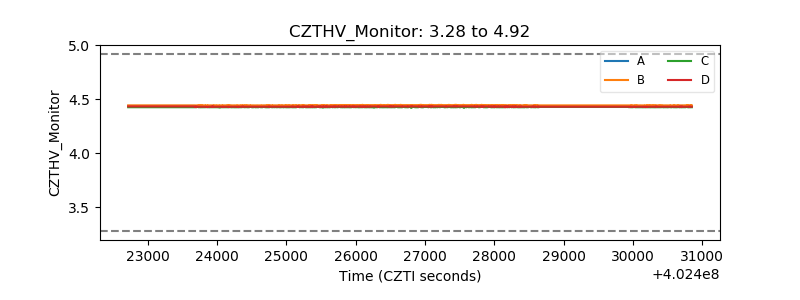 |
| D_VDD | 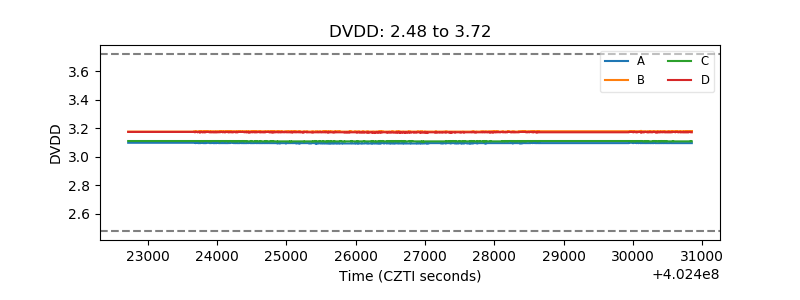 |
| Temperature 1 | 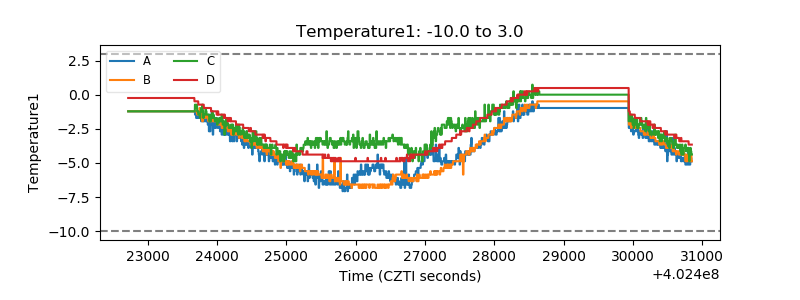 |
| Veto HV Monitor | 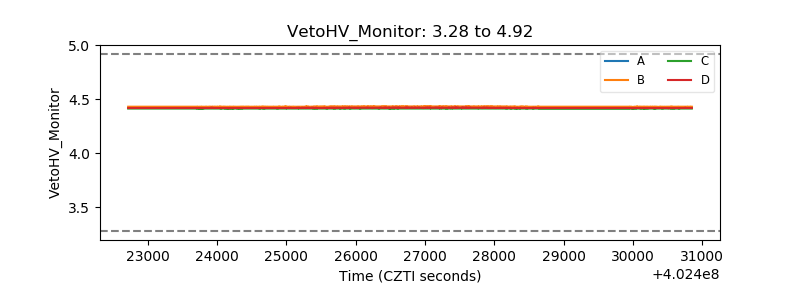 |
| Veto LLD | 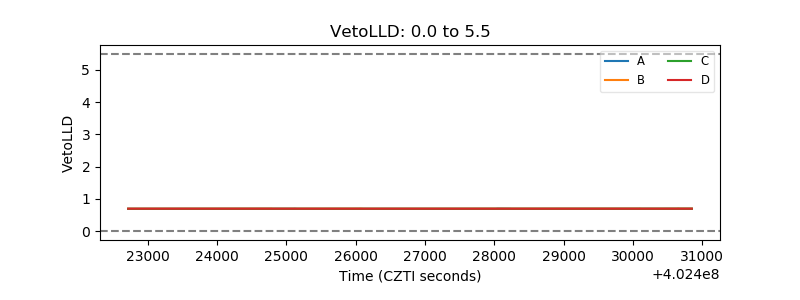 |
| Alpha Counter | 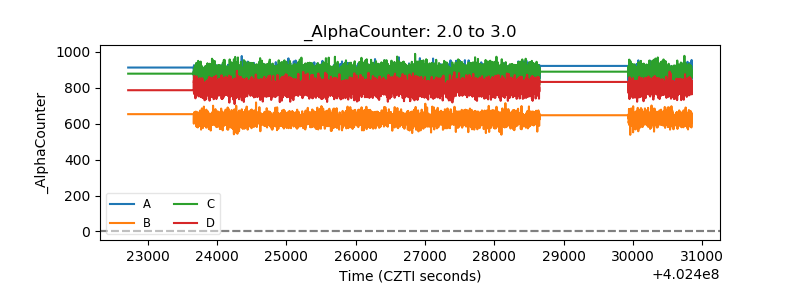 |
| _CPM_Rate | 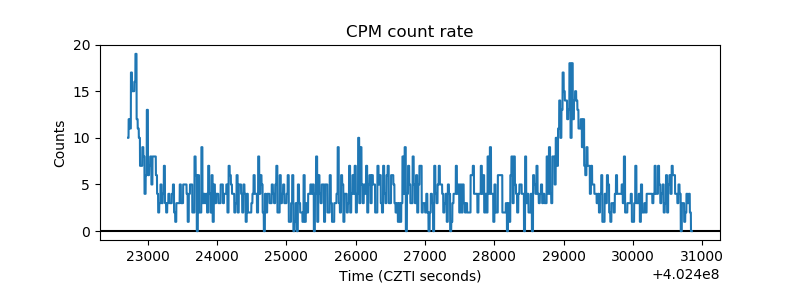 |
| CZT Counter | 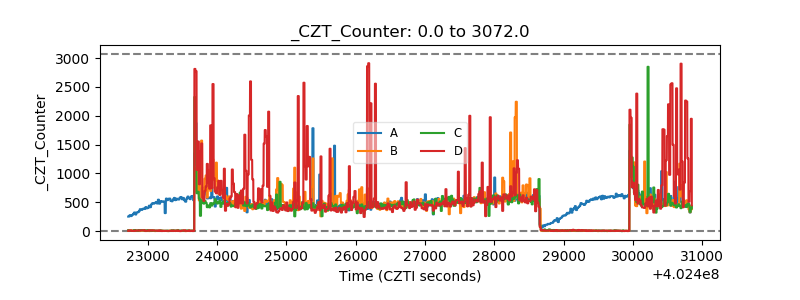 |
| +2.5 Volts monitor | 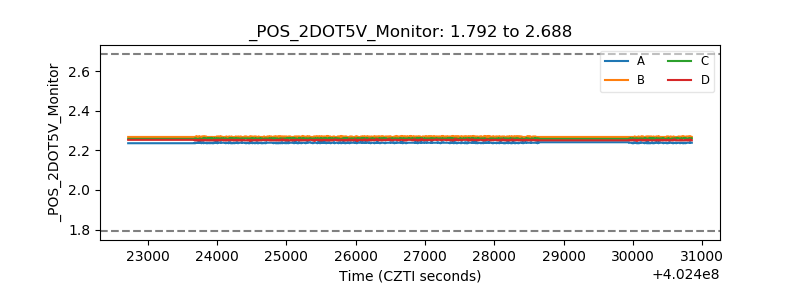 |
| +5 Volts monitor |  |
| _ROLL_ROT | 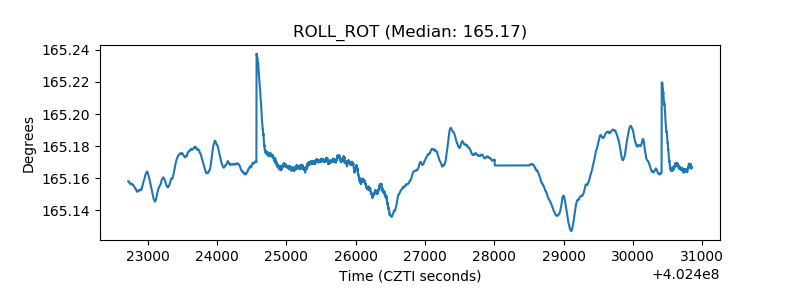 |
| _Roll_DEC | 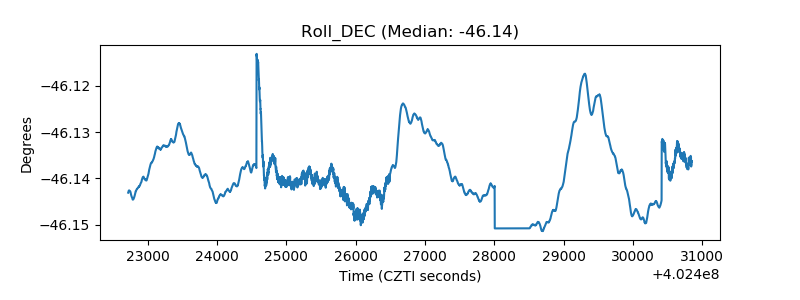 |
| _Roll_RA | 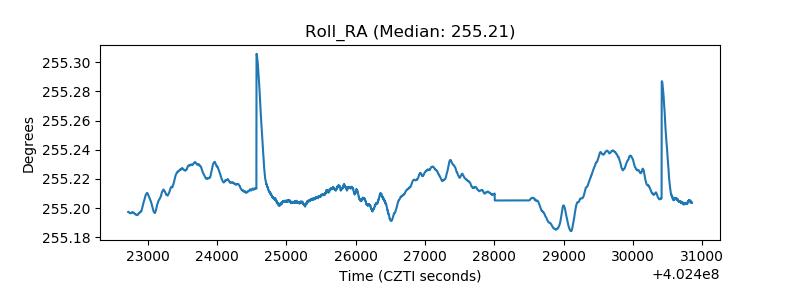 |
| Veto Counter | 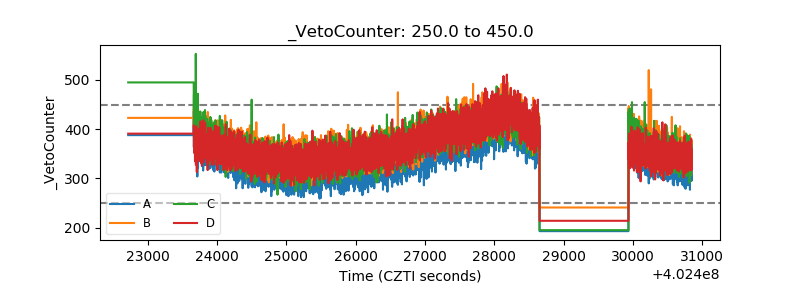 |