| Param | Original file | Final file |
|---|---|---|
| Filename | modeM0/AS1T05_059T01_9000005354_37920cztM0_level2.evt | modeM0/AS1T05_059T01_9000005354_37920cztM0_level2_quad_clean.evt |
| Size (bytes) | 1,280,854,080 | 184,481,280 |
| Size | 1.2 GB | 175.9 MB |
| Events in quadrant A | 8,432,626 | 1,151,863 |
| Events in quadrant B | 8,912,416 | 1,163,420 |
| Events in quadrant C | 7,945,896 | 1,165,029 |
| Events in quadrant D | 12,443,576 | 1,026,501 |
| Mode M0 | |||
|---|---|---|---|
| Quadrant | BADHDUFLAG | Total packets | Discarded packets |
| A | 0 | 34838 | 5 |
| B | 0 | 36836 | 4 |
| C | 0 | 33232 | 4 |
| D | 0 | 47947 | 4 |
| Mode SS | |||
|---|---|---|---|
| Quadrant | BADHDUFLAG | Total packets | Discarded packets |
| A | 0 | 322 | 0 |
| B | 0 | 322 | 0 |
| C | 0 | 322 | 0 |
| D | 0 | 322 | 0 |
| Mode M9 | |||
|---|---|---|---|
| Quadrant | BADHDUFLAG | Total packets | Discarded packets |
| A | 0 | 55 | 0 |
| B | 0 | 55 | 0 |
| C | 0 | 55 | 0 |
| D | 0 | 55 | 0 |
| Quadrant | Total seconds | Saturated seconds | Saturation percentage |
|---|---|---|---|
| A | 15649 | 83 | 0.530385% |
| B | 15649 | 169 | 1.079941% |
| C | 15649 | 88 | 0.562336% |
| D | 15649 | 1567 | 10.013419% |
Noise dominated data is calculated using 1-second bins in cleaned event files. If a bin has >2000 counts, and if more than 50% of those come from <1% of pixels, then it is considered to be noise-dominated and hence unusable.
| Quadrant | # 1 sec bins | Bins with >0 counts | Bins with >2000 counts | High rate bins dominated by noise | Noise dominated (total time) | Noise dominated (detector-on time) | Marked lightcurve |
|---|---|---|---|---|---|---|---|
| A | 21138 | 15653 | 58 | 58 | 0.27% | 0.37% | 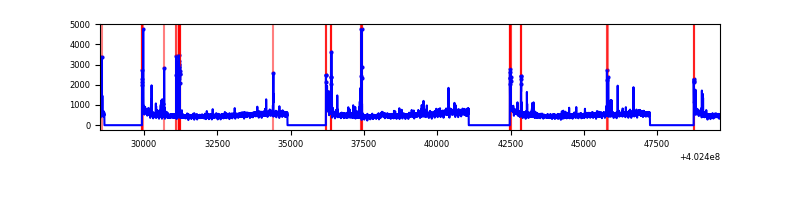 |
| B | 21138 | 15653 | 91 | 91 | 0.43% | 0.58% | 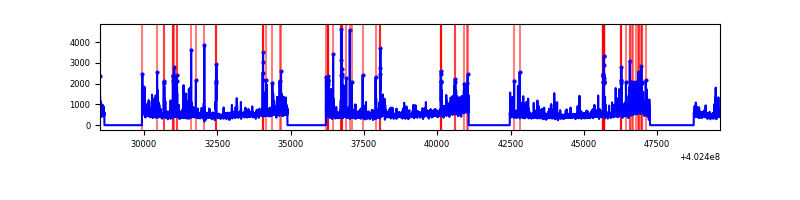 |
| C | 21138 | 15653 | 65 | 65 | 0.31% | 0.42% | 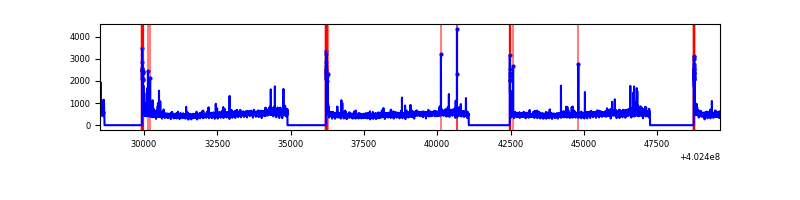 |
| D | 21138 | 15653 | 1411 | 1411 | 6.68% | 9.01% | 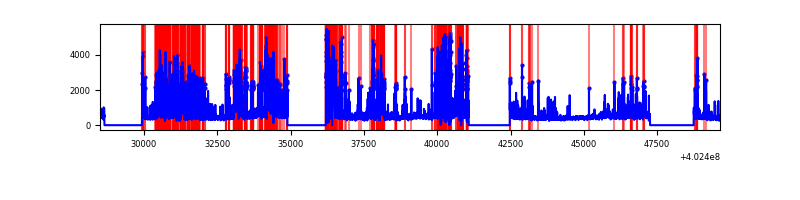 |
Top three noisy pixels from each quadrant. If the there are fewer than three noisy pixels in the level2.evt file, extra rows are filled as -1
| Pixel properties | Quadrant properties | ||||||
|---|---|---|---|---|---|---|---|
| Quadrant | DetID | PixID | Counts | Sigma | Mean | Median | Sigma |
| A | 10 | 83 | 933256 | 2622.28 | 1765 | 1734 | 355.2 |
| A | 15 | 222 | 207621 | 579.58 | 1765 | 1734 | 355.2 |
| A | 13 | 248 | 174506 | 486.36 | 1765 | 1734 | 355.2 |
| B | 5 | 172 | 521515 | 1557.51 | 1759 | 1711 | 333.7 |
| B | 0 | 229 | 515210 | 1538.61 | 1759 | 1711 | 333.7 |
| B | 0 | 230 | 244904 | 728.69 | 1759 | 1711 | 333.7 |
| C | 15 | 214 | 648162 | 1613.98 | 1719 | 1730 | 400.5 |
| C | 0 | 10 | 281890 | 699.49 | 1719 | 1730 | 400.5 |
| C | 14 | 254 | 137515 | 339.02 | 1719 | 1730 | 400.5 |
| D | 12 | 227 | 3341883 | 8365.81 | 1643 | 1598 | 399.3 |
| D | 1 | 52 | 957191 | 2393.3 | 1643 | 1598 | 399.3 |
| D | 2 | 249 | 730784 | 1826.26 | 1643 | 1598 | 399.3 |
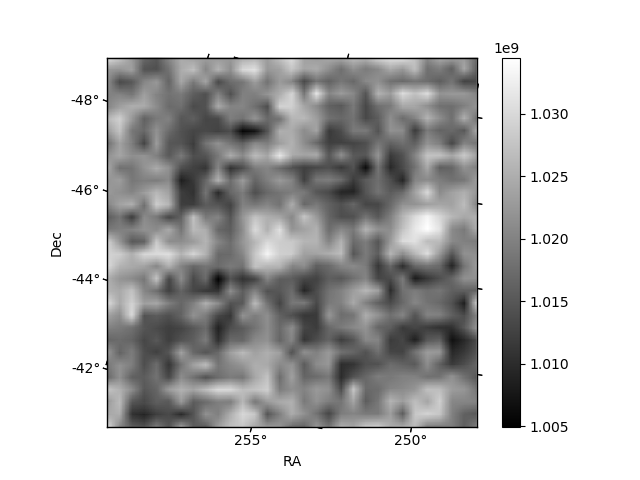
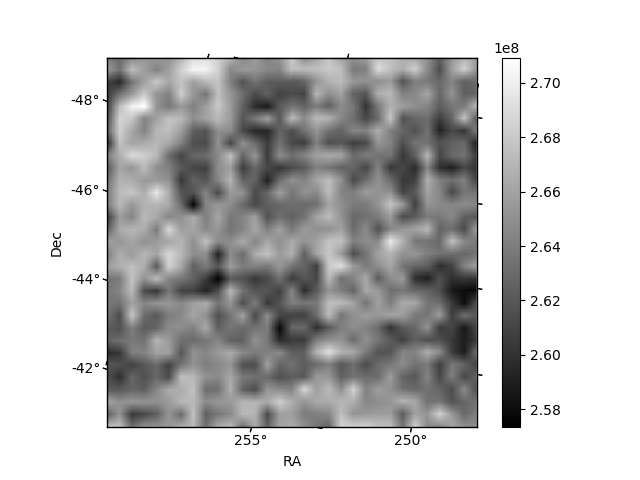
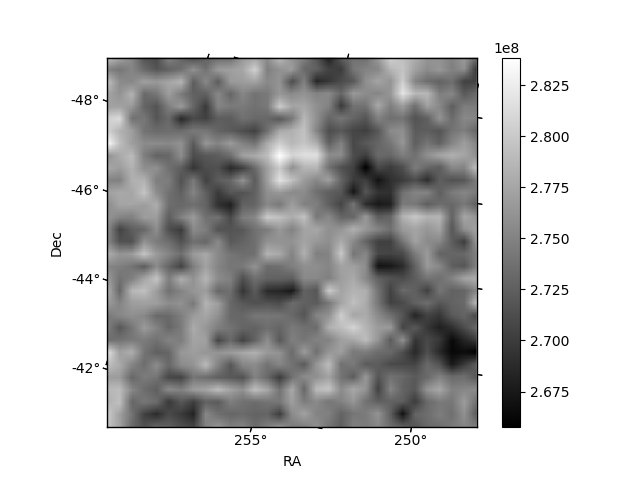
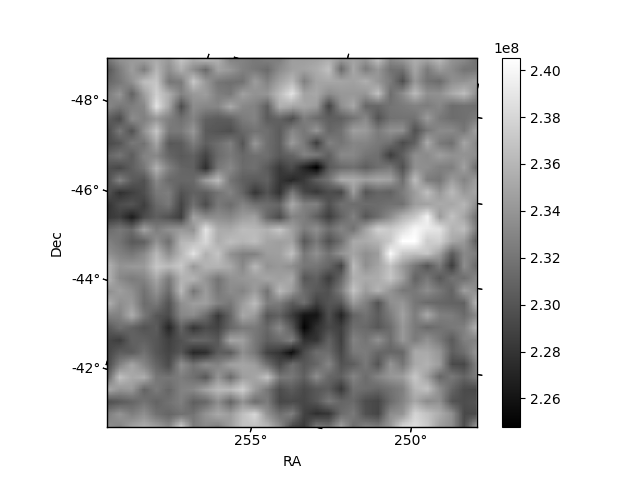
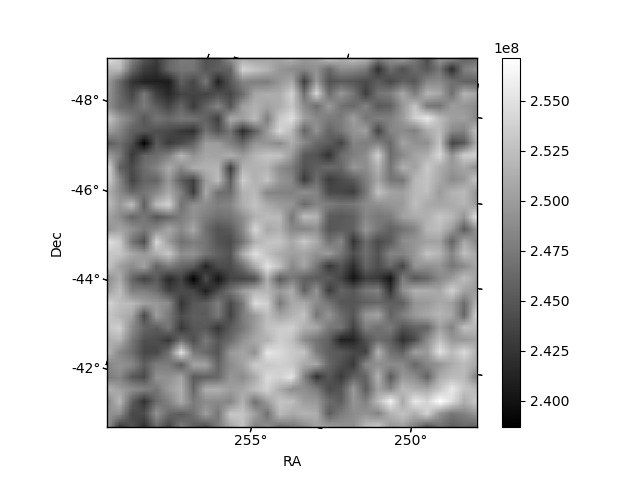
Histogram calculated using DETX and DETY for each event in the final _common_clean file
| Quadrant A | 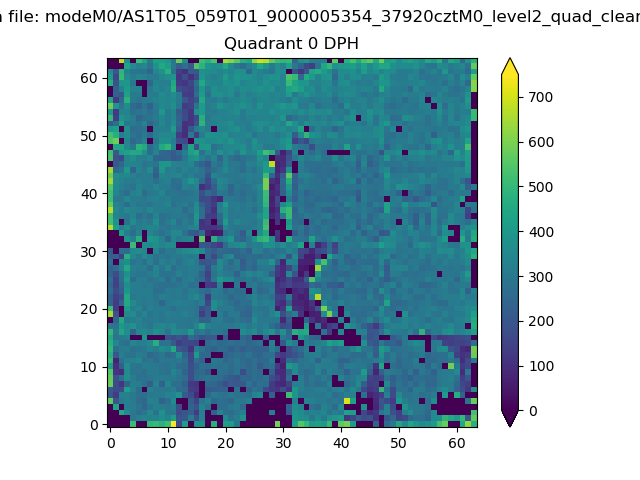 |
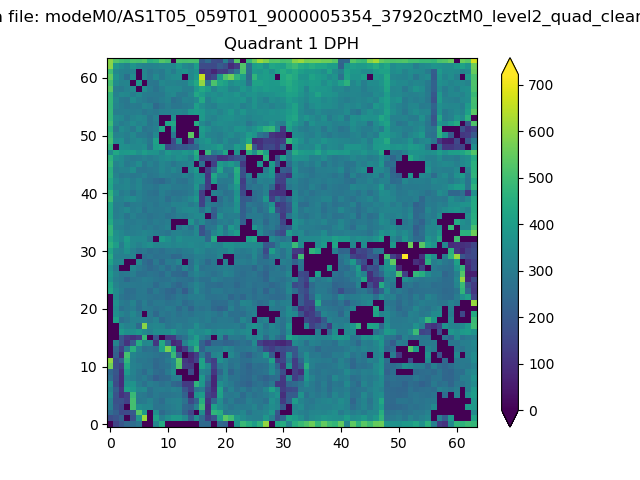 |
Quadrant B |
|---|---|---|---|
| Quadrant D | 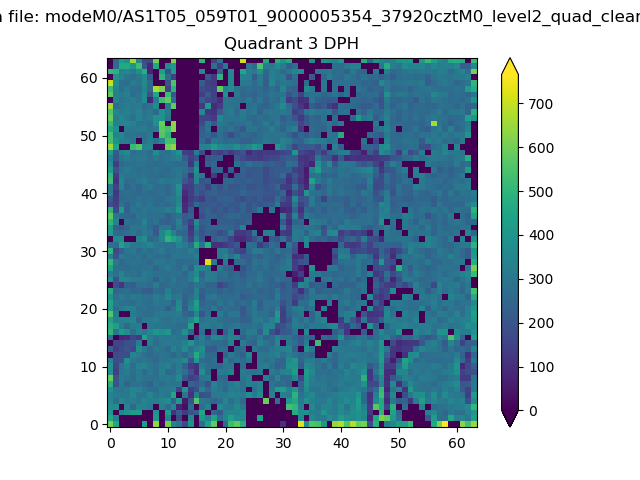 |
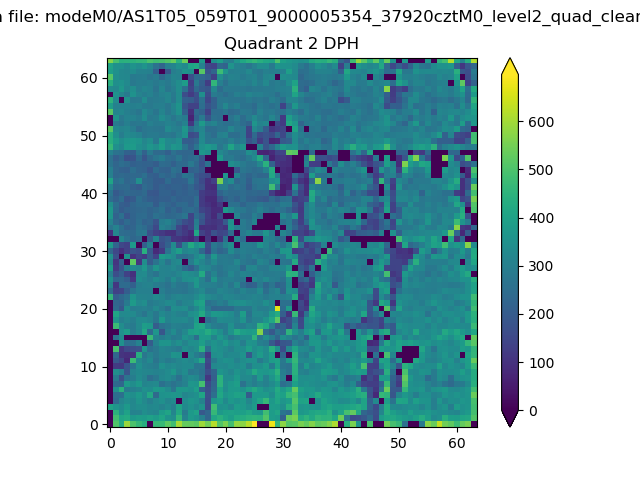 |
Quadrant C |
| Plot type | Count rate plots | Images |
|---|---|---|
| Comparison with Poisson distribution Blue bars denote a histogram of data divided into 1 sec bins. Red curve is a Poisson curve with rate = median count rate of data. |
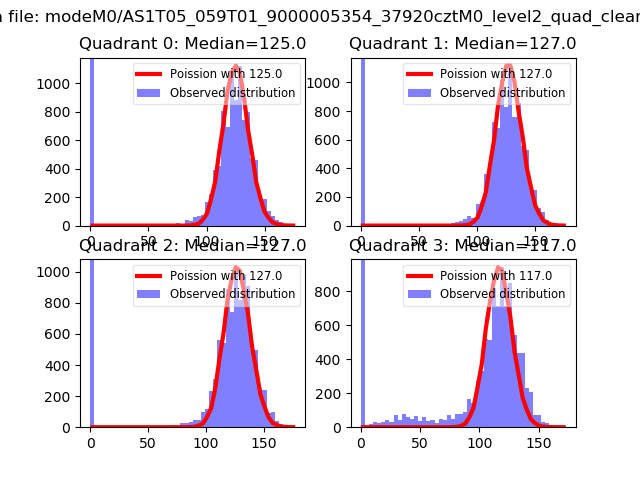 |
 |
| Quadrant-wise count rates Data is divided into 100 sec bins |
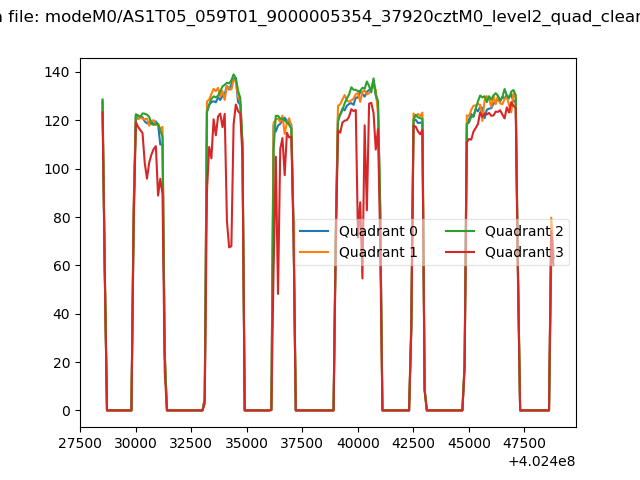 |
|
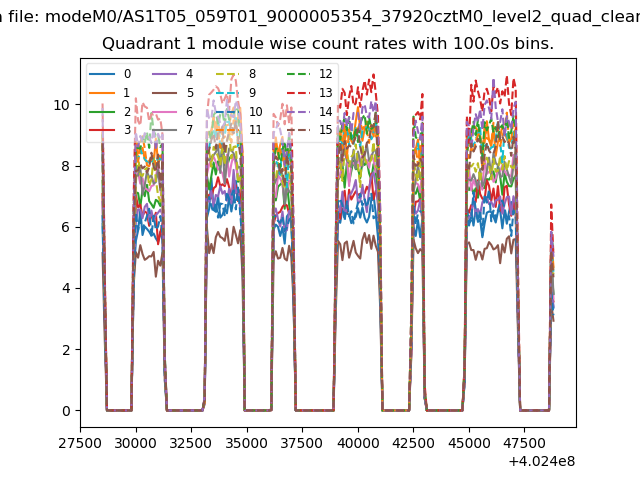
| Module-wise count rates for Quadrant A Data is divided into 100 sec bins |
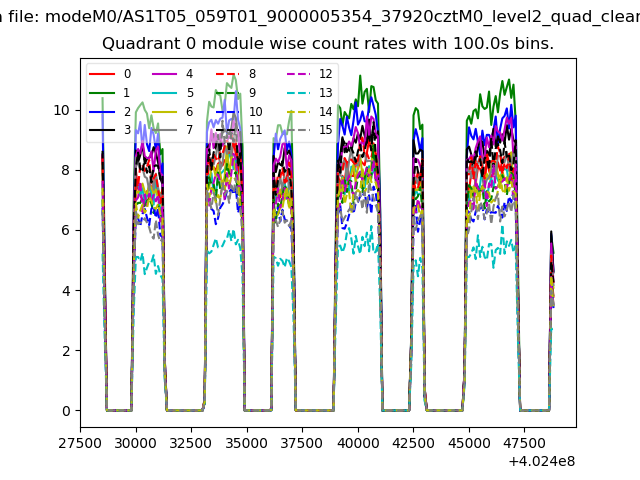 |
 |
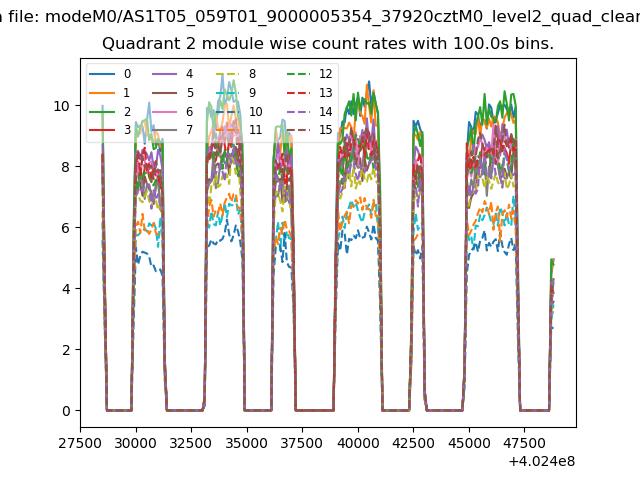
| Module-wise count rates for Quadrant B Data is divided into 100 sec bins |
 |
 |
| Module-wise count rates for Quadrant C Data is divided into 100 sec bins |
 |
 |
| Module-wise count rates for Quadrant D Data is divided into 100 sec bins |
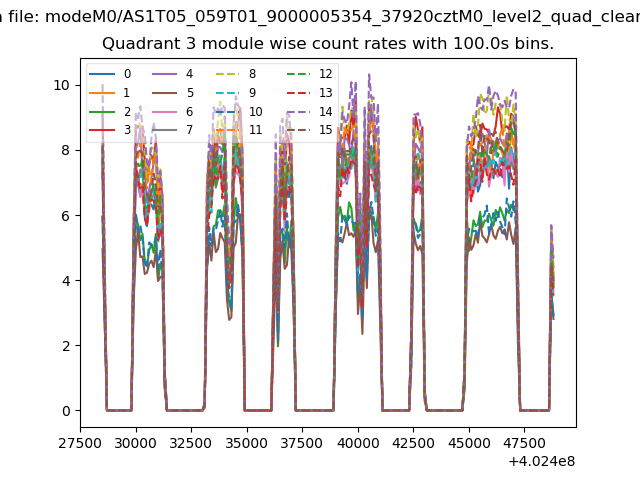 |
 |
| Parameter | Plot |
|---|---|
| CZT HV Monitor | 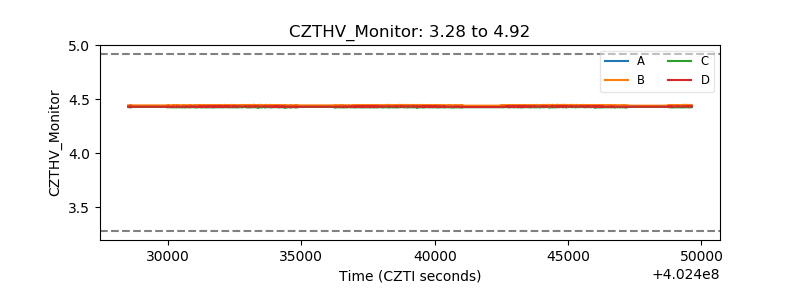 |
| D_VDD | 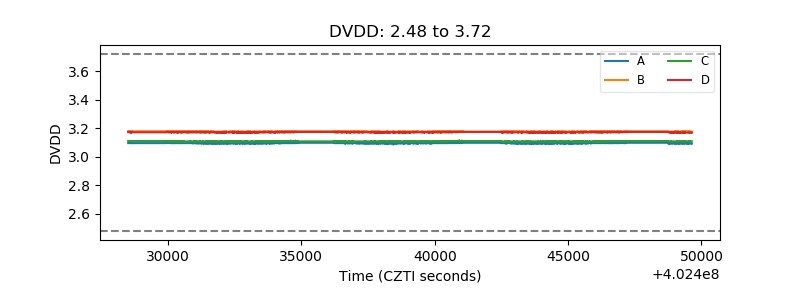 |
| Temperature 1 | 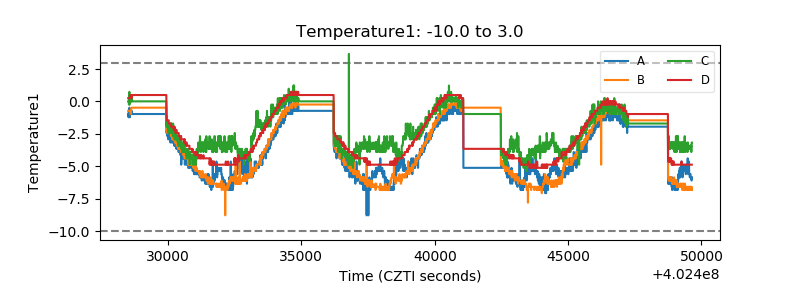 |
| Veto HV Monitor | 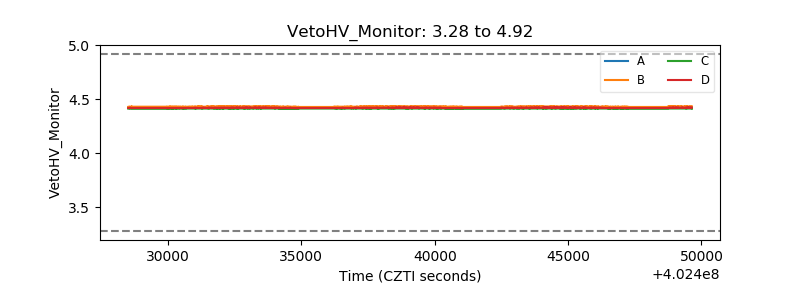 |
| Veto LLD | 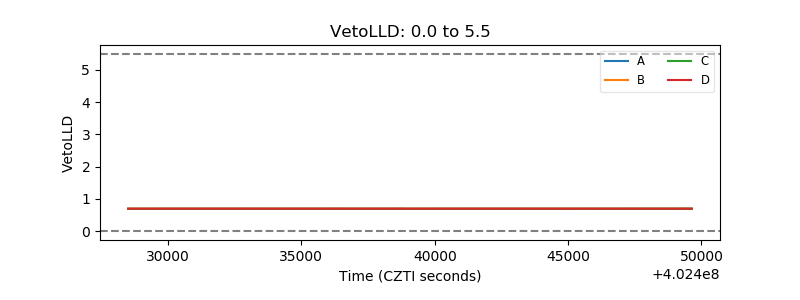 |
| Alpha Counter | 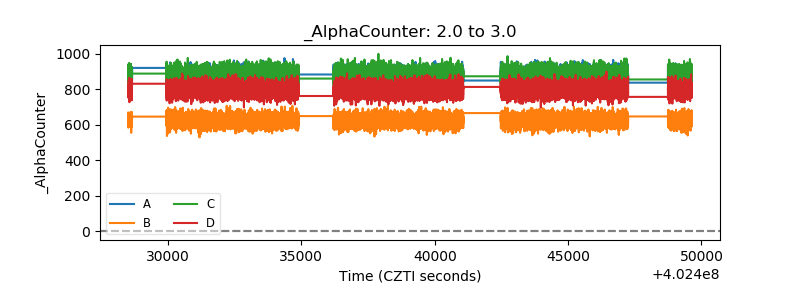 |
| _CPM_Rate | 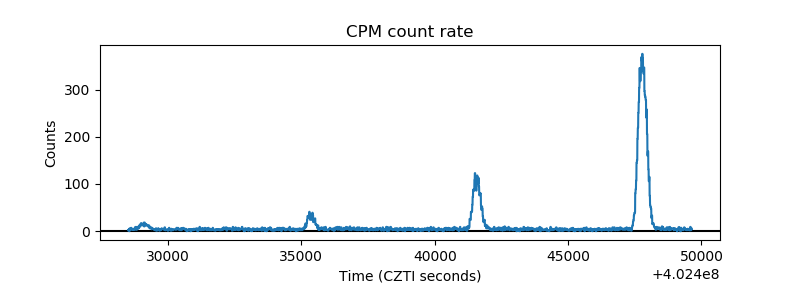 |
| CZT Counter | 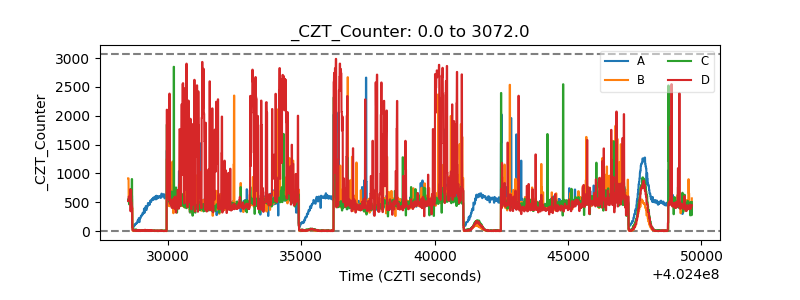 |
| +2.5 Volts monitor | 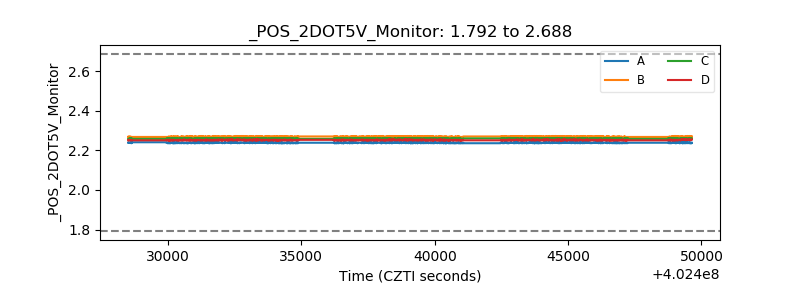 |
| +5 Volts monitor |  |
| _ROLL_ROT | 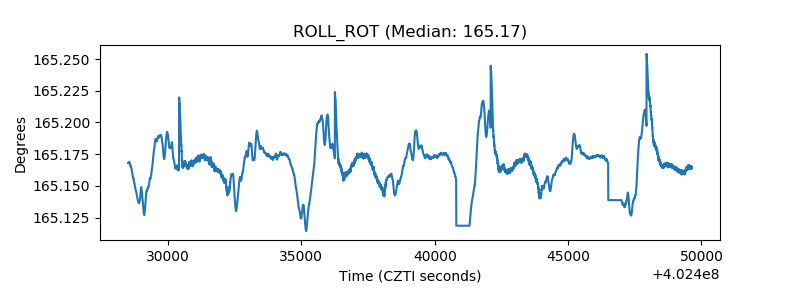 |
| _Roll_DEC | 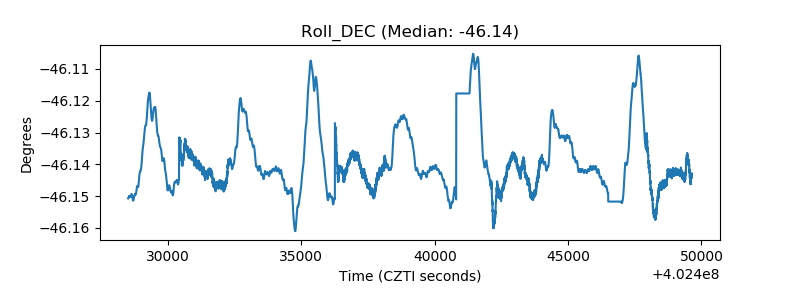 |
| _Roll_RA | 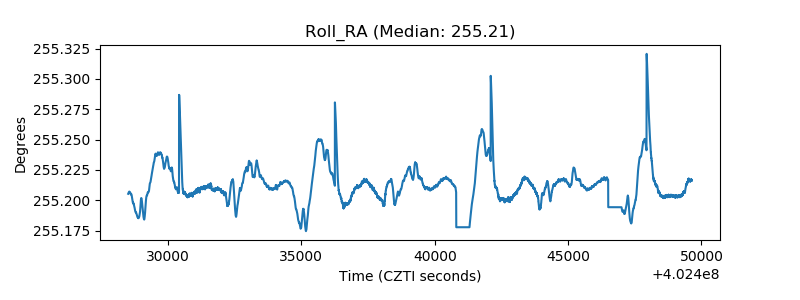 |
| Veto Counter | 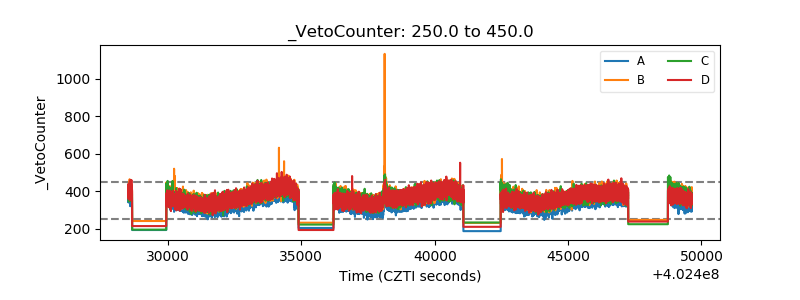 |