| Param | Original file | Final file |
|---|---|---|
| Filename | modeM0/AS1T05_059T01_9000005354_37921cztM0_level2.evt | modeM0/AS1T05_059T01_9000005354_37921cztM0_level2_quad_clean.evt |
| Size (bytes) | 427,340,160 | 58,098,240 |
| Size | 407.5 MB | 55.4 MB |
| Events in quadrant A | 3,067,493 | 353,284 |
| Events in quadrant B | 3,545,461 | 331,018 |
| Events in quadrant C | 2,990,311 | 345,917 |
| Events in quadrant D | 2,940,152 | 319,160 |
| Mode M0 | |||
|---|---|---|---|
| Quadrant | BADHDUFLAG | Total packets | Discarded packets |
| A | 0 | 12579 | 3 |
| B | 0 | 14407 | 2 |
| C | 0 | 12315 | 2 |
| D | 0 | 12833 | 2 |
| Mode SS | |||
|---|---|---|---|
| Quadrant | BADHDUFLAG | Total packets | Discarded packets |
| A | 0 | 122 | 0 |
| B | 0 | 122 | 0 |
| C | 0 | 122 | 0 |
| D | 0 | 122 | 0 |
| Mode M9 | |||
|---|---|---|---|
| Quadrant | BADHDUFLAG | Total packets | Discarded packets |
| A | 0 | 31 | 0 |
| B | 0 | 31 | 0 |
| C | 0 | 31 | 0 |
| D | 0 | 31 | 0 |
| Quadrant | Total seconds | Saturated seconds | Saturation percentage |
|---|---|---|---|
| A | 5860 | 7 | 0.119454% |
| B | 5860 | 292 | 4.982935% |
| C | 5860 | 36 | 0.614334% |
| D | 5860 | 49 | 0.836177% |
Noise dominated data is calculated using 1-second bins in cleaned event files. If a bin has >2000 counts, and if more than 50% of those come from <1% of pixels, then it is considered to be noise-dominated and hence unusable.
| Quadrant | # 1 sec bins | Bins with >0 counts | Bins with >2000 counts | High rate bins dominated by noise | Noise dominated (total time) | Noise dominated (detector-on time) | Marked lightcurve |
|---|---|---|---|---|---|---|---|
| A | 8994 | 5862 | 5 | 5 | 0.06% | 0.09% | 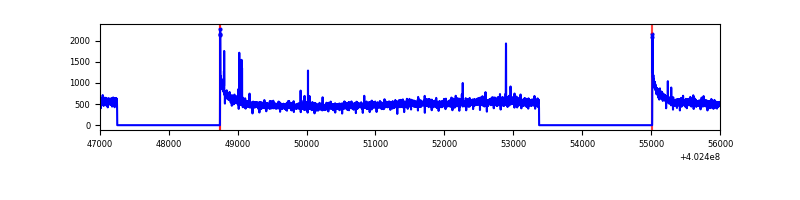 |
| B | 8994 | 5862 | 211 | 211 | 2.35% | 3.60% | 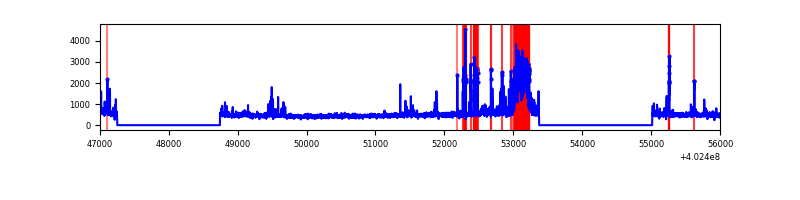 |
| C | 8994 | 5862 | 22 | 22 | 0.24% | 0.38% | 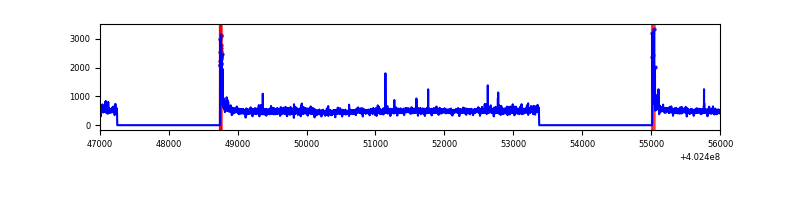 |
| D | 8994 | 5862 | 52 | 52 | 0.58% | 0.89% | 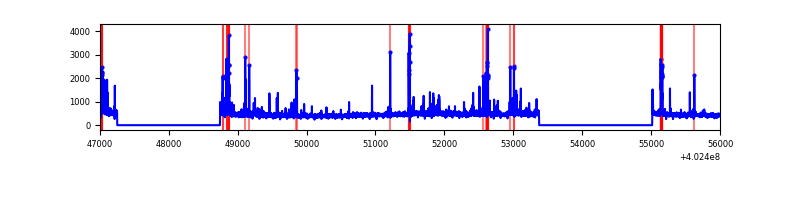 |
Top three noisy pixels from each quadrant. If the there are fewer than three noisy pixels in the level2.evt file, extra rows are filled as -1
| Pixel properties | Quadrant properties | ||||||
|---|---|---|---|---|---|---|---|
| Quadrant | DetID | PixID | Counts | Sigma | Mean | Median | Sigma |
| A | 10 | 83 | 372766 | 2753.83 | 663 | 647 | 135.1 |
| A | 15 | 222 | 87181 | 640.39 | 663 | 647 | 135.1 |
| A | 12 | 189 | 15177 | 107.53 | 663 | 647 | 135.1 |
| B | 5 | 172 | 671401 | 5397.26 | 646 | 630 | 124.3 |
| B | 0 | 229 | 152464 | 1221.71 | 646 | 630 | 124.3 |
| B | 0 | 230 | 77407 | 617.78 | 646 | 630 | 124.3 |
| C | 15 | 214 | 246125 | 1631.11 | 645 | 649 | 150.5 |
| C | 0 | 10 | 128160 | 847.27 | 645 | 649 | 150.5 |
| C | 14 | 67 | 60100 | 395.03 | 645 | 649 | 150.5 |
| D | 10 | 199 | 68006 | 427.49 | 646 | 628 | 157.6 |
| D | 2 | 249 | 60924 | 382.56 | 646 | 628 | 157.6 |
| D | 13 | 249 | 58861 | 369.47 | 646 | 628 | 157.6 |
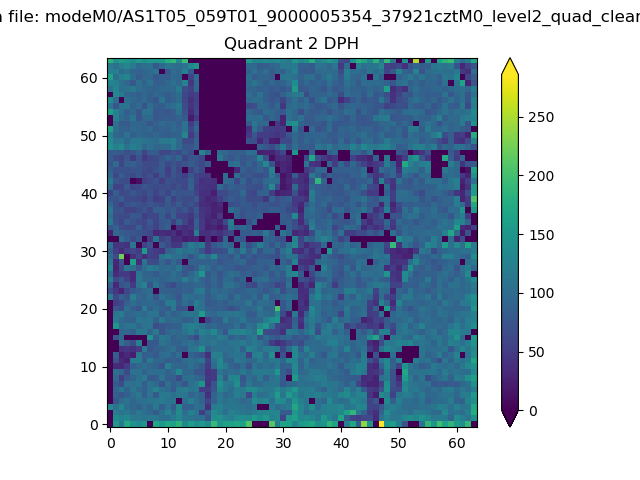
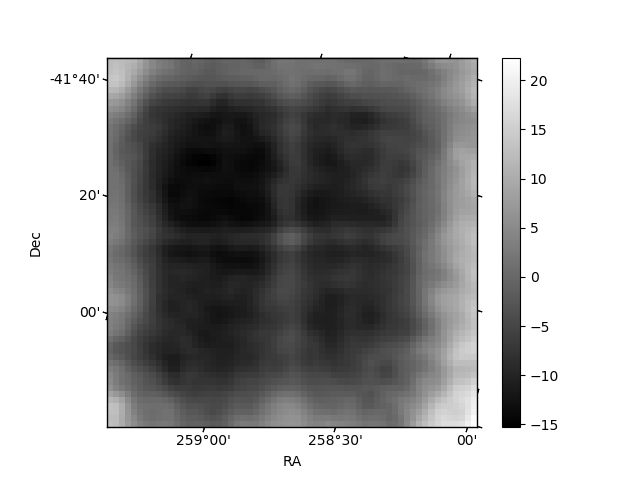
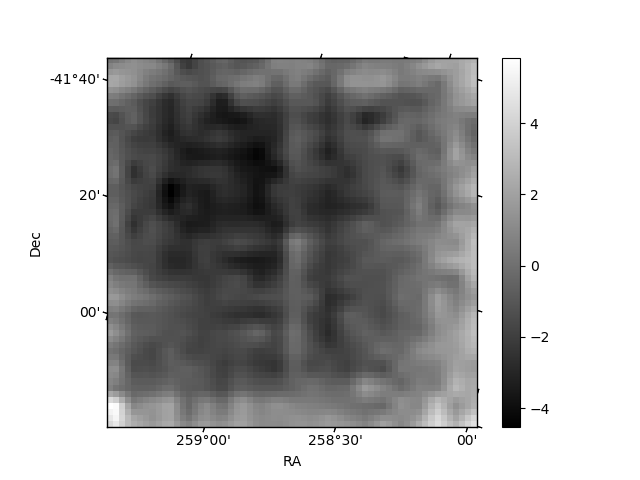
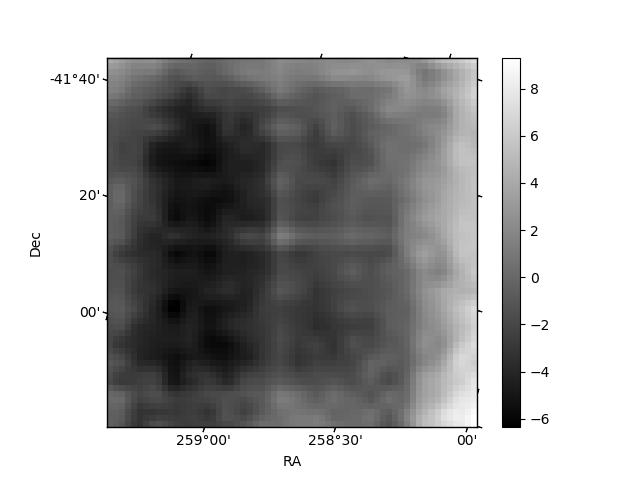
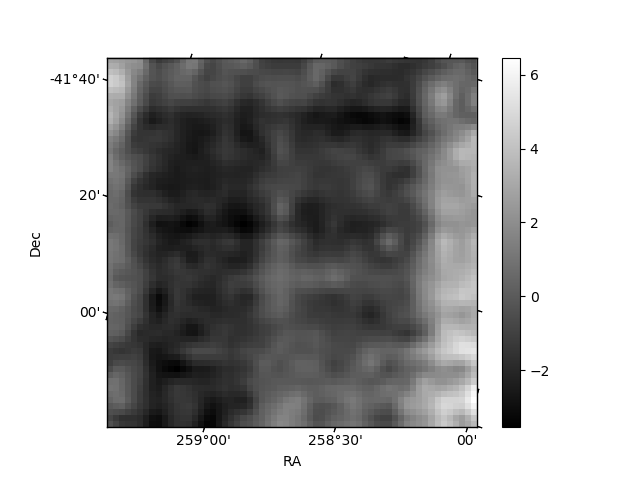
Histogram calculated using DETX and DETY for each event in the final _common_clean file
| Quadrant A | 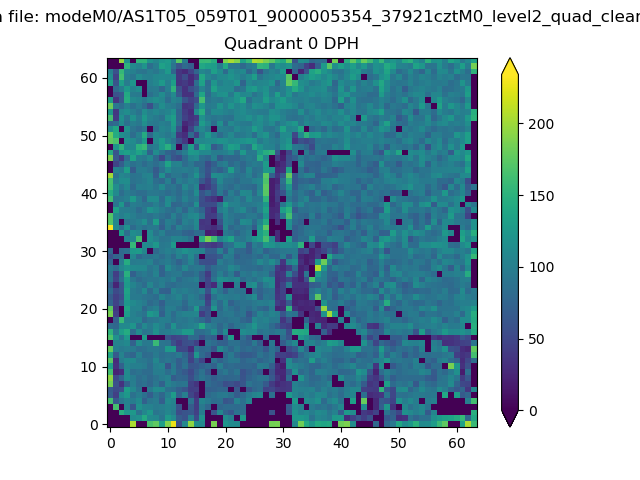 |
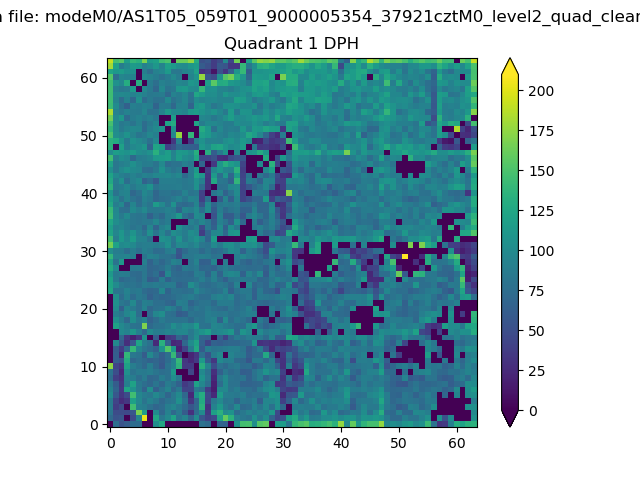 |
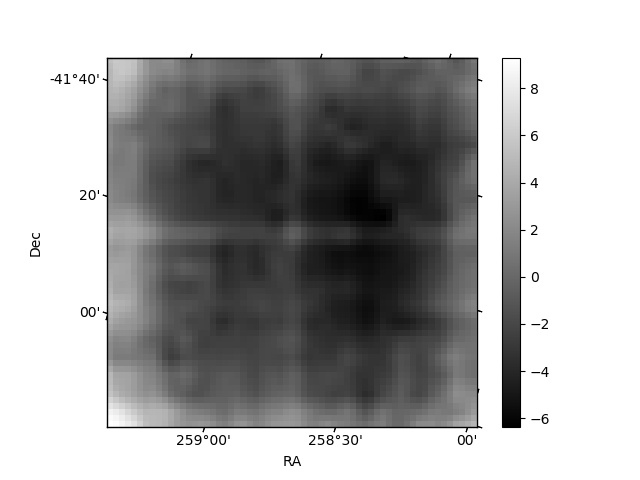
Quadrant B |
|---|---|---|---|
| Quadrant D | 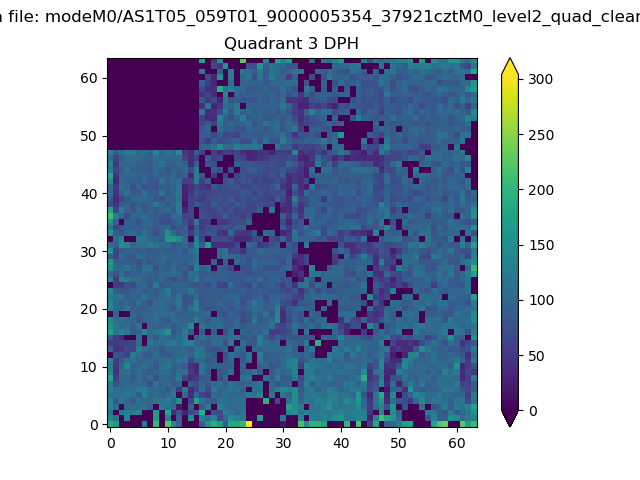 |
 |
Quadrant C |
| Plot type | Count rate plots | Images |
|---|---|---|
| Comparison with Poisson distribution Blue bars denote a histogram of data divided into 1 sec bins. Red curve is a Poisson curve with rate = median count rate of data. |
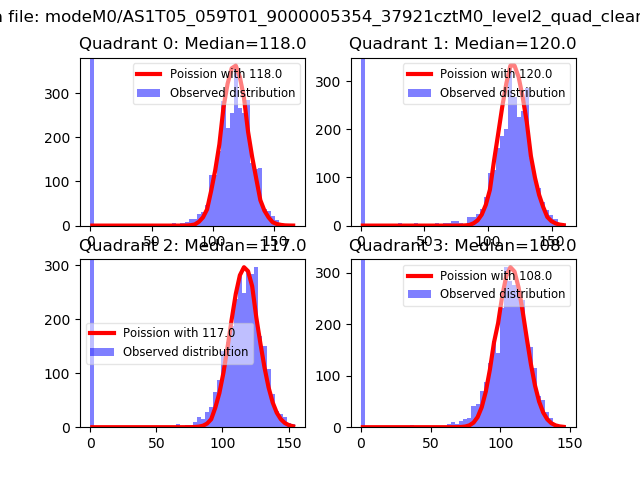 |
 |
| Quadrant-wise count rates Data is divided into 100 sec bins |
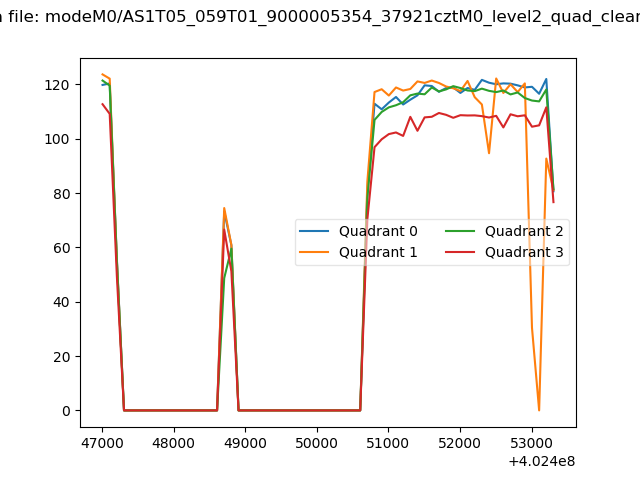 |
|
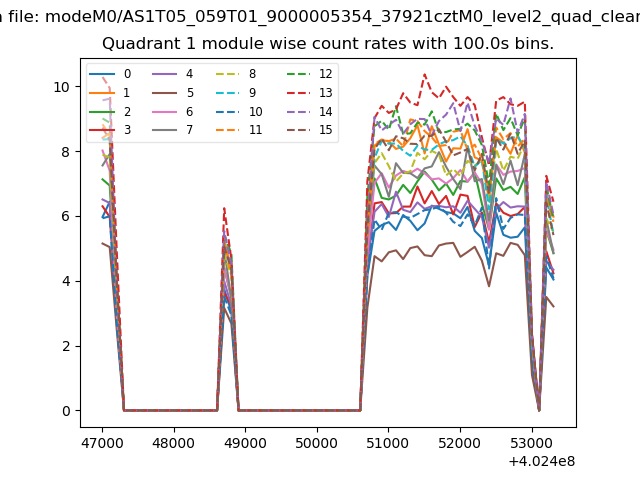
| Module-wise count rates for Quadrant A Data is divided into 100 sec bins |
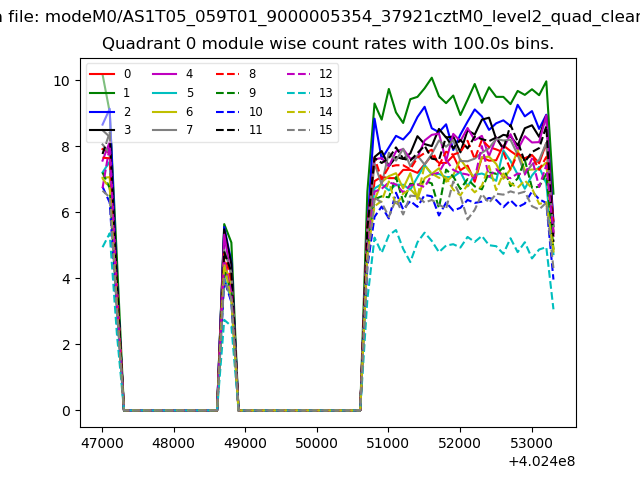 |
 |
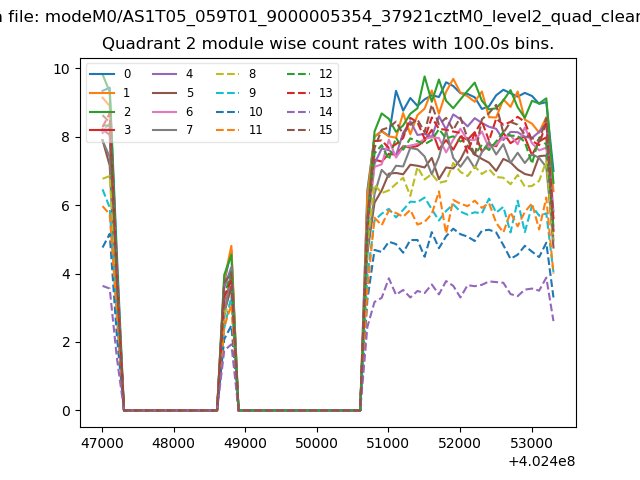
| Module-wise count rates for Quadrant B Data is divided into 100 sec bins |
 |
 |
| Module-wise count rates for Quadrant C Data is divided into 100 sec bins |
 |
 |
| Module-wise count rates for Quadrant D Data is divided into 100 sec bins |
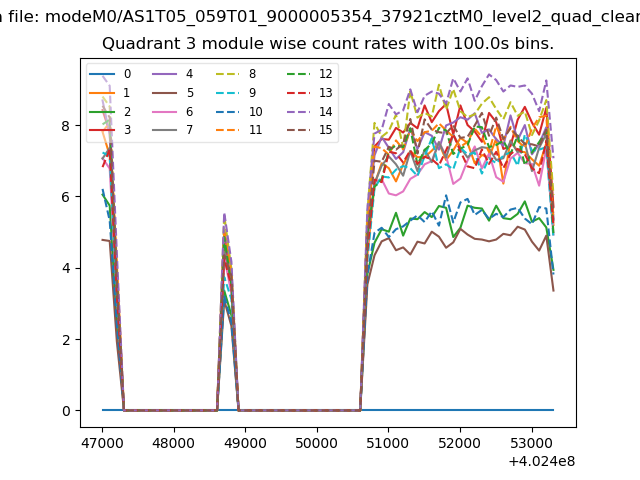 |
 |
| Parameter | Plot |
|---|---|
| CZT HV Monitor | 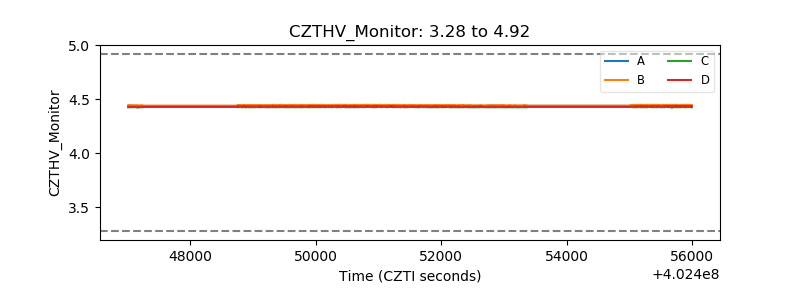 |
| D_VDD | 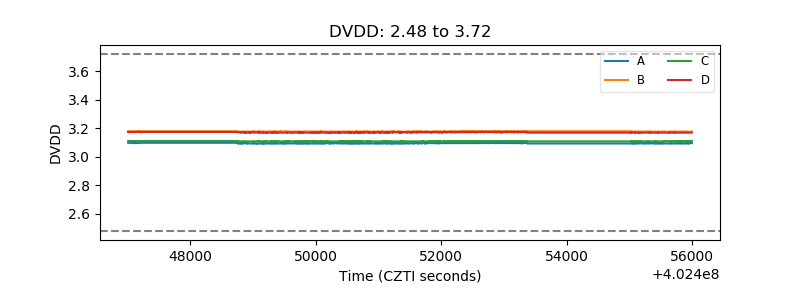 |
| Temperature 1 | 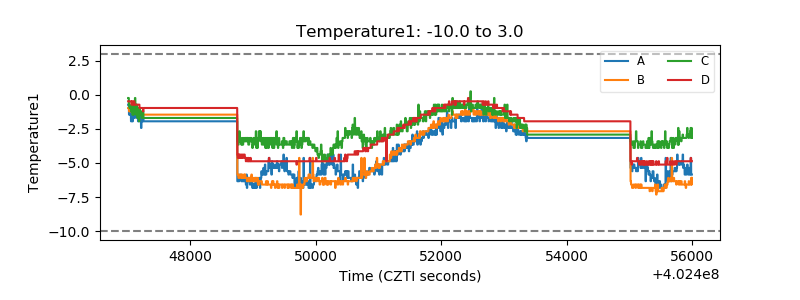 |
| Veto HV Monitor | 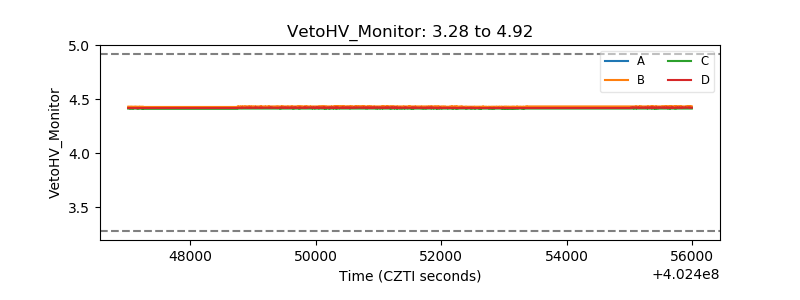 |
| Veto LLD | 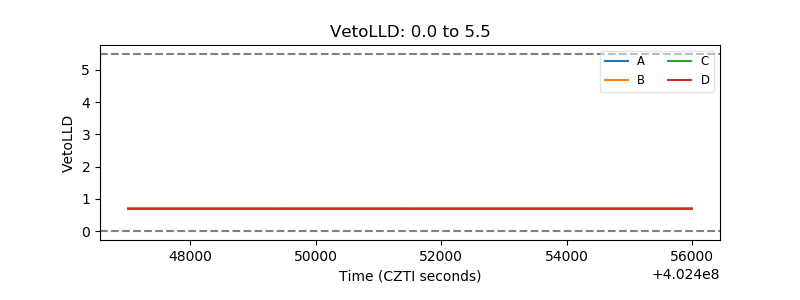 |
| Alpha Counter | 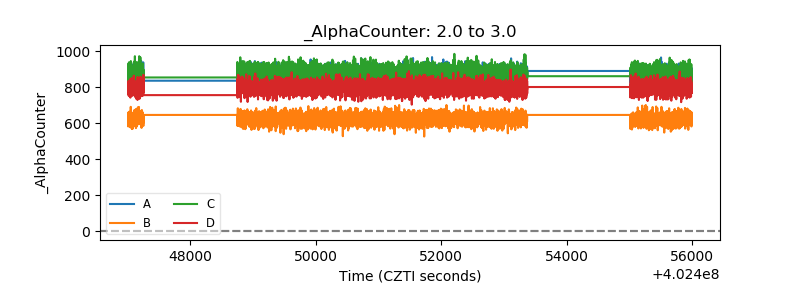 |
| _CPM_Rate | 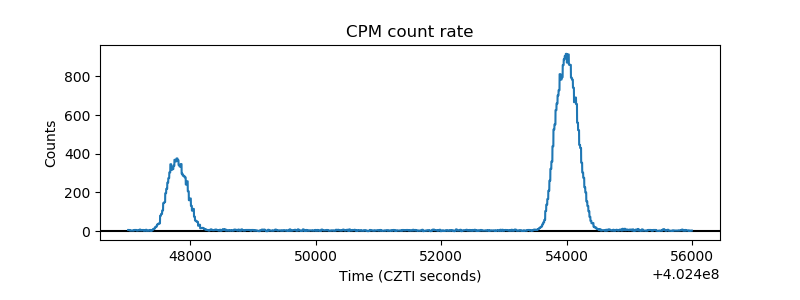 |
| CZT Counter | 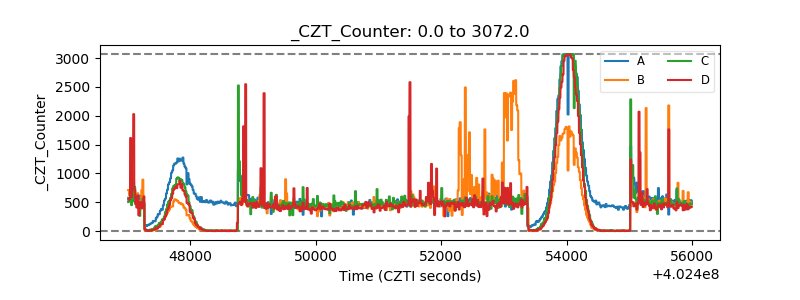 |
| +2.5 Volts monitor | 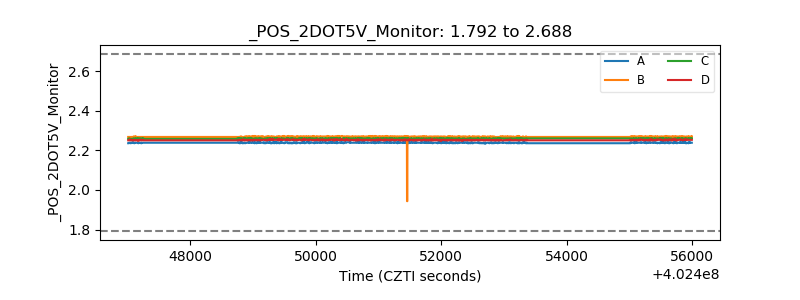 |
| +5 Volts monitor |  |
| _ROLL_ROT | 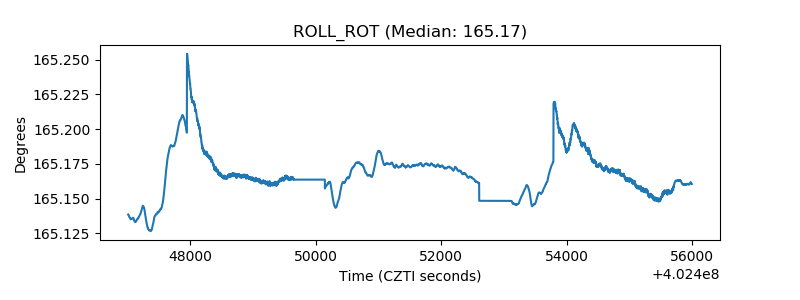 |
| _Roll_DEC | 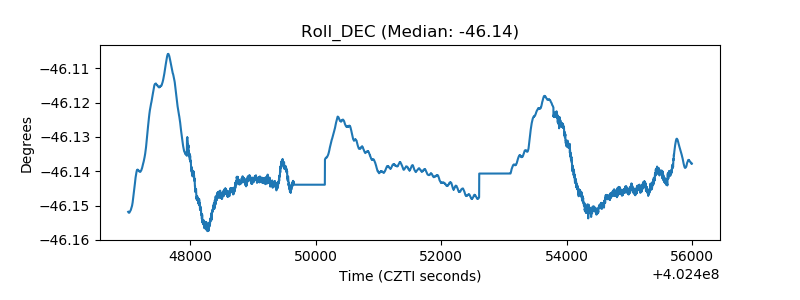 |
| _Roll_RA | 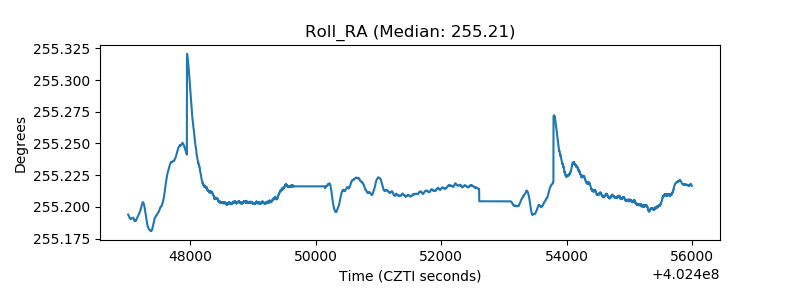 |
| Veto Counter | 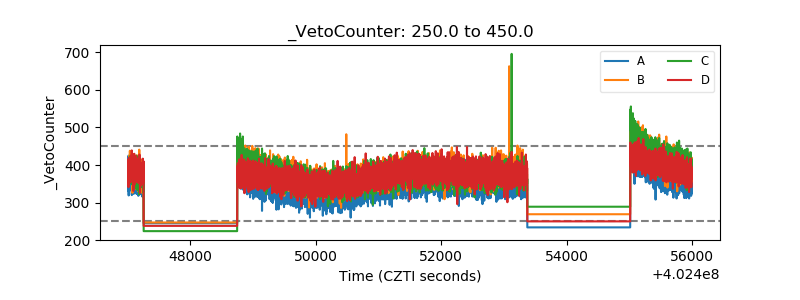 |