| Param | Original file | Final file |
|---|---|---|
| Filename | modeM0/AS1T05_059T01_9000005354_37923cztM0_level2.evt | modeM0/AS1T05_059T01_9000005354_37923cztM0_level2_quad_clean.evt |
| Size (bytes) | 420,937,920 | 61,583,040 |
| Size | 401.4 MB | 58.7 MB |
| Events in quadrant A | 3,029,693 | 381,092 |
| Events in quadrant B | 3,604,121 | 364,917 |
| Events in quadrant C | 2,934,619 | 375,728 |
| Events in quadrant D | 2,792,103 | 344,269 |
| Mode M0 | |||
|---|---|---|---|
| Quadrant | BADHDUFLAG | Total packets | Discarded packets |
| A | 0 | 12169 | 3 |
| B | 0 | 14326 | 2 |
| C | 0 | 12061 | 2 |
| D | 0 | 12189 | 2 |
| Mode SS | |||
|---|---|---|---|
| Quadrant | BADHDUFLAG | Total packets | Discarded packets |
| A | 0 | 120 | 0 |
| B | 0 | 120 | 0 |
| C | 0 | 120 | 0 |
| D | 0 | 120 | 0 |
| Mode M9 | |||
|---|---|---|---|
| Quadrant | BADHDUFLAG | Total packets | Discarded packets |
| A | 0 | 33 | 0 |
| B | 0 | 33 | 0 |
| C | 0 | 33 | 0 |
| D | 0 | 33 | 0 |
| Quadrant | Total seconds | Saturated seconds | Saturation percentage |
|---|---|---|---|
| A | 5694 | 9 | 0.158061% |
| B | 5694 | 233 | 4.092027% |
| C | 5694 | 40 | 0.702494% |
| D | 5694 | 42 | 0.737619% |
Noise dominated data is calculated using 1-second bins in cleaned event files. If a bin has >2000 counts, and if more than 50% of those come from <1% of pixels, then it is considered to be noise-dominated and hence unusable.
| Quadrant | # 1 sec bins | Bins with >0 counts | Bins with >2000 counts | High rate bins dominated by noise | Noise dominated (total time) | Noise dominated (detector-on time) | Marked lightcurve |
|---|---|---|---|---|---|---|---|
| A | 9099 | 5696 | 4 | 4 | 0.04% | 0.07% | 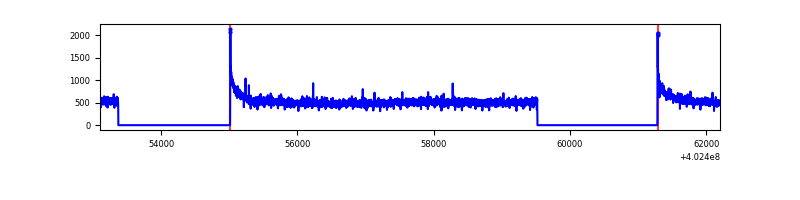 |
| B | 9099 | 5696 | 176 | 176 | 1.93% | 3.09% | 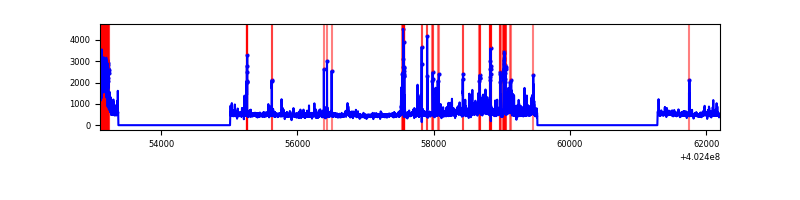 |
| C | 9099 | 5696 | 24 | 24 | 0.26% | 0.42% | 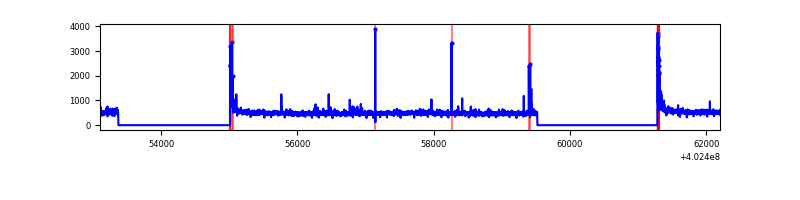 |
| D | 9099 | 5696 | 39 | 39 | 0.43% | 0.68% | 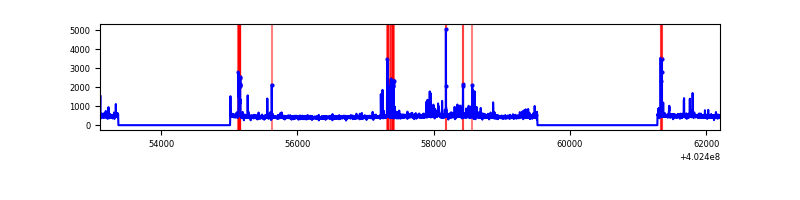 |
Top three noisy pixels from each quadrant. If the there are fewer than three noisy pixels in the level2.evt file, extra rows are filled as -1
| Pixel properties | Quadrant properties | ||||||
|---|---|---|---|---|---|---|---|
| Quadrant | DetID | PixID | Counts | Sigma | Mean | Median | Sigma |
| A | 10 | 83 | 377539 | 2830.2 | 659 | 646 | 133.2 |
| A | 15 | 222 | 78761 | 586.59 | 659 | 646 | 133.2 |
| A | 12 | 189 | 15516 | 111.66 | 659 | 646 | 133.2 |
| B | 5 | 172 | 430413 | 3502.08 | 644 | 627 | 122.7 |
| B | 0 | 229 | 257818 | 2095.7 | 644 | 627 | 122.7 |
| B | 7 | 202 | 146864 | 1191.6 | 644 | 627 | 122.7 |
| C | 15 | 214 | 239745 | 1606.13 | 642 | 646 | 148.9 |
| C | 0 | 10 | 119898 | 801.07 | 642 | 646 | 148.9 |
| C | 14 | 254 | 41132 | 271.96 | 642 | 646 | 148.9 |
| D | 10 | 199 | 53688 | 338.0 | 643 | 626 | 157.0 |
| D | 12 | 233 | 50866 | 320.02 | 643 | 626 | 157.0 |
| D | 10 | 118 | 49790 | 313.17 | 643 | 626 | 157.0 |
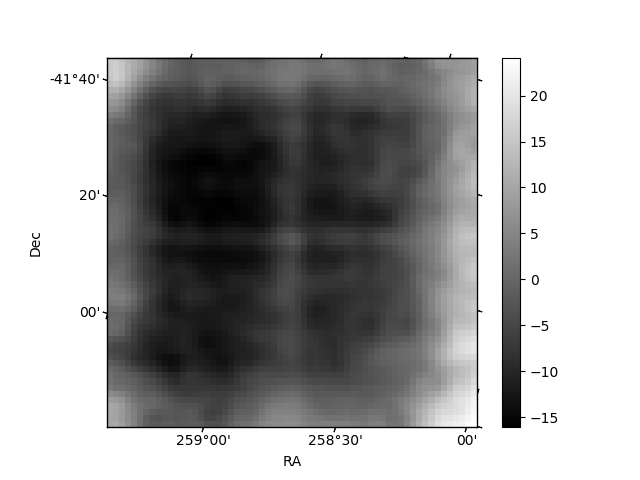
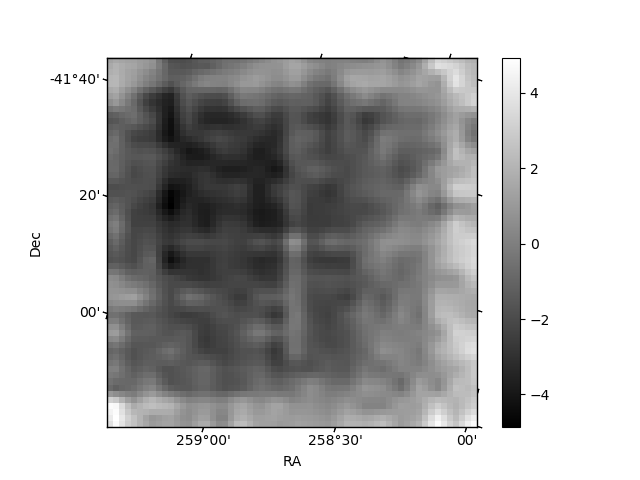
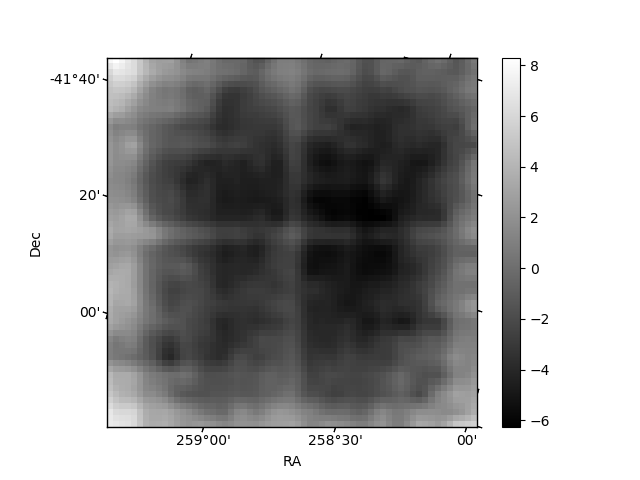
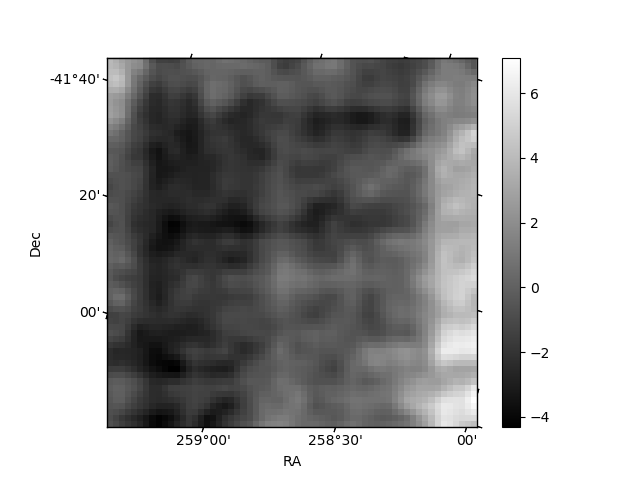
Histogram calculated using DETX and DETY for each event in the final _common_clean file
| Quadrant A | 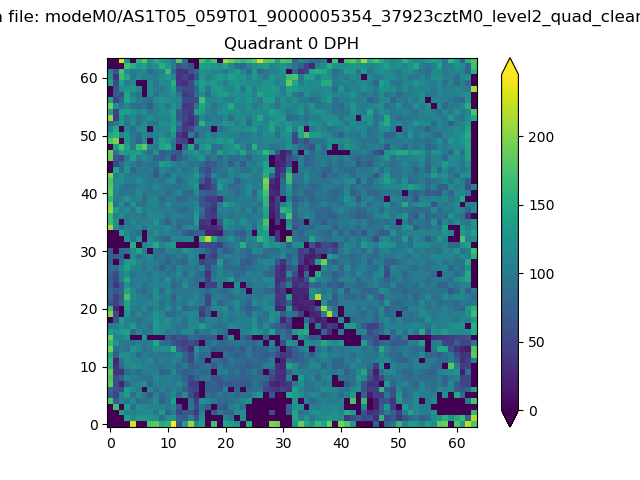 |
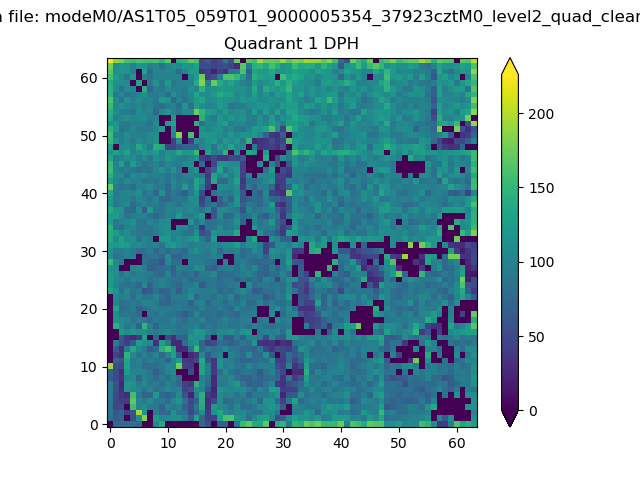 |
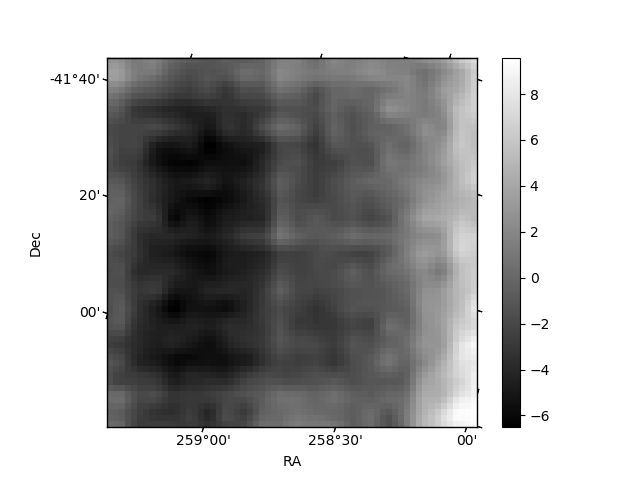
Quadrant B |
|---|---|---|---|
| Quadrant D | 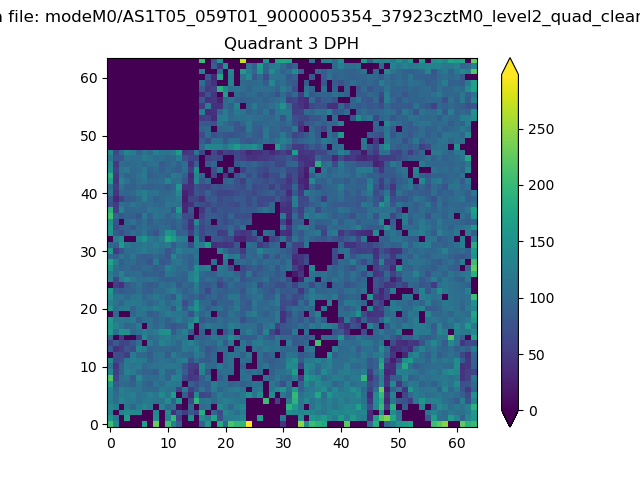 |
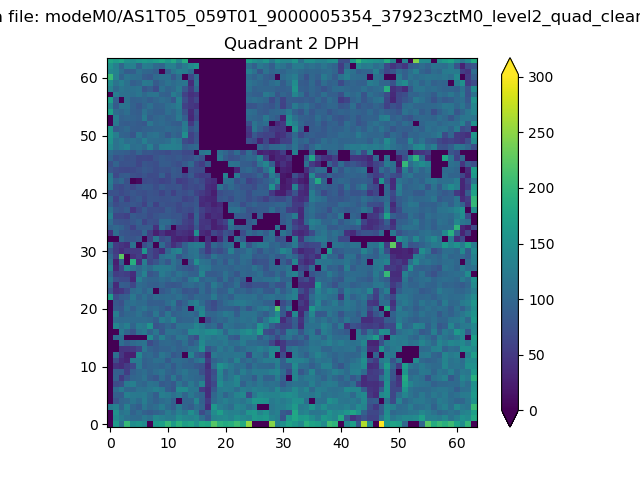 |
Quadrant C |
| Plot type | Count rate plots | Images |
|---|---|---|
| Comparison with Poisson distribution Blue bars denote a histogram of data divided into 1 sec bins. Red curve is a Poisson curve with rate = median count rate of data. |
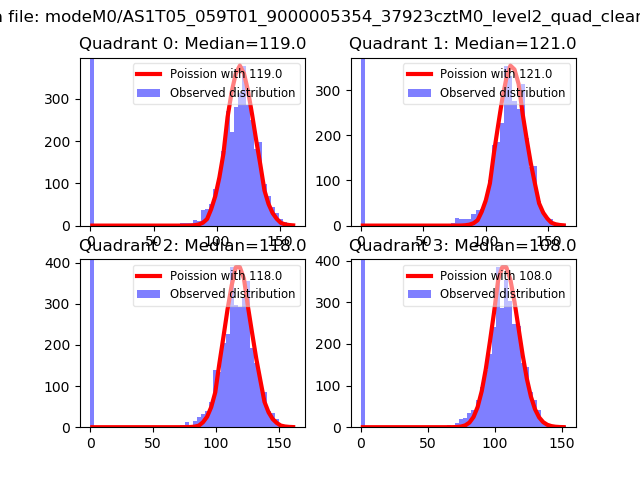 |
 |
| Quadrant-wise count rates Data is divided into 100 sec bins |
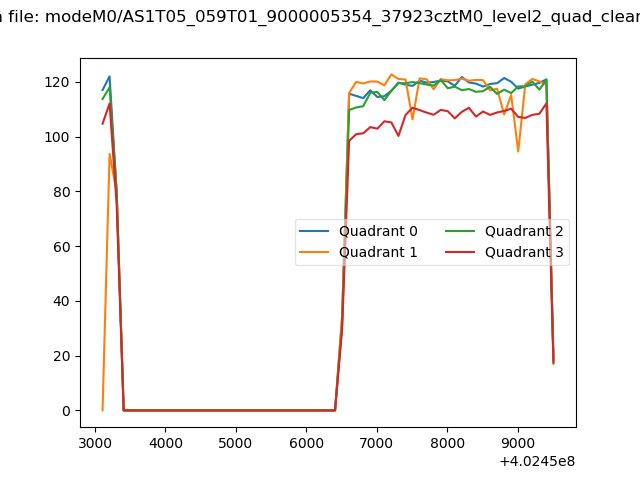 |
|
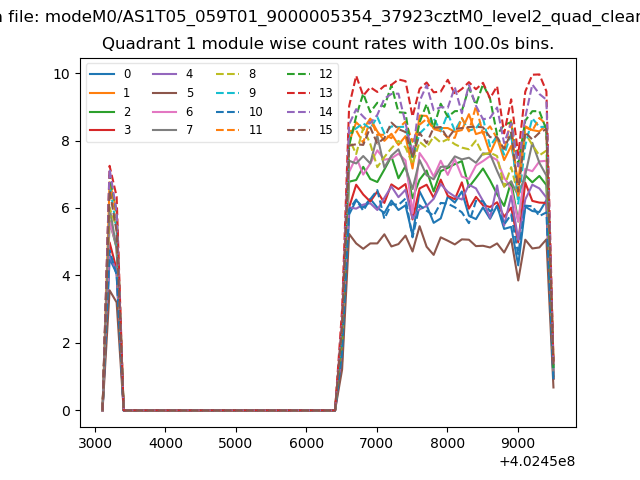
| Module-wise count rates for Quadrant A Data is divided into 100 sec bins |
 |
 |
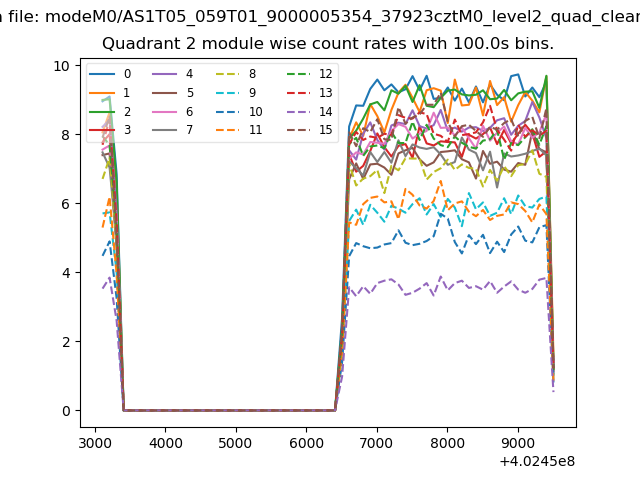
| Module-wise count rates for Quadrant B Data is divided into 100 sec bins |
 |
 |
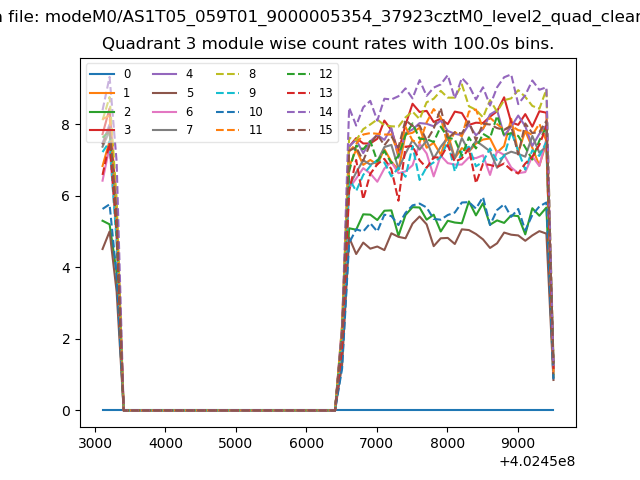
| Module-wise count rates for Quadrant C Data is divided into 100 sec bins |
 |
 |
| Module-wise count rates for Quadrant D Data is divided into 100 sec bins |
 |
 |
| Parameter | Plot |
|---|---|
| CZT HV Monitor | 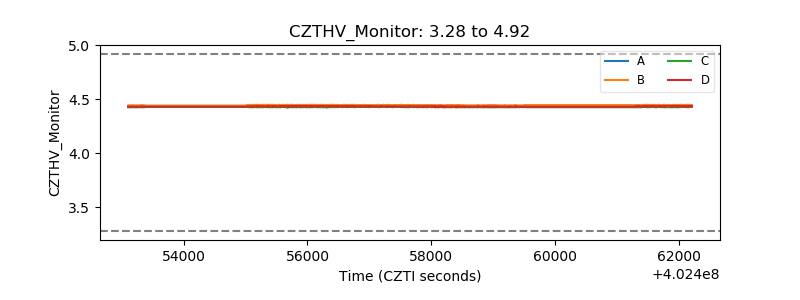 |
| D_VDD | 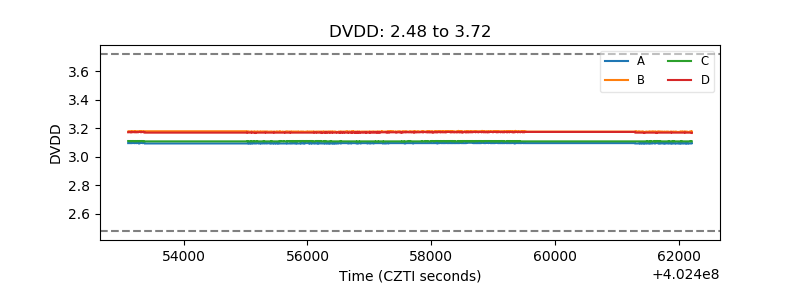 |
| Temperature 1 | 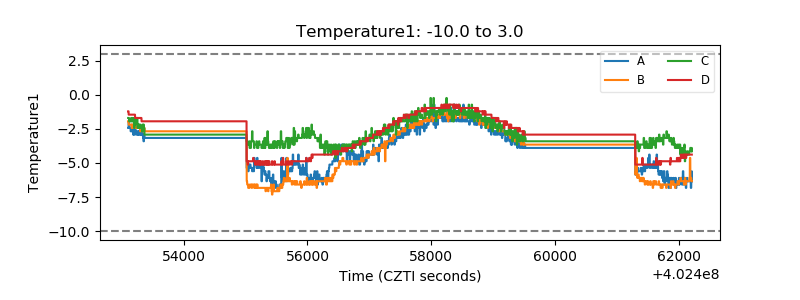 |
| Veto HV Monitor | 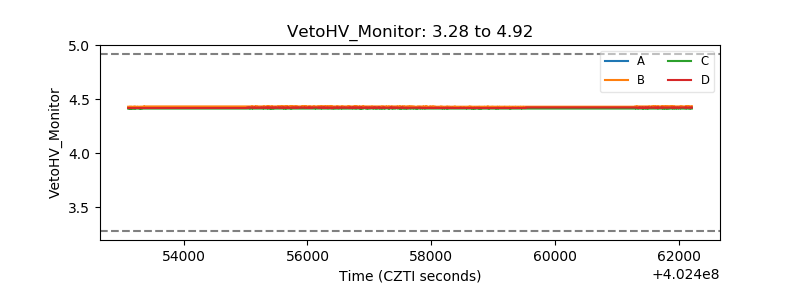 |
| Veto LLD | 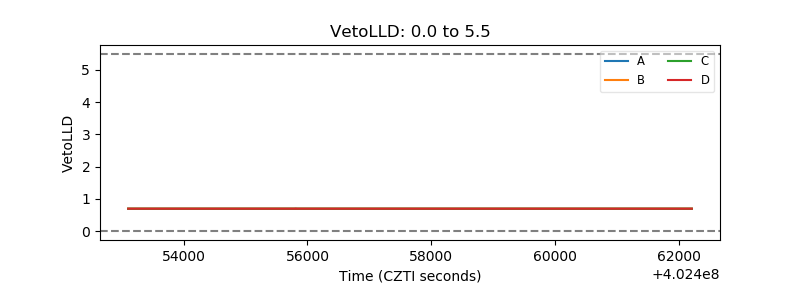 |
| Alpha Counter | 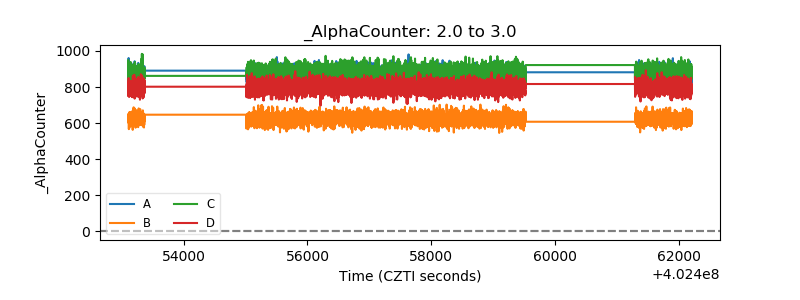 |
| _CPM_Rate | 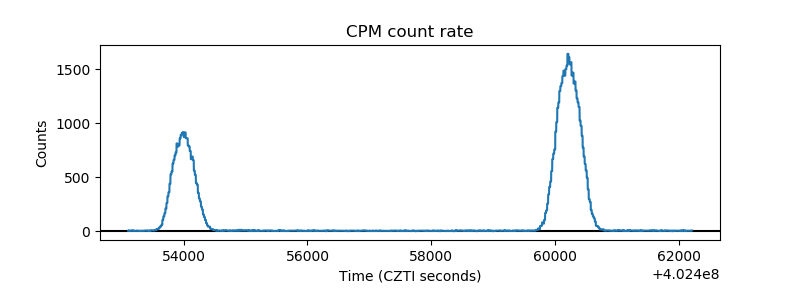 |
| CZT Counter | 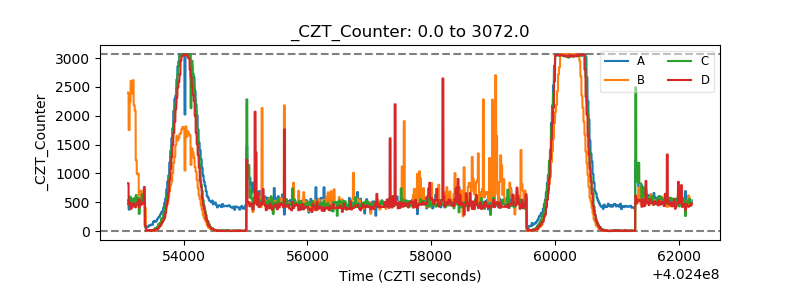 |
| +2.5 Volts monitor | 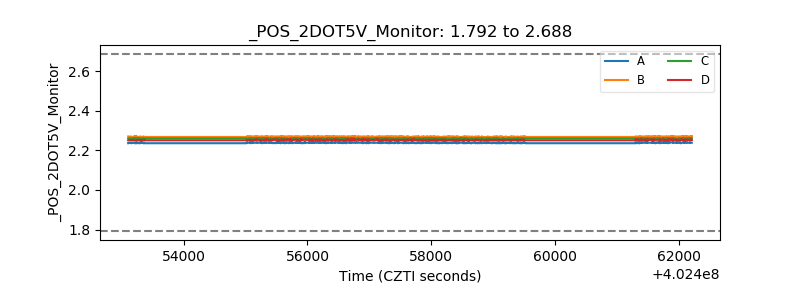 |
| +5 Volts monitor |  |
| _ROLL_ROT | 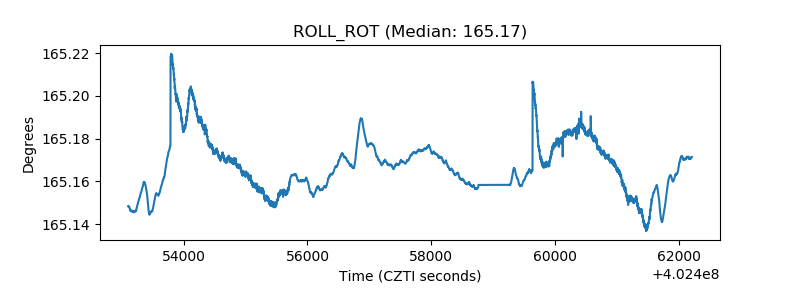 |
| _Roll_DEC | 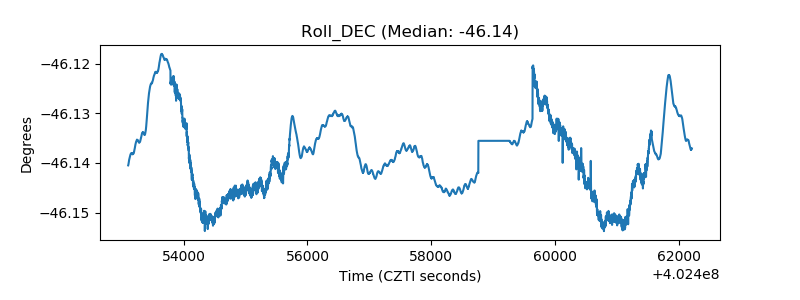 |
| _Roll_RA | 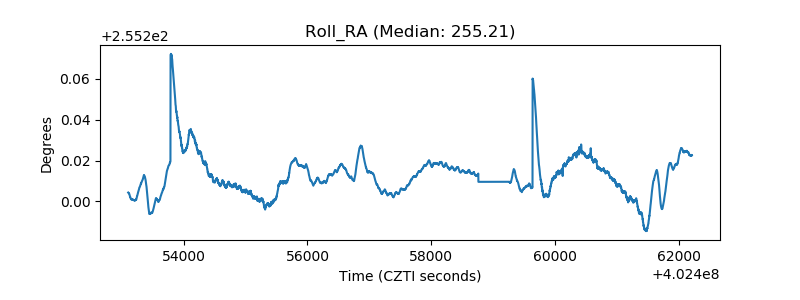 |
| Veto Counter | 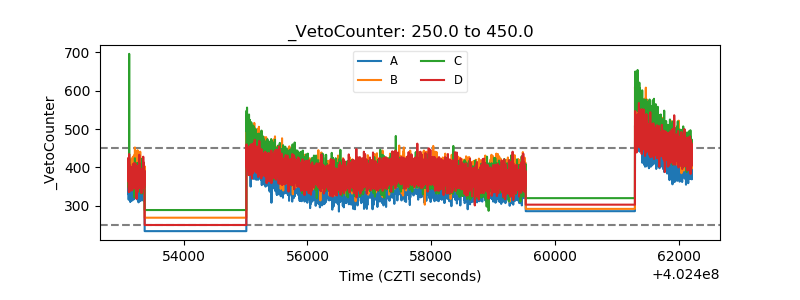 |