| Param | Original file | Final file |
|---|---|---|
| Filename | modeM0/AS1T05_059T01_9000005354_37924cztM0_level2.evt | modeM0/AS1T05_059T01_9000005354_37924cztM0_level2_quad_clean.evt |
| Size (bytes) | 420,120,000 | 67,749,120 |
| Size | 400.7 MB | 64.6 MB |
| Events in quadrant A | 2,966,135 | 426,320 |
| Events in quadrant B | 3,321,655 | 429,550 |
| Events in quadrant C | 2,962,729 | 425,241 |
| Events in quadrant D | 3,101,597 | 387,862 |
| Mode M0 | |||
|---|---|---|---|
| Quadrant | BADHDUFLAG | Total packets | Discarded packets |
| A | 0 | 11915 | 3 |
| B | 0 | 13283 | 2 |
| C | 0 | 11934 | 2 |
| D | 0 | 12704 | 2 |
| Mode SS | |||
|---|---|---|---|
| Quadrant | BADHDUFLAG | Total packets | Discarded packets |
| A | 0 | 114 | 0 |
| B | 0 | 114 | 0 |
| C | 0 | 114 | 0 |
| D | 0 | 114 | 0 |
| Mode M9 | |||
|---|---|---|---|
| Quadrant | BADHDUFLAG | Total packets | Discarded packets |
| A | 0 | 36 | 0 |
| B | 0 | 36 | 0 |
| C | 0 | 36 | 0 |
| D | 0 | 36 | 0 |
| Quadrant | Total seconds | Saturated seconds | Saturation percentage |
|---|---|---|---|
| A | 5462 | 16 | 0.292933% |
| B | 5462 | 74 | 1.354815% |
| C | 5462 | 55 | 1.006957% |
| D | 5462 | 78 | 1.428048% |
Noise dominated data is calculated using 1-second bins in cleaned event files. If a bin has >2000 counts, and if more than 50% of those come from <1% of pixels, then it is considered to be noise-dominated and hence unusable.
| Quadrant | # 1 sec bins | Bins with >0 counts | Bins with >2000 counts | High rate bins dominated by noise | Noise dominated (total time) | Noise dominated (detector-on time) | Marked lightcurve |
|---|---|---|---|---|---|---|---|
| A | 9138 | 5464 | 4 | 4 | 0.04% | 0.07% | 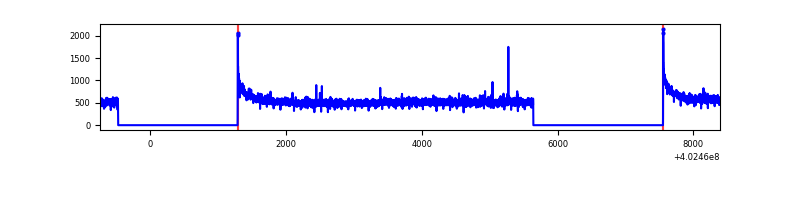 |
| B | 9138 | 5464 | 41 | 41 | 0.45% | 0.75% | 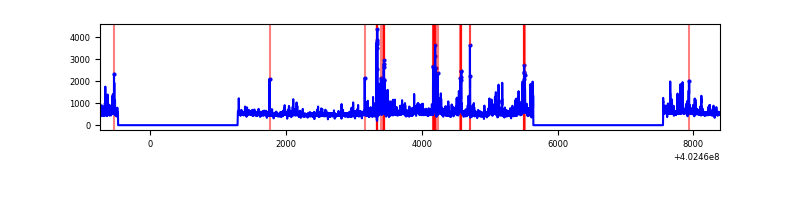 |
| C | 9138 | 5464 | 40 | 40 | 0.44% | 0.73% | 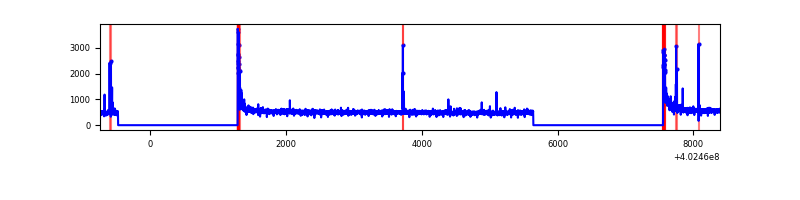 |
| D | 9138 | 5464 | 69 | 69 | 0.76% | 1.26% | 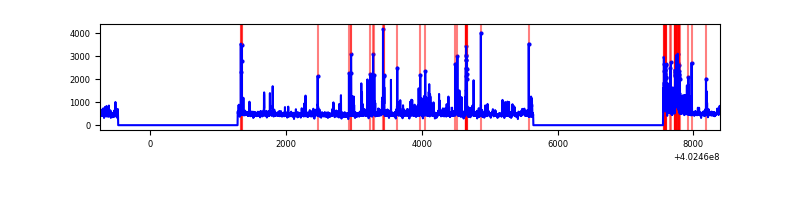 |
Top three noisy pixels from each quadrant. If the there are fewer than three noisy pixels in the level2.evt file, extra rows are filled as -1
| Pixel properties | Quadrant properties | ||||||
|---|---|---|---|---|---|---|---|
| Quadrant | DetID | PixID | Counts | Sigma | Mean | Median | Sigma |
| A | 10 | 83 | 372665 | 2810.58 | 659 | 648 | 132.4 |
| A | 12 | 189 | 24202 | 177.95 | 659 | 648 | 132.4 |
| A | 13 | 6 | 11852 | 84.65 | 659 | 648 | 132.4 |
| B | 5 | 172 | 280782 | 2262.86 | 650 | 633 | 123.8 |
| B | 0 | 229 | 205727 | 1656.62 | 650 | 633 | 123.8 |
| B | 0 | 213 | 103017 | 826.99 | 650 | 633 | 123.8 |
| C | 15 | 214 | 232511 | 1580.45 | 642 | 647 | 146.7 |
| C | 0 | 10 | 155540 | 1055.79 | 642 | 647 | 146.7 |
| C | 14 | 254 | 51719 | 348.12 | 642 | 647 | 146.7 |
| D | 12 | 217 | 236862 | 1532.67 | 640 | 624 | 154.1 |
| D | 12 | 233 | 82940 | 534.05 | 640 | 624 | 154.1 |
| D | 2 | 250 | 69907 | 449.5 | 640 | 624 | 154.1 |
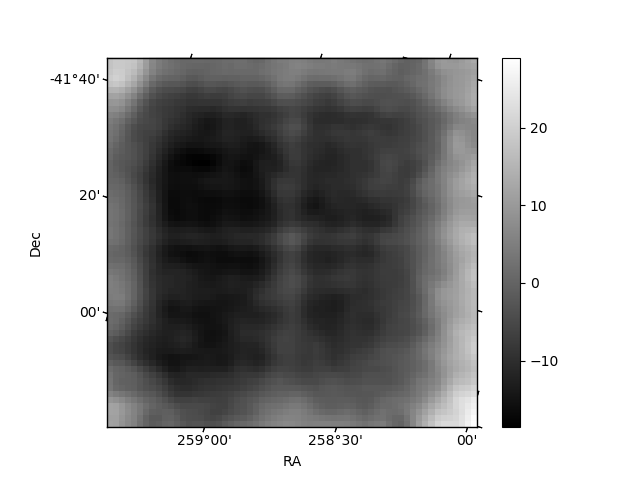
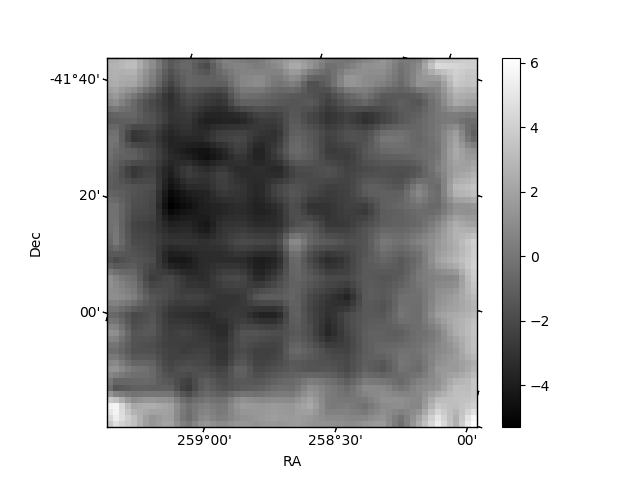
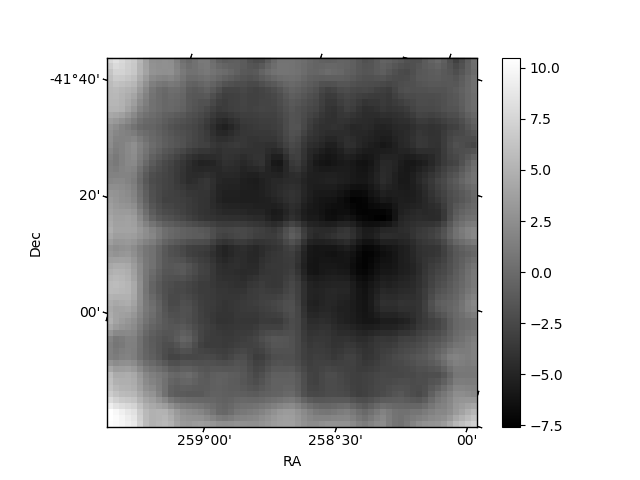
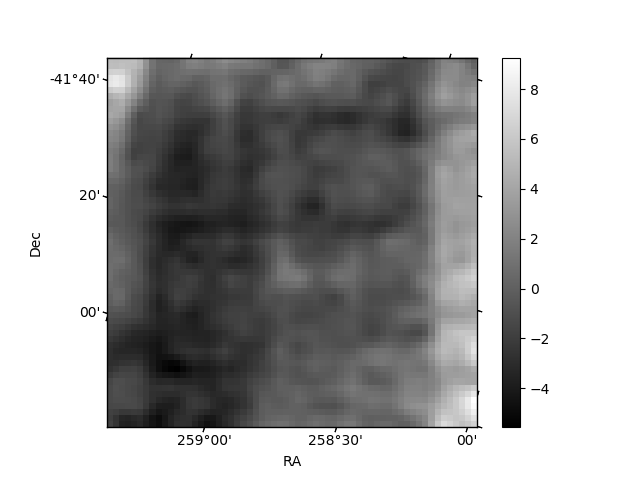
Histogram calculated using DETX and DETY for each event in the final _common_clean file
| Quadrant A | 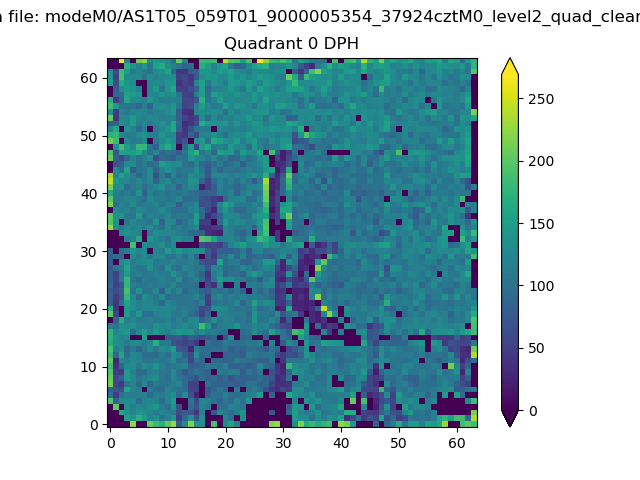 |
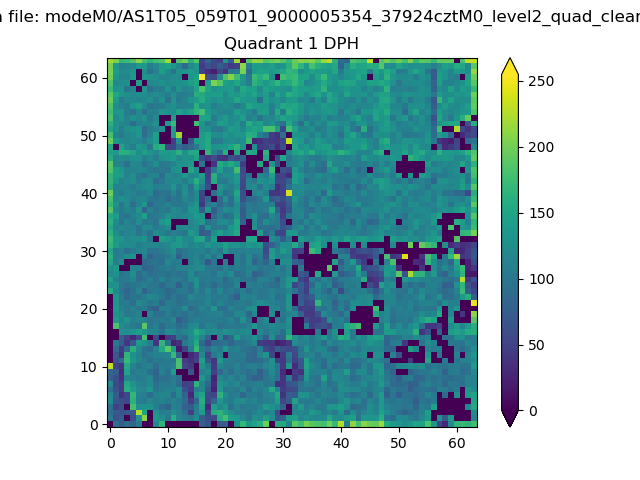 |
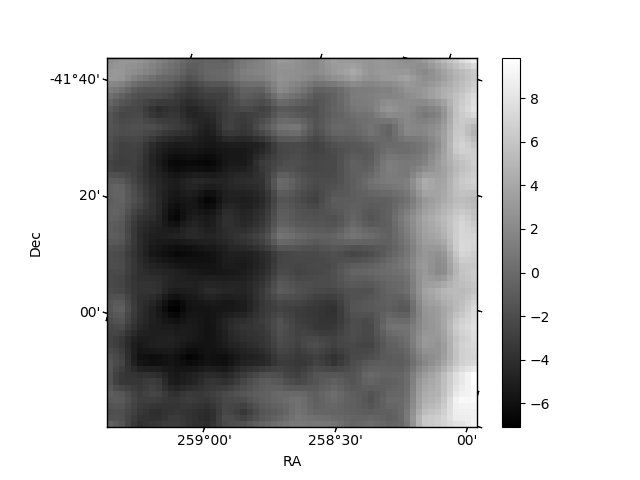
Quadrant B |
|---|---|---|---|
| Quadrant D | 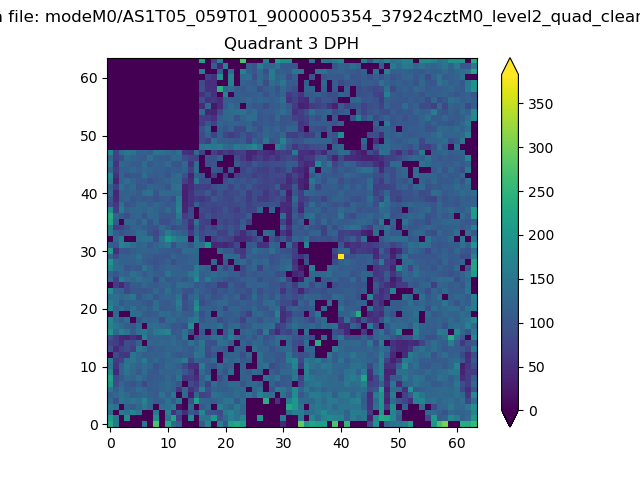 |
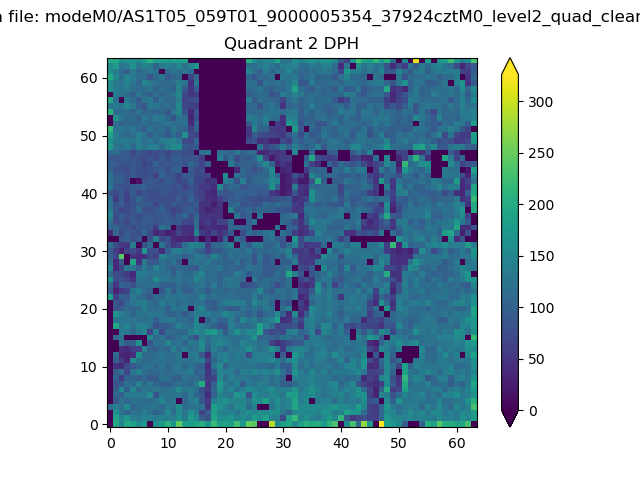 |
Quadrant C |
| Plot type | Count rate plots | Images |
|---|---|---|
| Comparison with Poisson distribution Blue bars denote a histogram of data divided into 1 sec bins. Red curve is a Poisson curve with rate = median count rate of data. |
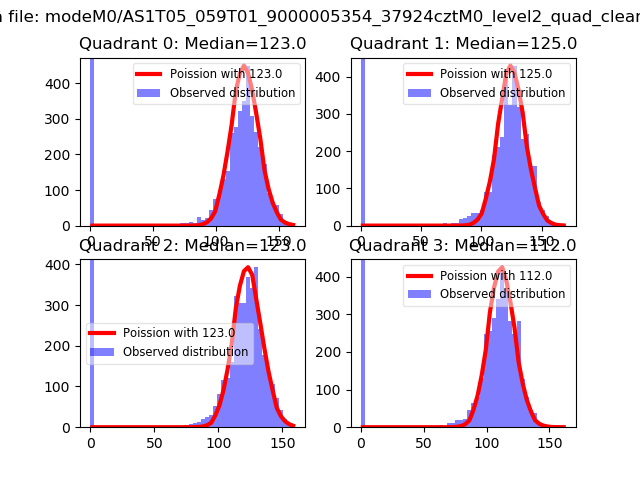 |
 |
| Quadrant-wise count rates Data is divided into 100 sec bins |
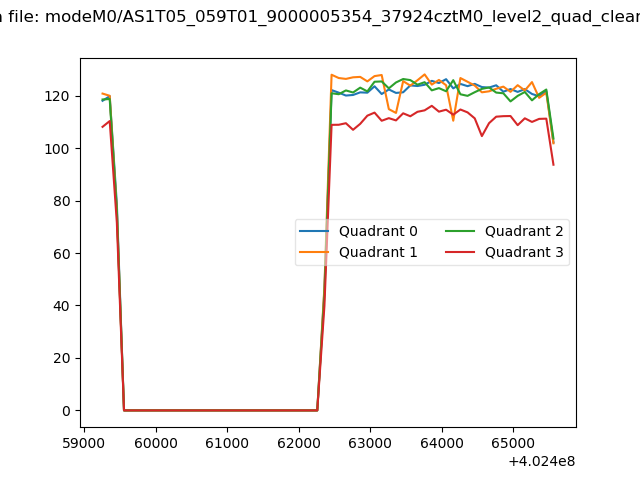 |
|
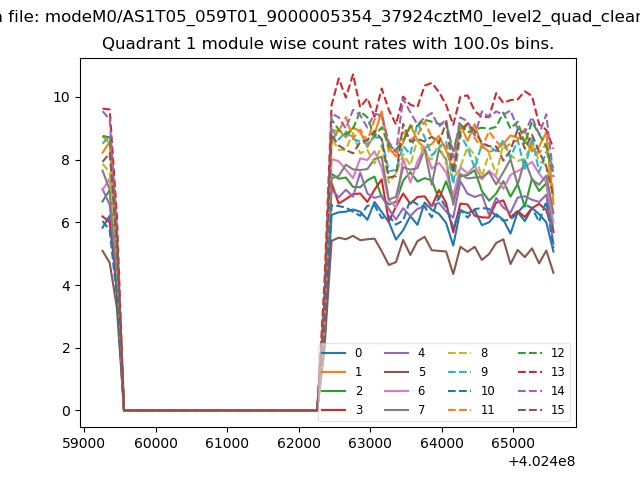
| Module-wise count rates for Quadrant A Data is divided into 100 sec bins |
 |
 |
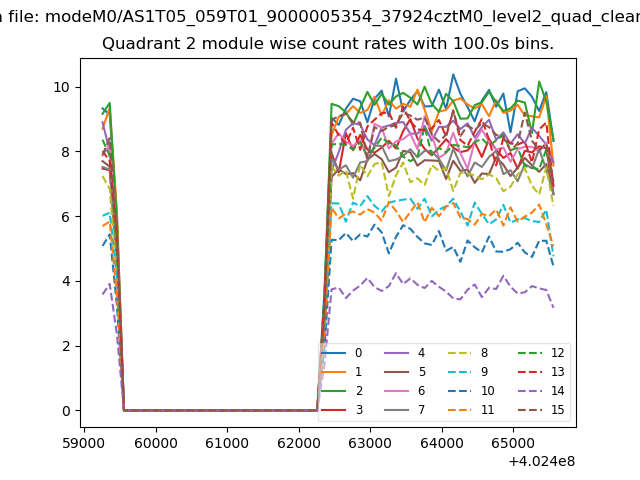
| Module-wise count rates for Quadrant B Data is divided into 100 sec bins |
 |
 |
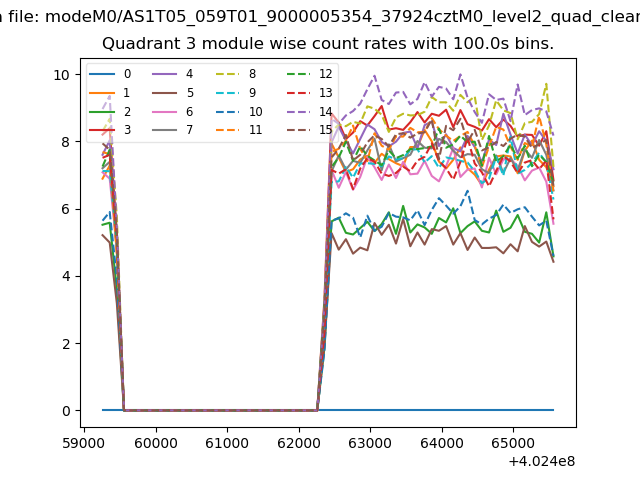
| Module-wise count rates for Quadrant C Data is divided into 100 sec bins |
 |
 |
| Module-wise count rates for Quadrant D Data is divided into 100 sec bins |
 |
 |
| Parameter | Plot |
|---|---|
| CZT HV Monitor | 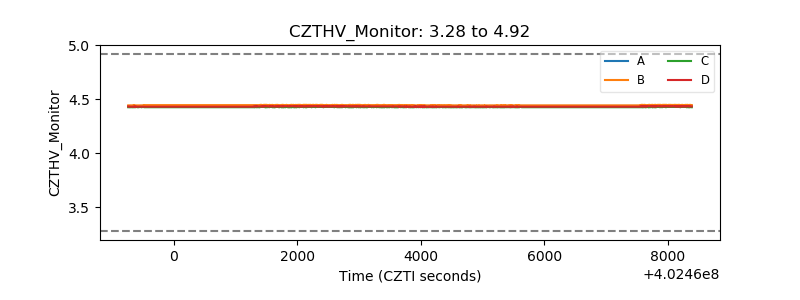 |
| D_VDD | 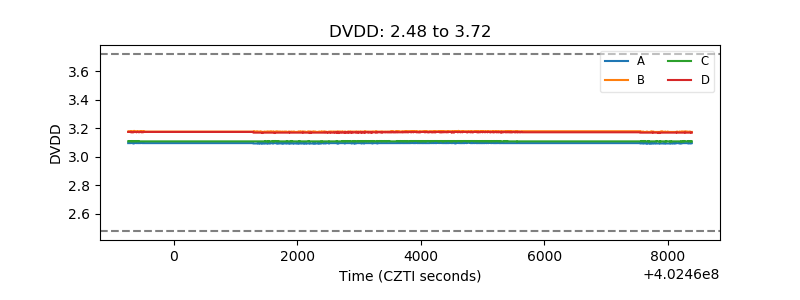 |
| Temperature 1 | 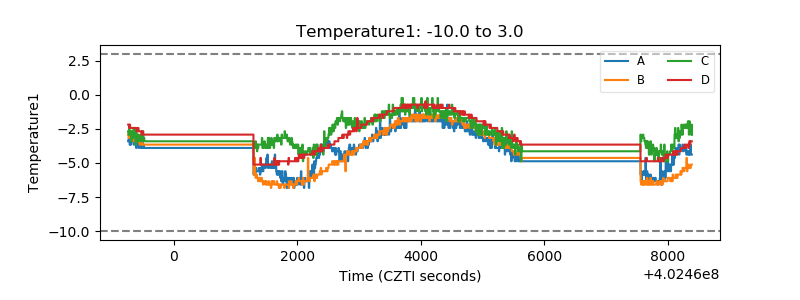 |
| Veto HV Monitor |  |
| Veto LLD | 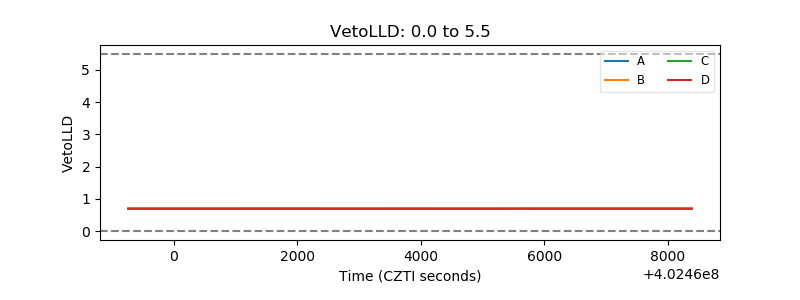 |
| Alpha Counter | 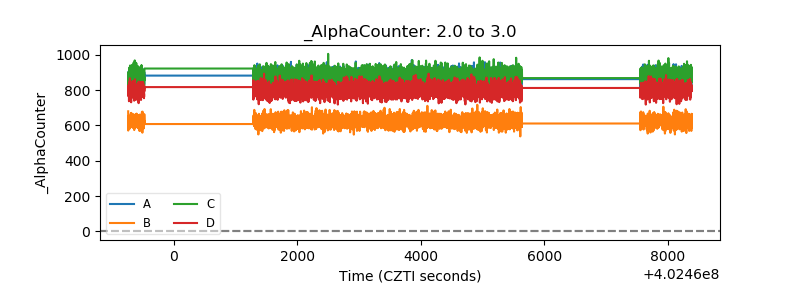 |
| _CPM_Rate | 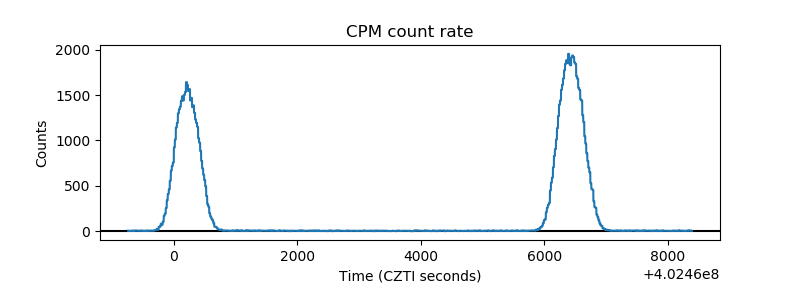 |
| CZT Counter | 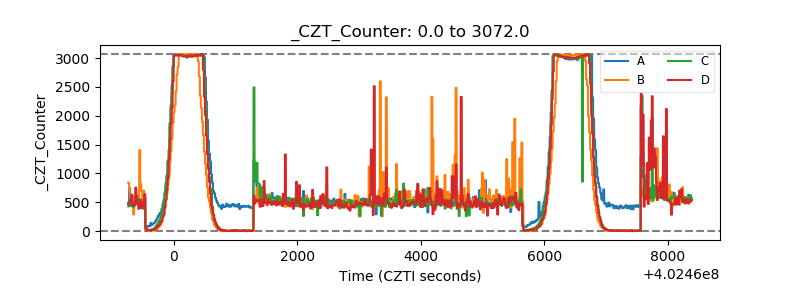 |
| +2.5 Volts monitor | 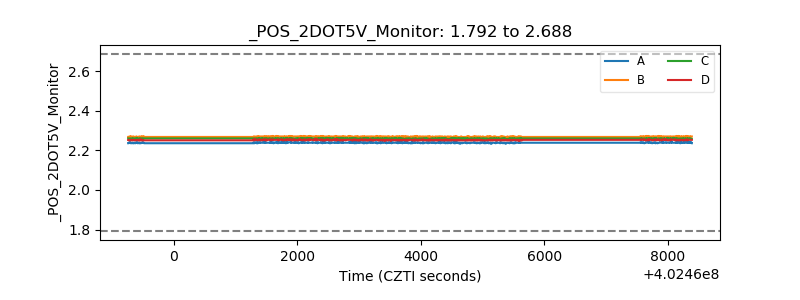 |
| +5 Volts monitor |  |
| _ROLL_ROT | 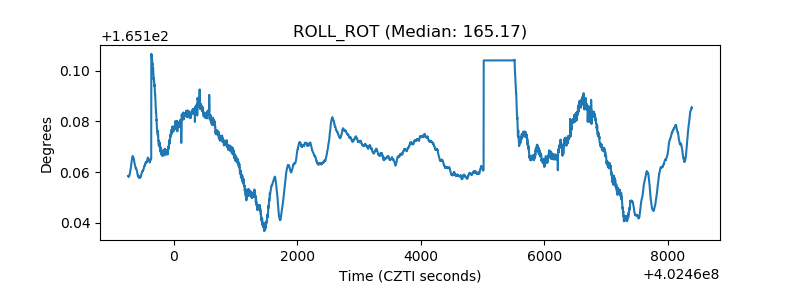 |
| _Roll_DEC | 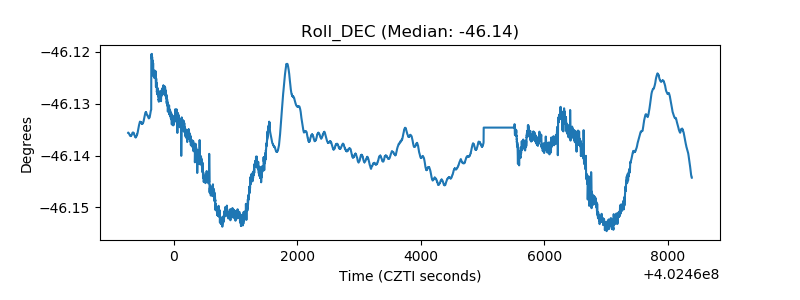 |
| _Roll_RA | 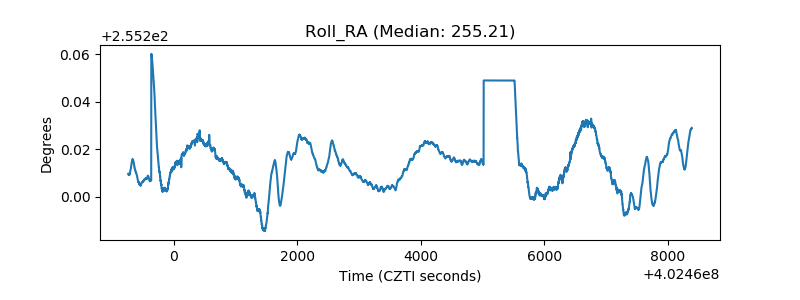 |
| Veto Counter | 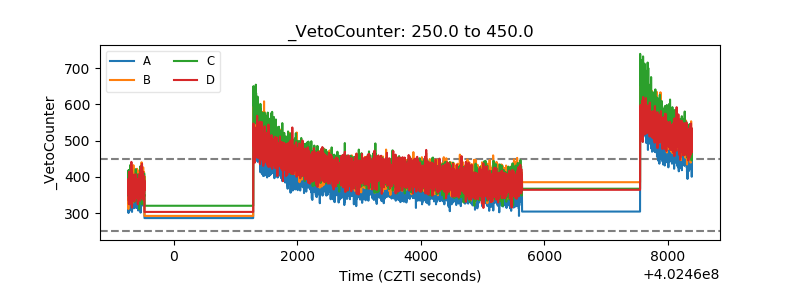 |