| Param | Original file | Final file |
|---|---|---|
| Filename | modeM0/AS1T05_059T01_9000005354_37925cztM0_level2.evt | modeM0/AS1T05_059T01_9000005354_37925cztM0_level2_quad_clean.evt |
| Size (bytes) | 421,689,600 | 60,912,000 |
| Size | 402.2 MB | 58.1 MB |
| Events in quadrant A | 2,885,444 | 384,060 |
| Events in quadrant B | 3,497,049 | 376,853 |
| Events in quadrant C | 2,927,508 | 379,478 |
| Events in quadrant D | 3,113,794 | 345,594 |
| Mode M0 | |||
|---|---|---|---|
| Quadrant | BADHDUFLAG | Total packets | Discarded packets |
| A | 0 | 11529 | 3 |
| B | 0 | 13589 | 2 |
| C | 0 | 11671 | 2 |
| D | 0 | 12520 | 2 |
| Mode SS | |||
|---|---|---|---|
| Quadrant | BADHDUFLAG | Total packets | Discarded packets |
| A | 0 | 104 | 0 |
| B | 0 | 104 | 0 |
| C | 0 | 104 | 0 |
| D | 0 | 104 | 0 |
| Mode M9 | |||
|---|---|---|---|
| Quadrant | BADHDUFLAG | Total packets | Discarded packets |
| A | 0 | 40 | 0 |
| B | 0 | 40 | 0 |
| C | 0 | 40 | 0 |
| D | 0 | 40 | 0 |
| Quadrant | Total seconds | Saturated seconds | Saturation percentage |
|---|---|---|---|
| A | 5119 | 10 | 0.195351% |
| B | 5119 | 160 | 3.125610% |
| C | 5119 | 69 | 1.347920% |
| D | 5119 | 69 | 1.347920% |
Noise dominated data is calculated using 1-second bins in cleaned event files. If a bin has >2000 counts, and if more than 50% of those come from <1% of pixels, then it is considered to be noise-dominated and hence unusable.
| Quadrant | # 1 sec bins | Bins with >0 counts | Bins with >2000 counts | High rate bins dominated by noise | Noise dominated (total time) | Noise dominated (detector-on time) | Marked lightcurve |
|---|---|---|---|---|---|---|---|
| A | 9064 | 5121 | 5 | 5 | 0.06% | 0.10% | 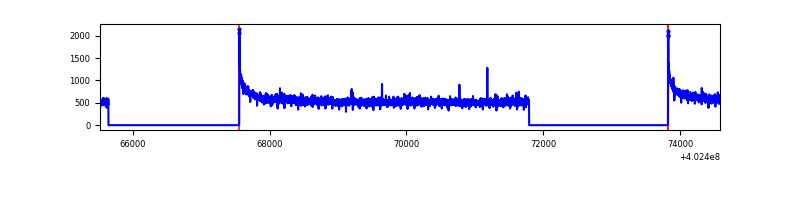 |
| B | 9064 | 5121 | 104 | 104 | 1.15% | 2.03% | 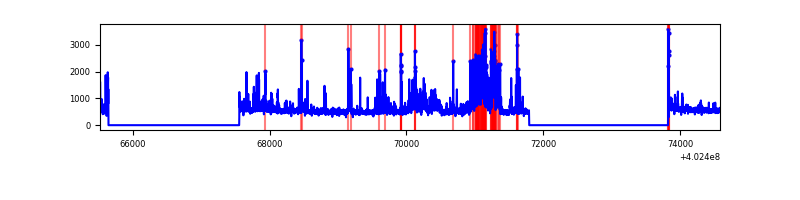 |
| C | 9064 | 5121 | 51 | 51 | 0.56% | 1.00% | 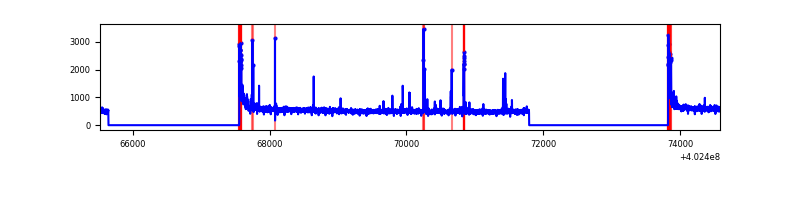 |
| D | 9064 | 5121 | 66 | 66 | 0.73% | 1.29% | 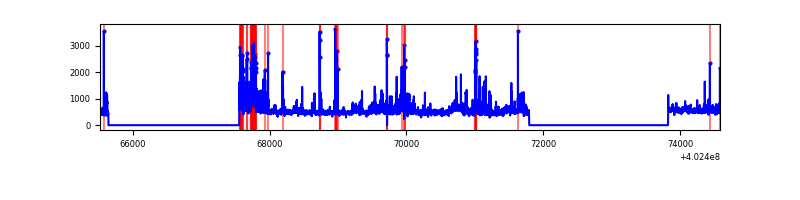 |
Top three noisy pixels from each quadrant. If the there are fewer than three noisy pixels in the level2.evt file, extra rows are filled as -1
| Pixel properties | Quadrant properties | ||||||
|---|---|---|---|---|---|---|---|
| Quadrant | DetID | PixID | Counts | Sigma | Mean | Median | Sigma |
| A | 10 | 83 | 361007 | 2789.04 | 642 | 631 | 129.2 |
| A | 12 | 189 | 15079 | 111.82 | 642 | 631 | 129.2 |
| A | 13 | 6 | 13387 | 98.72 | 642 | 631 | 129.2 |
| B | 5 | 172 | 347251 | 2915.31 | 630 | 616 | 118.9 |
| B | 12 | 18 | 295686 | 2481.63 | 630 | 616 | 118.9 |
| B | 0 | 229 | 180575 | 1513.51 | 630 | 616 | 118.9 |
| C | 15 | 214 | 218153 | 1507.98 | 624 | 630 | 144.2 |
| C | 0 | 10 | 167890 | 1159.53 | 624 | 630 | 144.2 |
| C | 15 | 159 | 39366 | 268.54 | 624 | 630 | 144.2 |
| D | 12 | 217 | 243867 | 1605.99 | 626 | 611 | 151.5 |
| D | 1 | 20 | 86065 | 564.17 | 626 | 611 | 151.5 |
| D | 2 | 250 | 74868 | 490.25 | 626 | 611 | 151.5 |
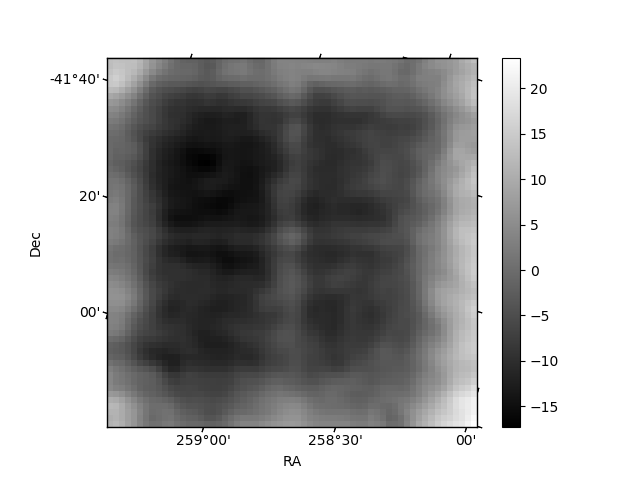
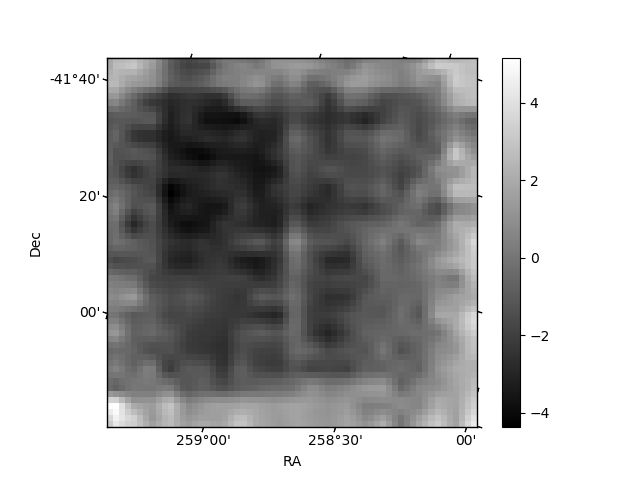
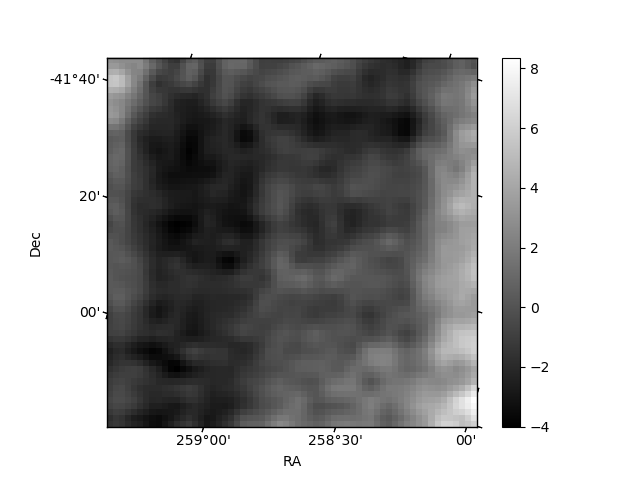
Histogram calculated using DETX and DETY for each event in the final _common_clean file
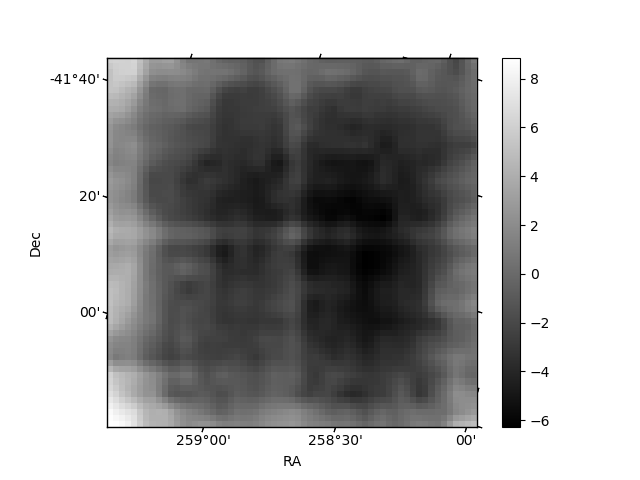
| Quadrant A | 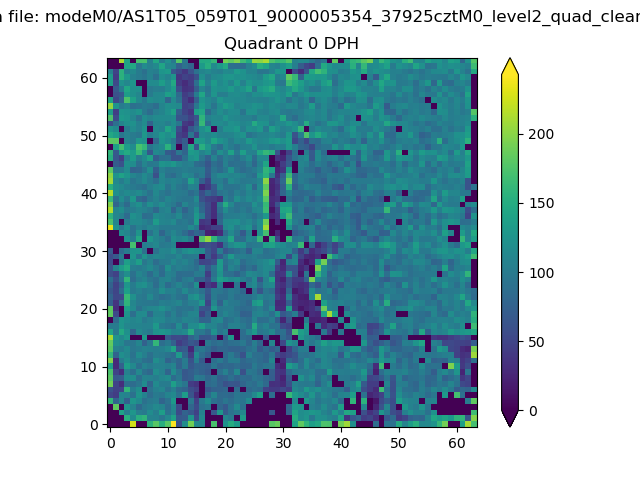 |
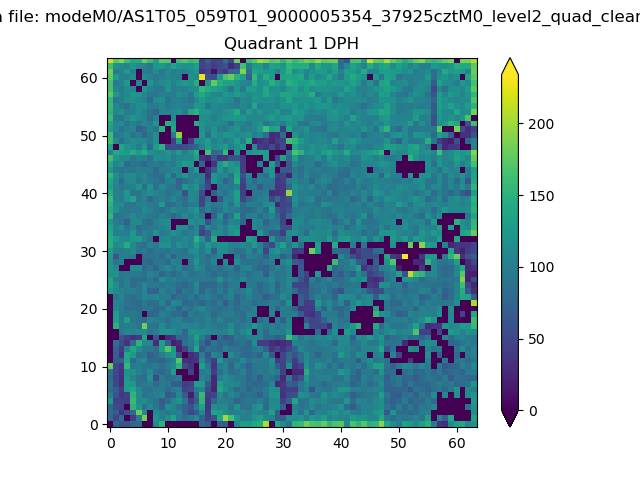 |
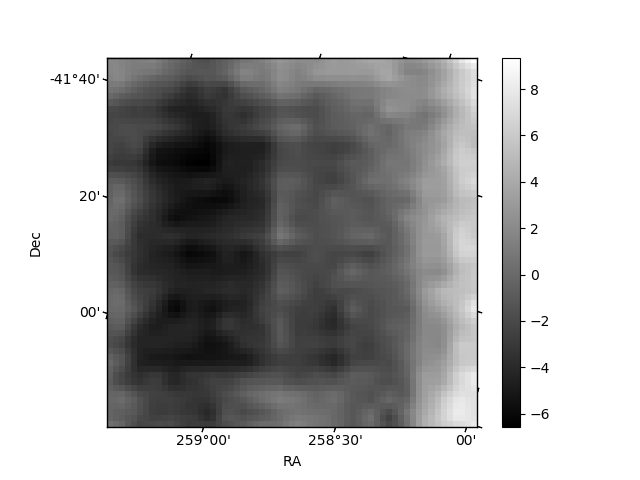
Quadrant B |
|---|---|---|---|
| Quadrant D | 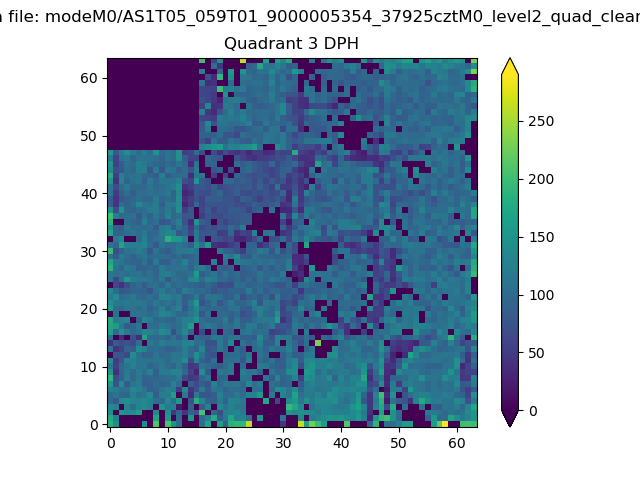 |
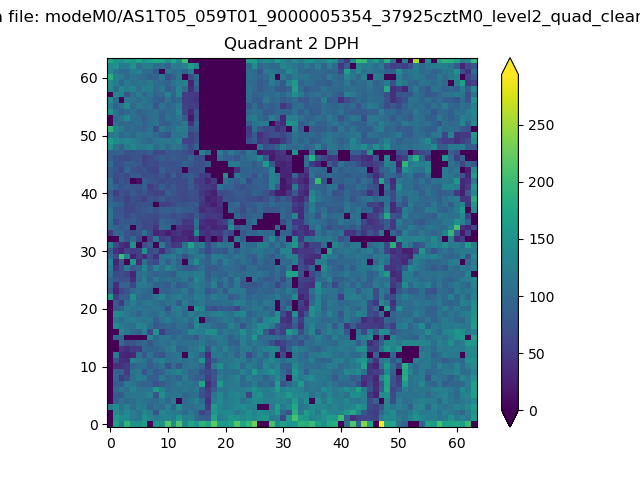 |
Quadrant C |
| Plot type | Count rate plots | Images |
|---|---|---|
| Comparison with Poisson distribution Blue bars denote a histogram of data divided into 1 sec bins. Red curve is a Poisson curve with rate = median count rate of data. |
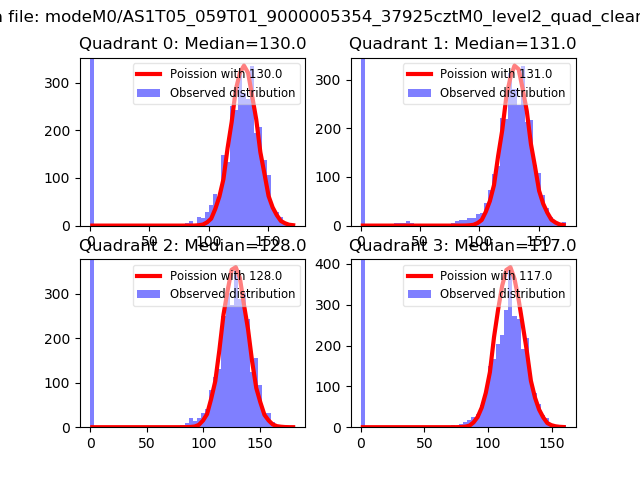 |
 |
| Quadrant-wise count rates Data is divided into 100 sec bins |
 |
|
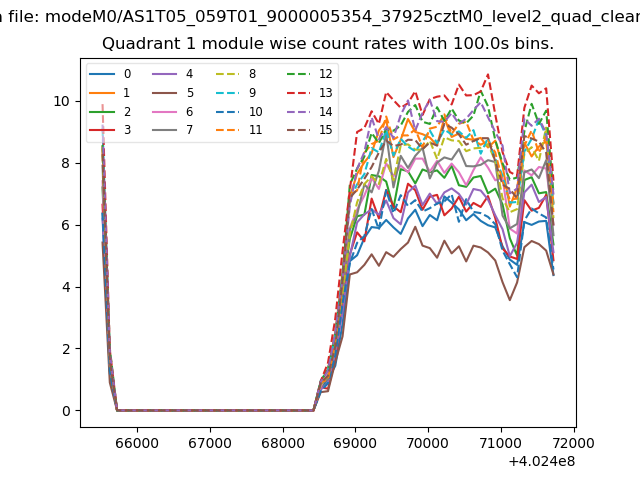
| Module-wise count rates for Quadrant A Data is divided into 100 sec bins |
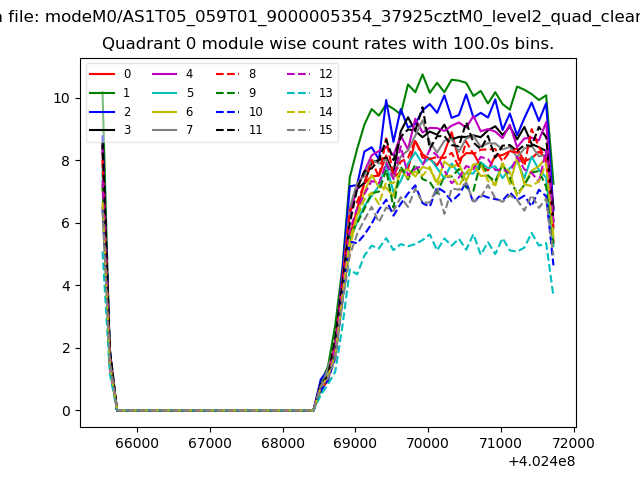 |
 |
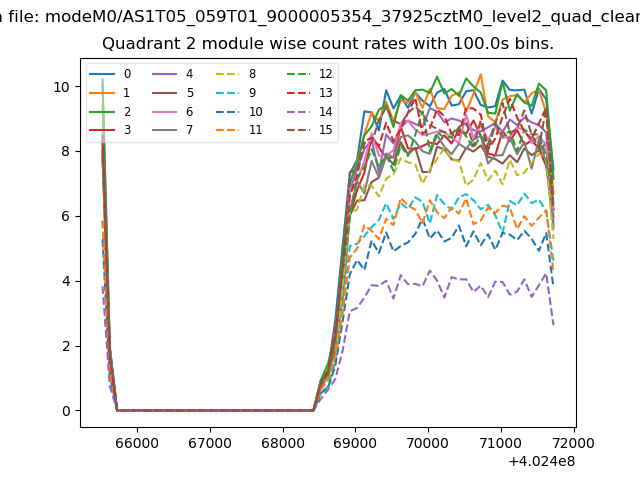
| Module-wise count rates for Quadrant B Data is divided into 100 sec bins |
 |
 |
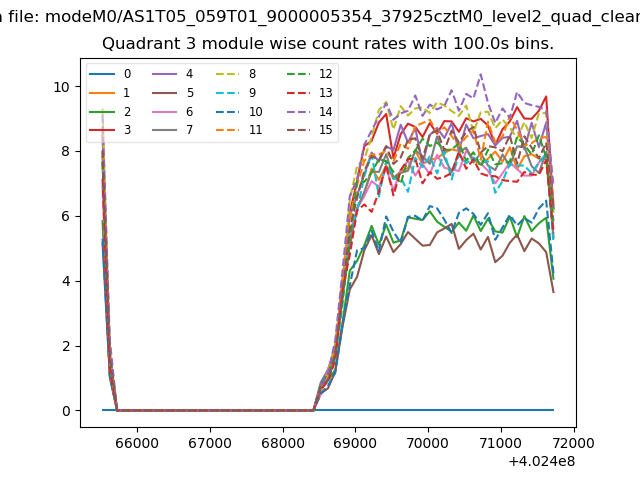
| Module-wise count rates for Quadrant C Data is divided into 100 sec bins |
 |
 |
| Module-wise count rates for Quadrant D Data is divided into 100 sec bins |
 |
 |
| Parameter | Plot |
|---|---|
| CZT HV Monitor | 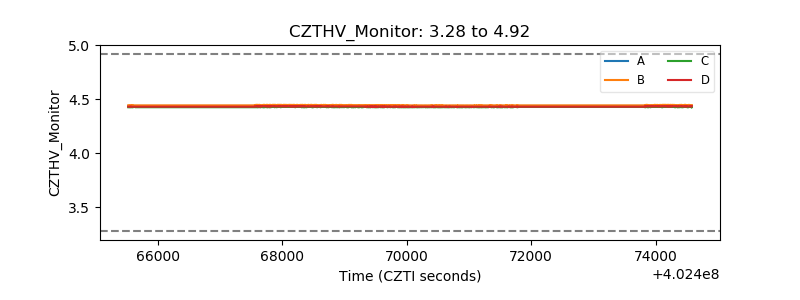 |
| D_VDD | 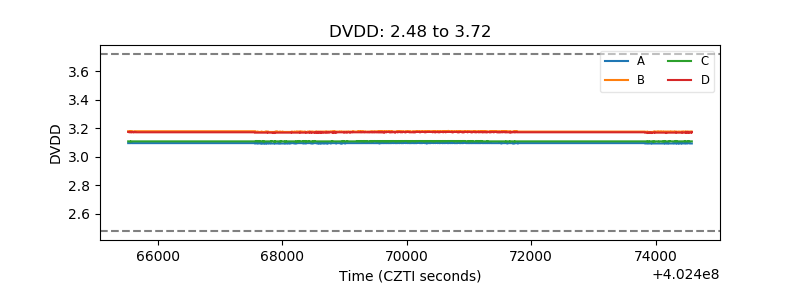 |
| Temperature 1 | 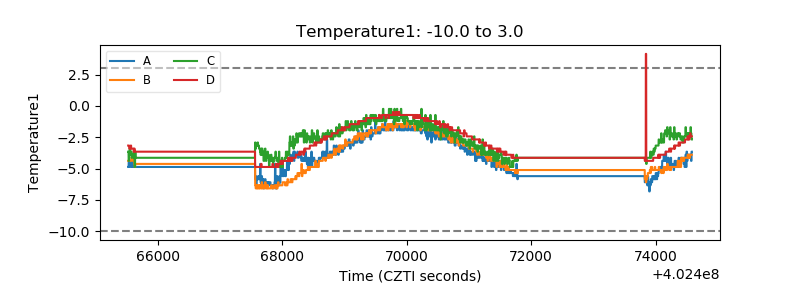 |
| Veto HV Monitor | 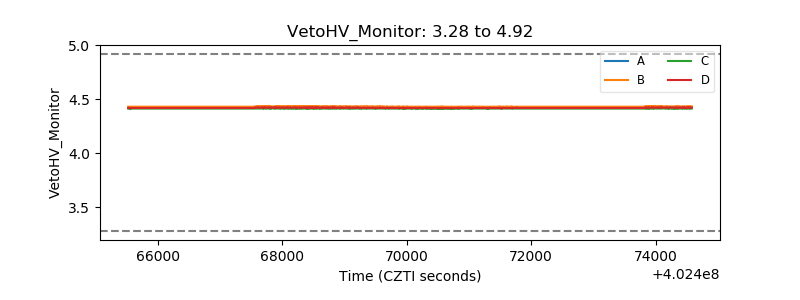 |
| Veto LLD | 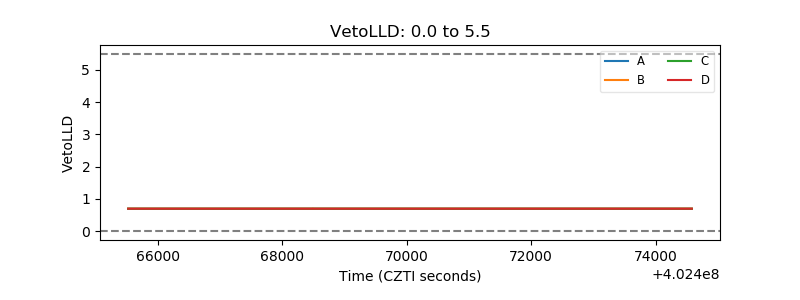 |
| Alpha Counter | 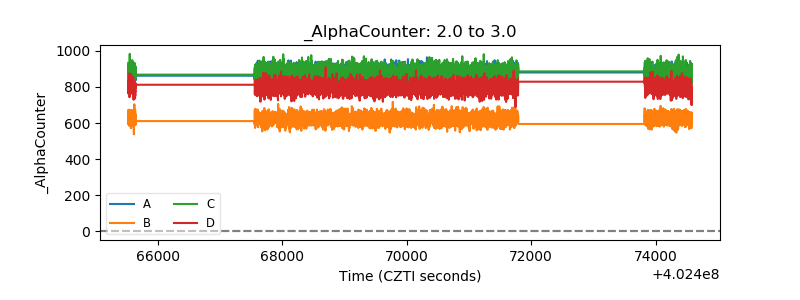 |
| _CPM_Rate | 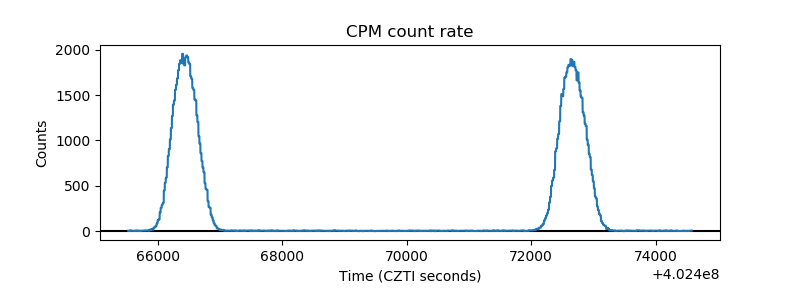 |
| CZT Counter | 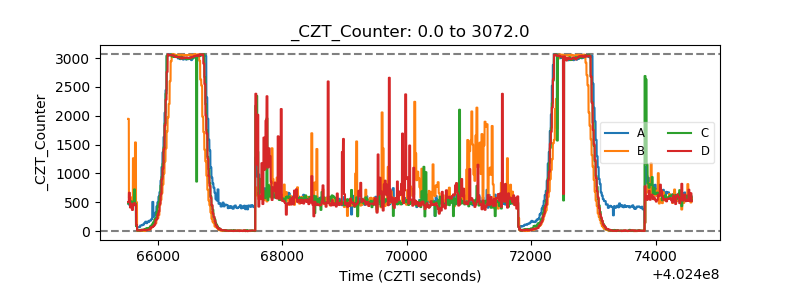 |
| +2.5 Volts monitor | 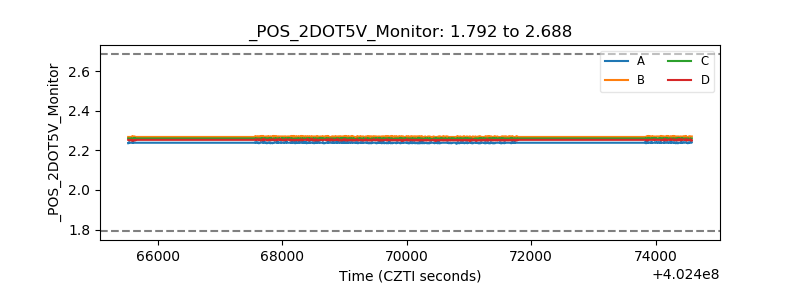 |
| +5 Volts monitor | 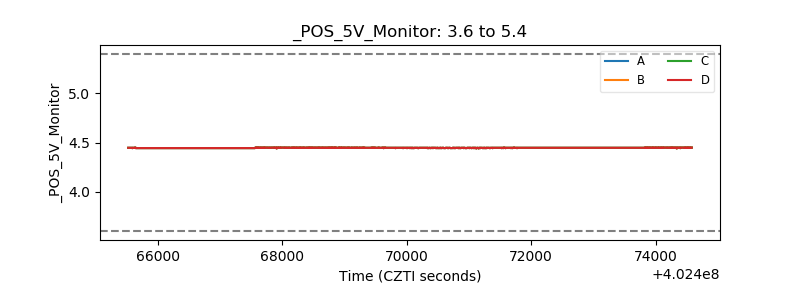 |
| _ROLL_ROT | 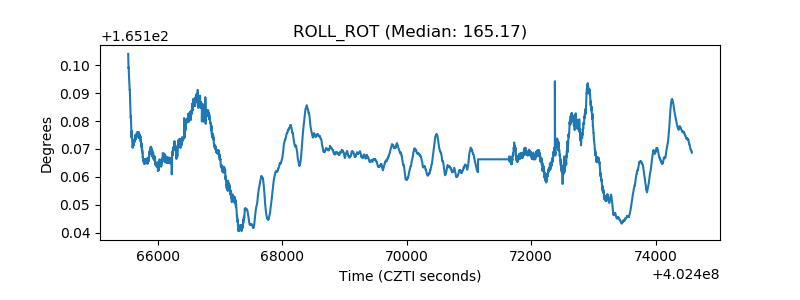 |
| _Roll_DEC | 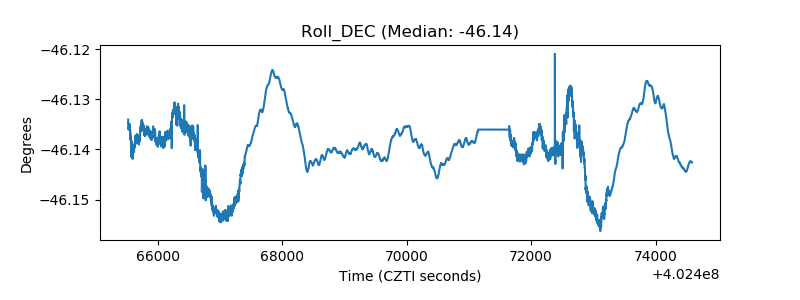 |
| _Roll_RA | 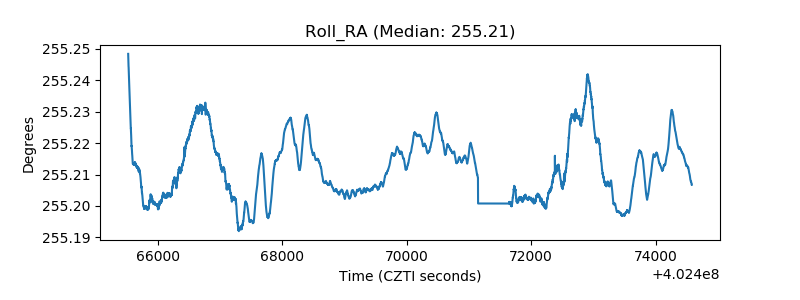 |
| Veto Counter | 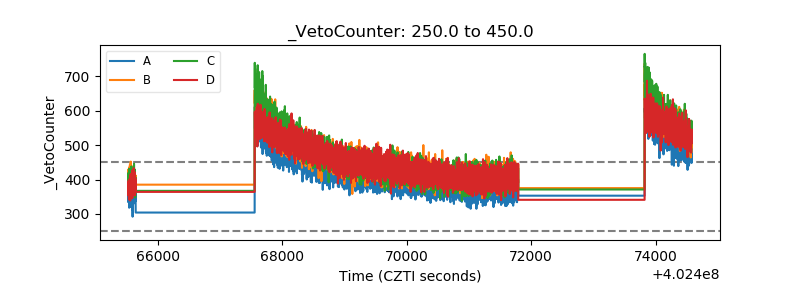 |