| Param | Original file | Final file |
|---|---|---|
| Filename | modeM0/AS1T05_059T01_9000005354_37926cztM0_level2.evt | modeM0/AS1T05_059T01_9000005354_37926cztM0_level2_quad_clean.evt |
| Size (bytes) | 416,635,200 | 55,431,360 |
| Size | 397.3 MB | 52.9 MB |
| Events in quadrant A | 2,918,605 | 343,360 |
| Events in quadrant B | 3,017,904 | 340,931 |
| Events in quadrant C | 2,827,838 | 336,124 |
| Events in quadrant D | 3,508,100 | 301,573 |
| Mode M0 | |||
|---|---|---|---|
| Quadrant | BADHDUFLAG | Total packets | Discarded packets |
| A | 0 | 11638 | 3 |
| B | 0 | 12008 | 2 |
| C | 0 | 11382 | 2 |
| D | 0 | 13656 | 2 |
| Mode SS | |||
|---|---|---|---|
| Quadrant | BADHDUFLAG | Total packets | Discarded packets |
| A | 0 | 104 | 0 |
| B | 0 | 104 | 0 |
| C | 0 | 104 | 0 |
| D | 0 | 104 | 0 |
| Mode M9 | |||
|---|---|---|---|
| Quadrant | BADHDUFLAG | Total packets | Discarded packets |
| A | 0 | 42 | 0 |
| B | 0 | 42 | 0 |
| C | 0 | 42 | 0 |
| D | 0 | 42 | 0 |
| Quadrant | Total seconds | Saturated seconds | Saturation percentage |
|---|---|---|---|
| A | 5089 | 13 | 0.255453% |
| B | 5089 | 73 | 1.434466% |
| C | 5089 | 44 | 0.864610% |
| D | 5089 | 219 | 4.303399% |
Noise dominated data is calculated using 1-second bins in cleaned event files. If a bin has >2000 counts, and if more than 50% of those come from <1% of pixels, then it is considered to be noise-dominated and hence unusable.
| Quadrant | # 1 sec bins | Bins with >0 counts | Bins with >2000 counts | High rate bins dominated by noise | Noise dominated (total time) | Noise dominated (detector-on time) | Marked lightcurve |
|---|---|---|---|---|---|---|---|
| A | 9245 | 5091 | 4 | 4 | 0.04% | 0.08% | 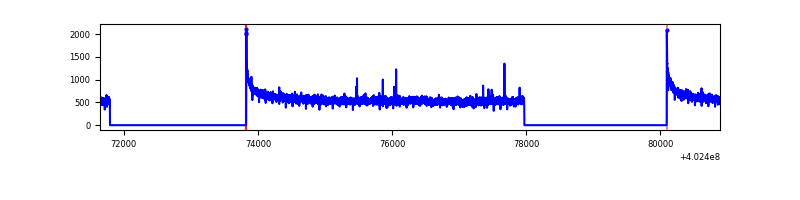 |
| B | 9245 | 5091 | 51 | 51 | 0.55% | 1.00% | 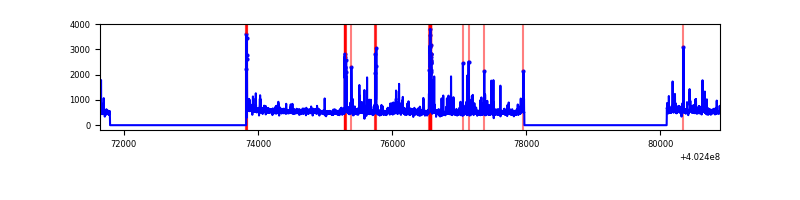 |
| C | 9245 | 5091 | 30 | 30 | 0.32% | 0.59% | 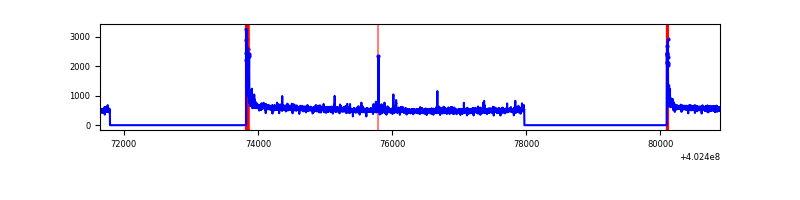 |
| D | 9245 | 5091 | 189 | 189 | 2.04% | 3.71% | 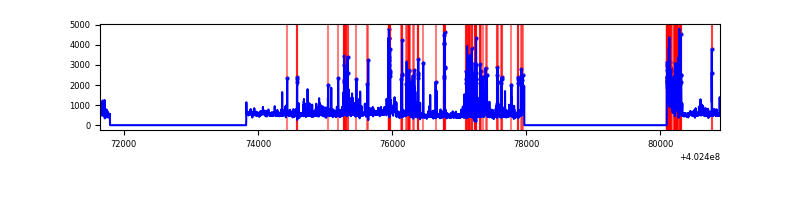 |
Top three noisy pixels from each quadrant. If the there are fewer than three noisy pixels in the level2.evt file, extra rows are filled as -1
| Pixel properties | Quadrant properties | ||||||
|---|---|---|---|---|---|---|---|
| Quadrant | DetID | PixID | Counts | Sigma | Mean | Median | Sigma |
| A | 10 | 83 | 357048 | 2772.66 | 647 | 637 | 128.5 |
| A | 12 | 189 | 27001 | 205.1 | 647 | 637 | 128.5 |
| A | 13 | 6 | 21452 | 161.93 | 647 | 637 | 128.5 |
| B | 5 | 172 | 225754 | 1856.88 | 634 | 618 | 121.2 |
| B | 0 | 229 | 159433 | 1309.88 | 634 | 618 | 121.2 |
| B | 4 | 81 | 49756 | 405.28 | 634 | 618 | 121.2 |
| C | 15 | 214 | 217735 | 1504.75 | 625 | 631 | 144.3 |
| C | 0 | 10 | 136134 | 939.17 | 625 | 631 | 144.3 |
| C | 14 | 254 | 24082 | 162.54 | 625 | 631 | 144.3 |
| D | 12 | 227 | 385847 | 2584.75 | 619 | 604 | 149.0 |
| D | 10 | 199 | 169880 | 1135.74 | 619 | 604 | 149.0 |
| D | 12 | 233 | 100430 | 669.77 | 619 | 604 | 149.0 |
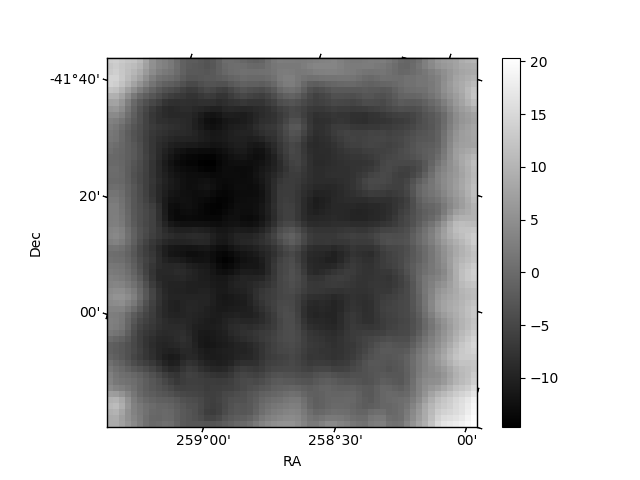
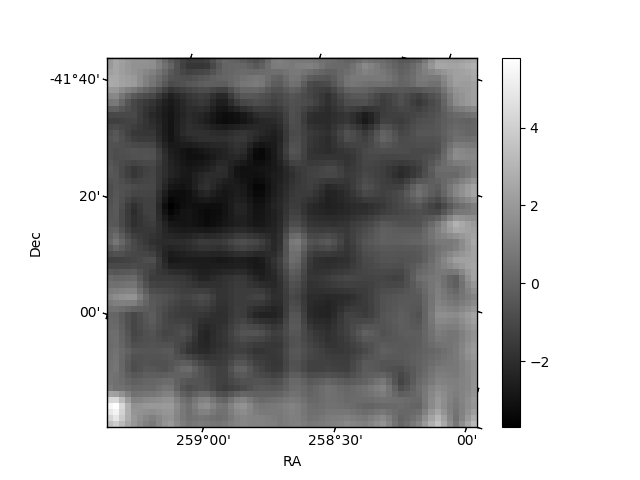
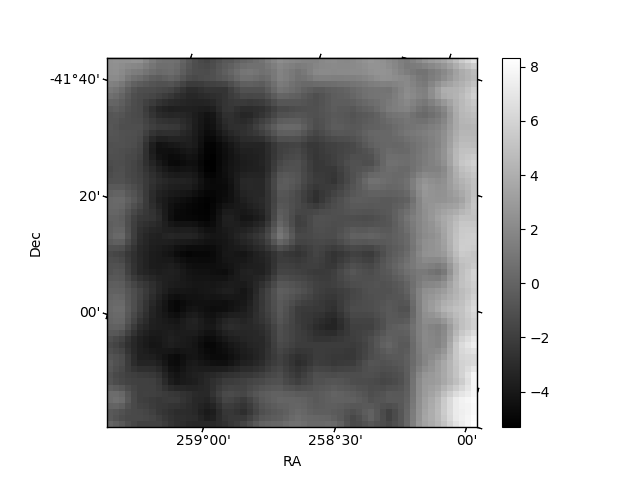
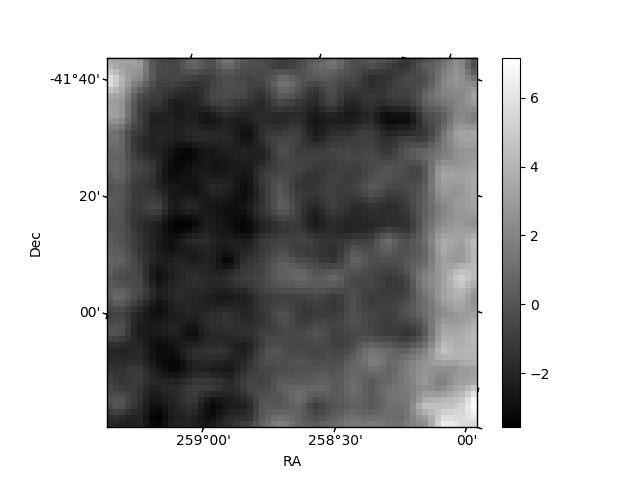
Histogram calculated using DETX and DETY for each event in the final _common_clean file
| Quadrant A | 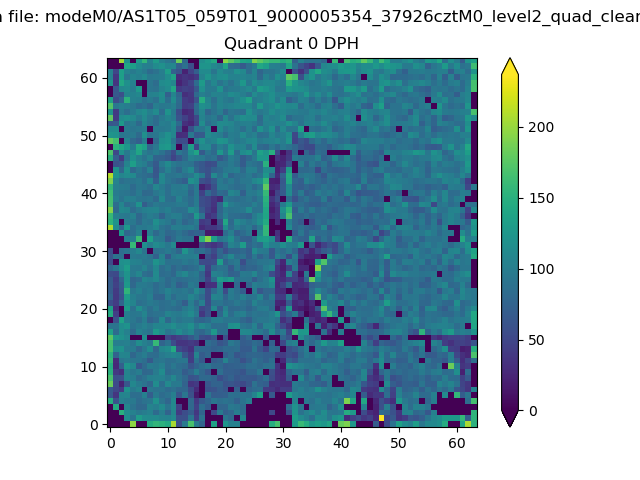 |
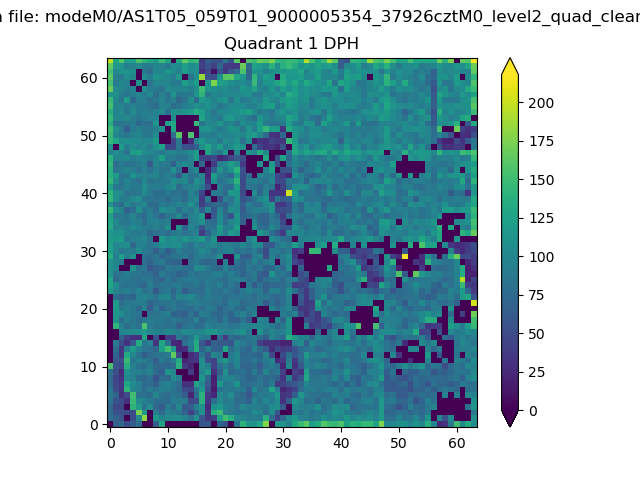 |
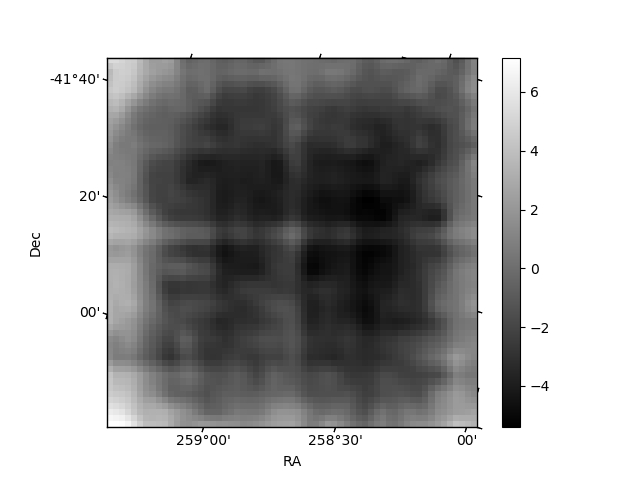
Quadrant B |
|---|---|---|---|
| Quadrant D | 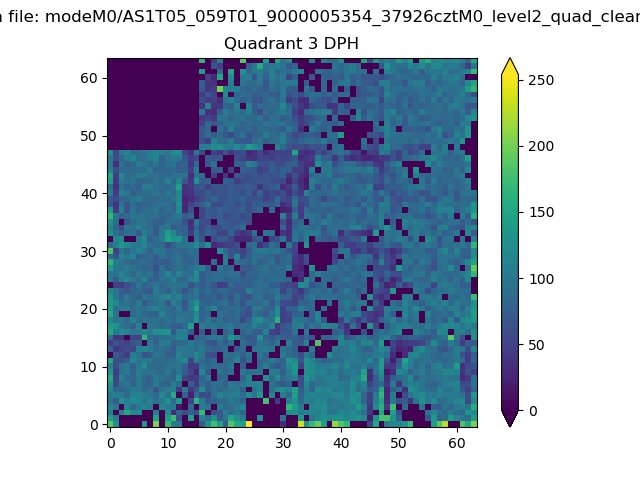 |
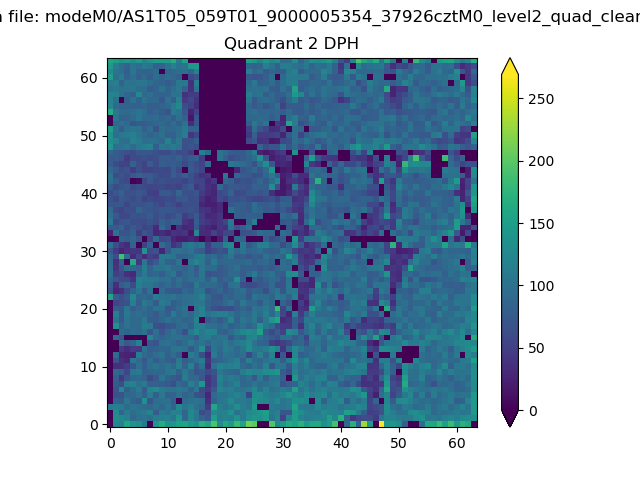 |
Quadrant C |
| Plot type | Count rate plots | Images |
|---|---|---|
| Comparison with Poisson distribution Blue bars denote a histogram of data divided into 1 sec bins. Red curve is a Poisson curve with rate = median count rate of data. |
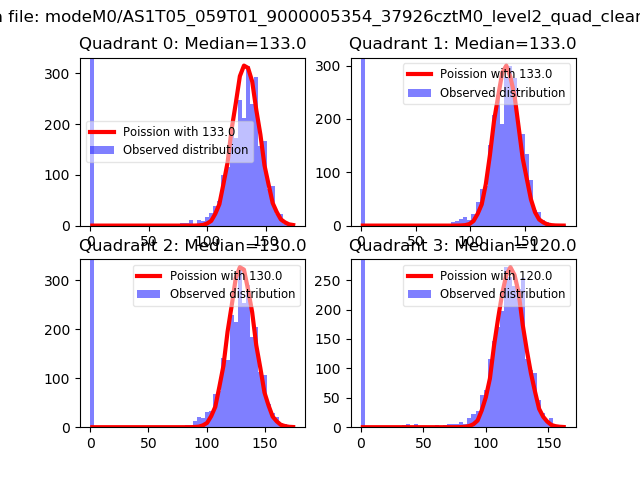 |
 |
| Quadrant-wise count rates Data is divided into 100 sec bins |
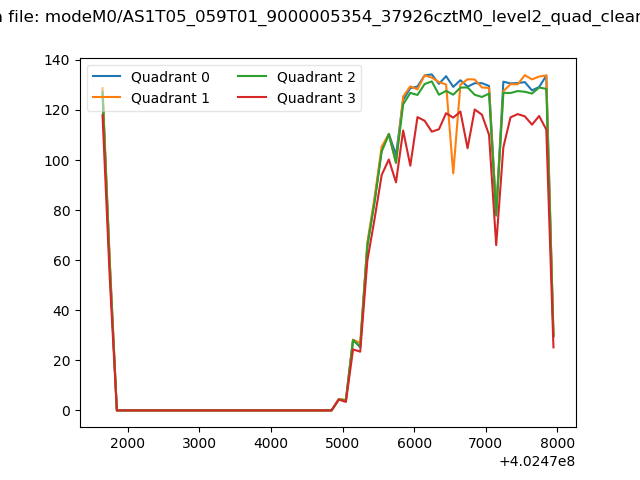 |
|
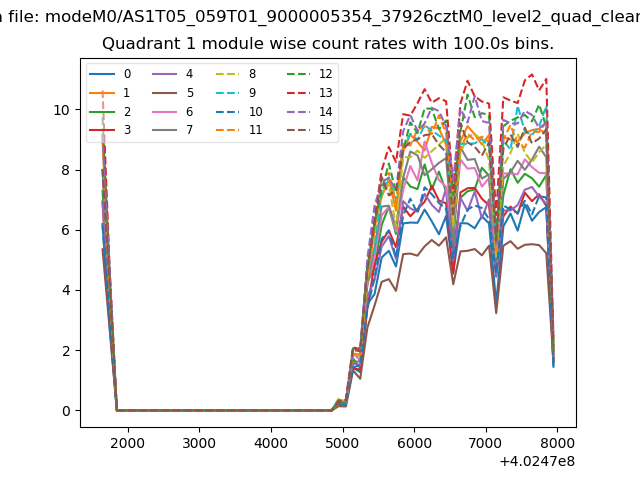
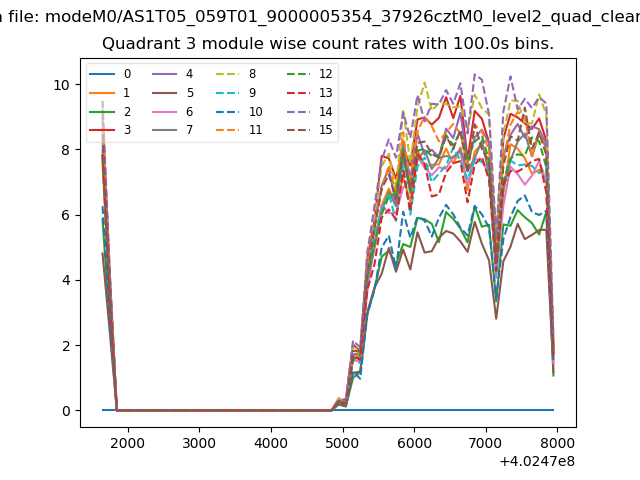
| Module-wise count rates for Quadrant A Data is divided into 100 sec bins |
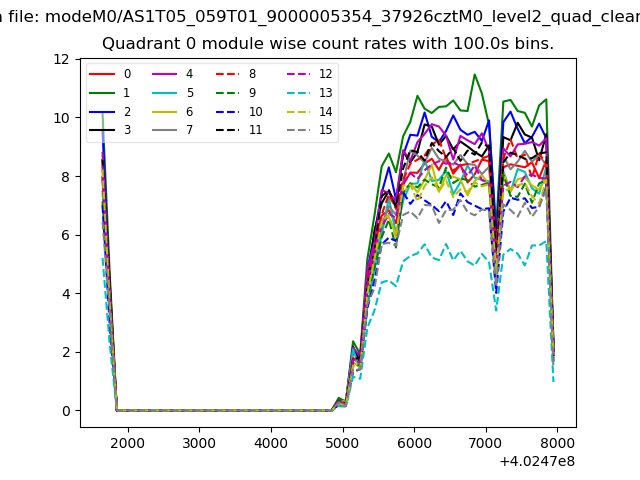 |
 |
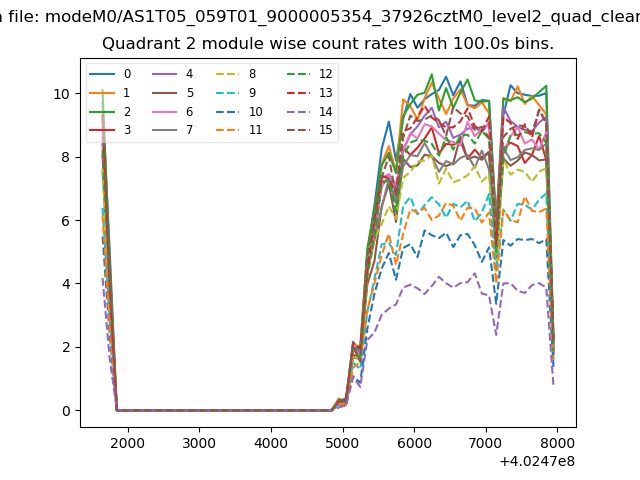
| Module-wise count rates for Quadrant B Data is divided into 100 sec bins |
 |
 |
| Module-wise count rates for Quadrant C Data is divided into 100 sec bins |
 |
 |
| Module-wise count rates for Quadrant D Data is divided into 100 sec bins |
 |
 |
| Parameter | Plot |
|---|---|
| CZT HV Monitor | 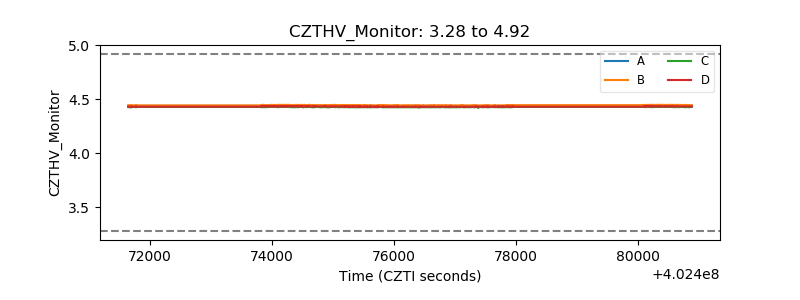 |
| D_VDD | 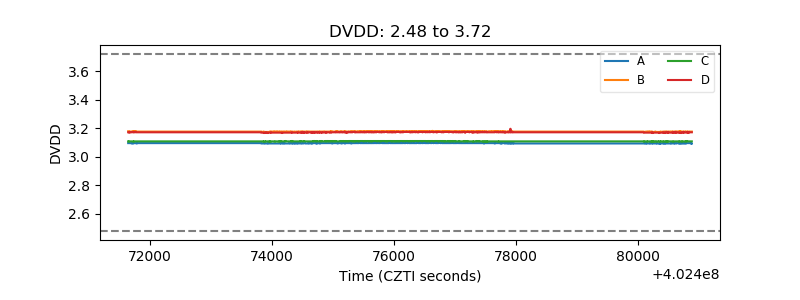 |
| Temperature 1 | 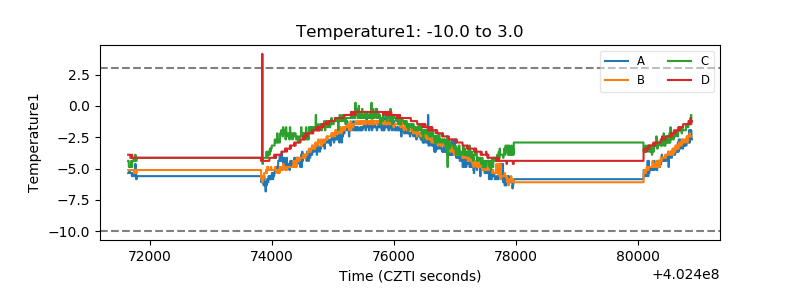 |
| Veto HV Monitor | 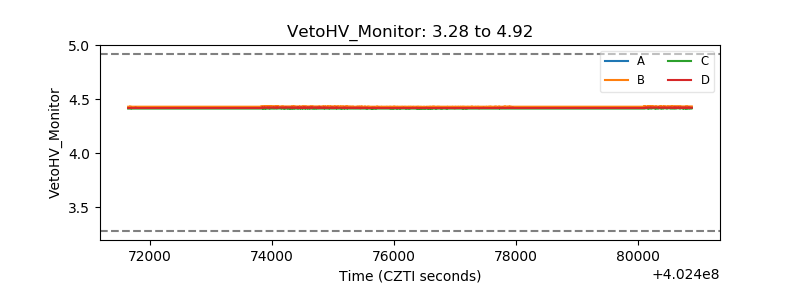 |
| Veto LLD | 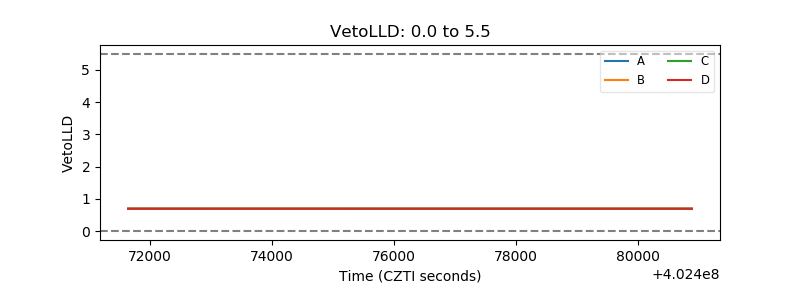 |
| Alpha Counter | 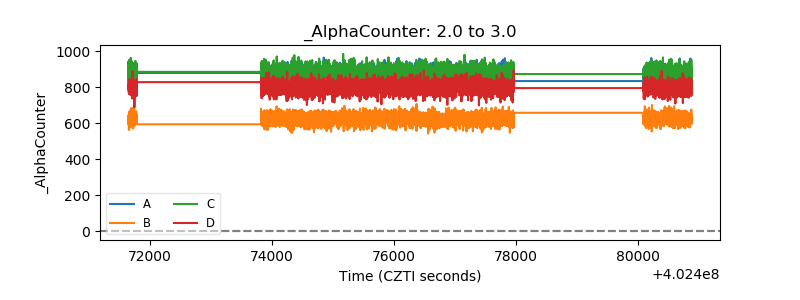 |
| _CPM_Rate | 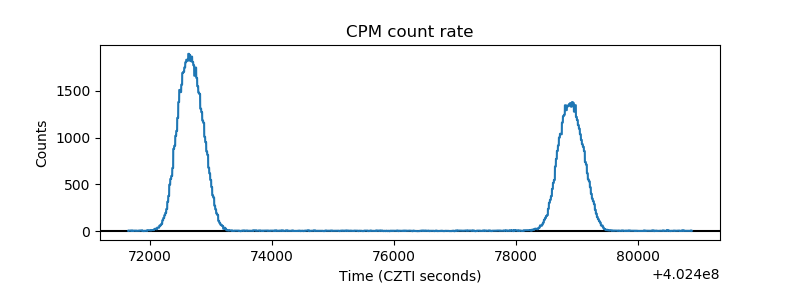 |
| CZT Counter | 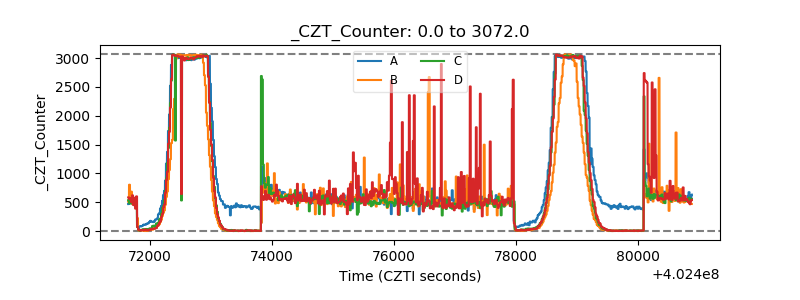 |
| +2.5 Volts monitor | 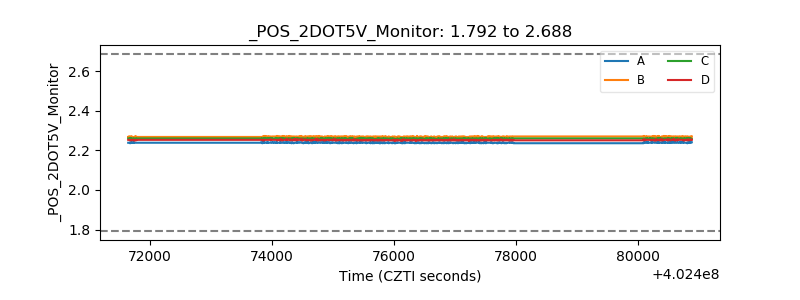 |
| +5 Volts monitor | 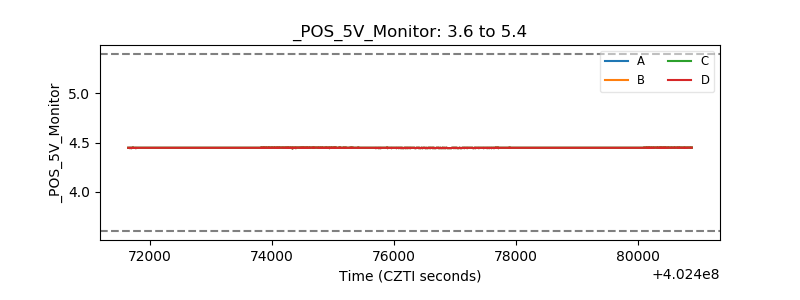 |
| _ROLL_ROT | 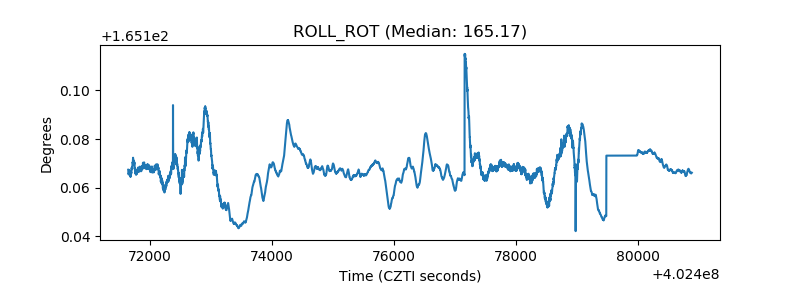 |
| _Roll_DEC | 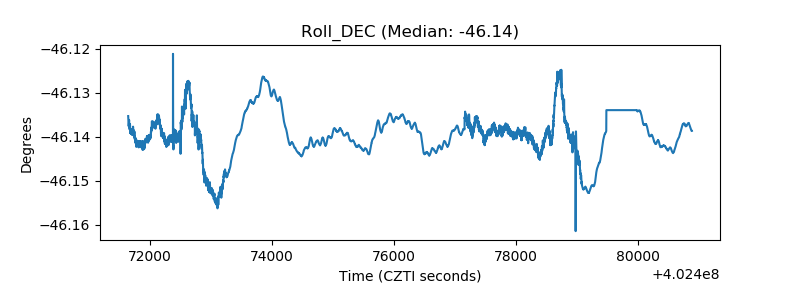 |
| _Roll_RA | 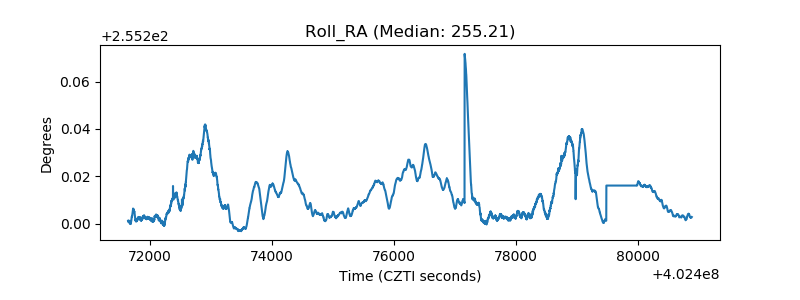 |
| Veto Counter | 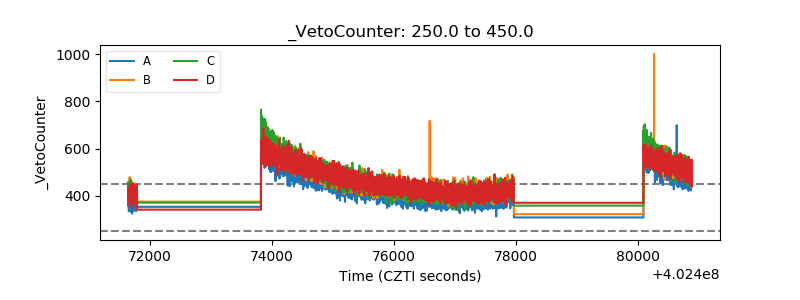 |