| Param | Original file | Final file |
|---|---|---|
| Filename | modeM0/AS1T05_059T01_9000005354_37927cztM0_level2.evt | modeM0/AS1T05_059T01_9000005354_37927cztM0_level2_quad_clean.evt |
| Size (bytes) | 436,521,600 | 53,009,280 |
| Size | 416.3 MB | 50.6 MB |
| Events in quadrant A | 2,797,699 | 334,357 |
| Events in quadrant B | 3,088,231 | 327,269 |
| Events in quadrant C | 2,577,951 | 327,697 |
| Events in quadrant D | 4,423,630 | 272,004 |
| Mode M0 | |||
|---|---|---|---|
| Quadrant | BADHDUFLAG | Total packets | Discarded packets |
| A | 0 | 11221 | 3 |
| B | 0 | 12202 | 2 |
| C | 0 | 10501 | 2 |
| D | 0 | 16337 | 2 |
| Mode SS | |||
|---|---|---|---|
| Quadrant | BADHDUFLAG | Total packets | Discarded packets |
| A | 0 | 100 | 0 |
| B | 0 | 100 | 0 |
| C | 0 | 100 | 0 |
| D | 0 | 100 | 0 |
| Mode M9 | |||
|---|---|---|---|
| Quadrant | BADHDUFLAG | Total packets | Discarded packets |
| A | 0 | 22 | 0 |
| B | 0 | 22 | 0 |
| C | 0 | 22 | 0 |
| D | 0 | 23 | 0 |
| Quadrant | Total seconds | Saturated seconds | Saturation percentage |
|---|---|---|---|
| A | 4899 | 25 | 0.510308% |
| B | 4899 | 118 | 2.408655% |
| C | 4899 | 27 | 0.551133% |
| D | 4899 | 513 | 10.471525% |
Noise dominated data is calculated using 1-second bins in cleaned event files. If a bin has >2000 counts, and if more than 50% of those come from <1% of pixels, then it is considered to be noise-dominated and hence unusable.
| Quadrant | # 1 sec bins | Bins with >0 counts | Bins with >2000 counts | High rate bins dominated by noise | Noise dominated (total time) | Noise dominated (detector-on time) | Marked lightcurve |
|---|---|---|---|---|---|---|---|
| A | 7052 | 4900 | 16 | 16 | 0.23% | 0.33% | 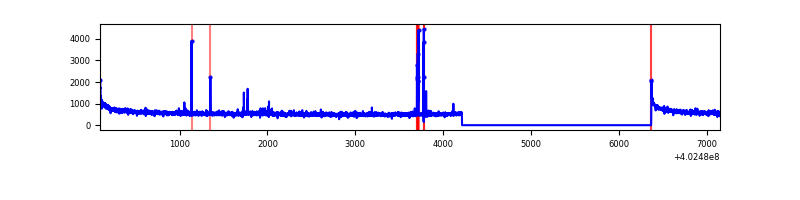 |
| B | 7052 | 4900 | 80 | 80 | 1.13% | 1.63% | 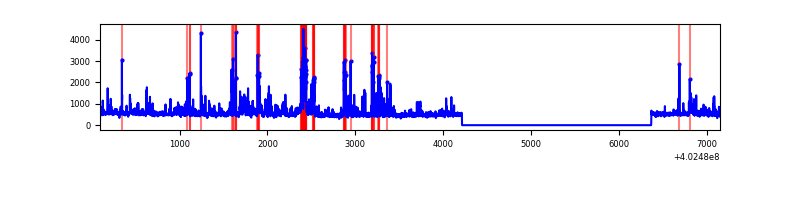 |
| C | 7052 | 4900 | 16 | 16 | 0.23% | 0.33% | 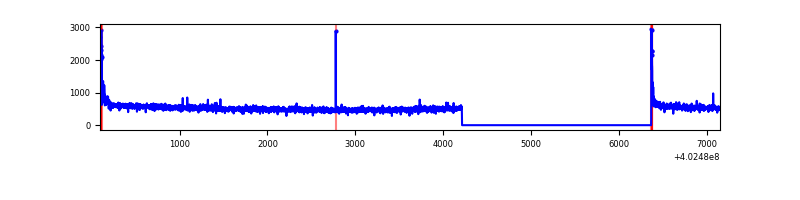 |
| D | 7052 | 4900 | 481 | 481 | 6.82% | 9.82% | 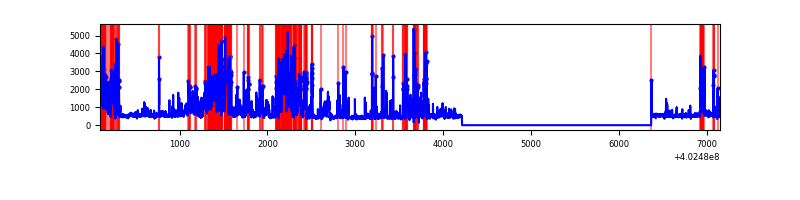 |
Top three noisy pixels from each quadrant. If the there are fewer than three noisy pixels in the level2.evt file, extra rows are filled as -1
| Pixel properties | Quadrant properties | ||||||
|---|---|---|---|---|---|---|---|
| Quadrant | DetID | PixID | Counts | Sigma | Mean | Median | Sigma |
| A | 10 | 83 | 347630 | 2868.52 | 604 | 595 | 121.0 |
| A | 15 | 174 | 43133 | 351.61 | 604 | 595 | 121.0 |
| A | 13 | 248 | 25760 | 208.01 | 604 | 595 | 121.0 |
| B | 5 | 172 | 412291 | 3676.17 | 589 | 575 | 112.0 |
| B | 0 | 229 | 246754 | 2198.11 | 589 | 575 | 112.0 |
| B | 0 | 230 | 49688 | 438.53 | 589 | 575 | 112.0 |
| C | 15 | 214 | 208447 | 1560.1 | 580 | 587 | 133.2 |
| C | 0 | 10 | 81539 | 607.59 | 580 | 587 | 133.2 |
| C | 14 | 254 | 12904 | 92.45 | 580 | 587 | 133.2 |
| D | 12 | 227 | 946200 | 6903.91 | 562 | 547 | 137.0 |
| D | 10 | 253 | 375703 | 2738.89 | 562 | 547 | 137.0 |
| D | 12 | 217 | 202293 | 1472.88 | 562 | 547 | 137.0 |
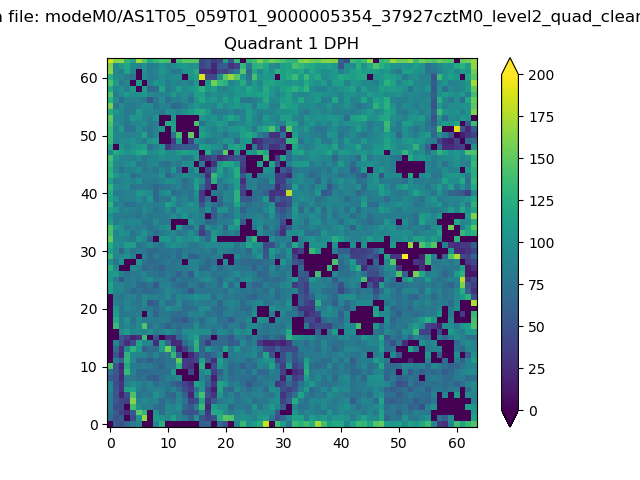
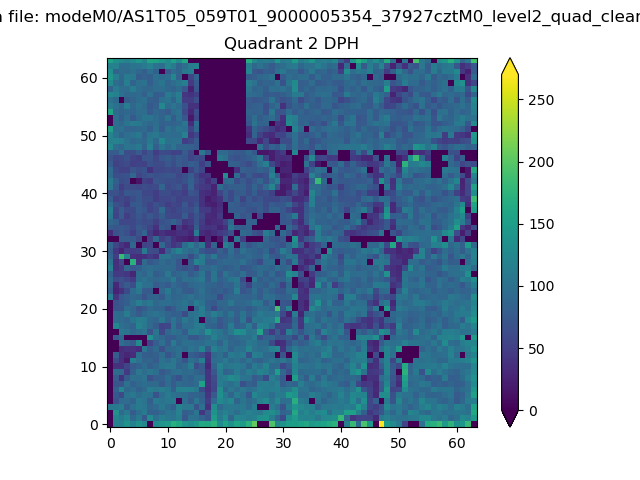
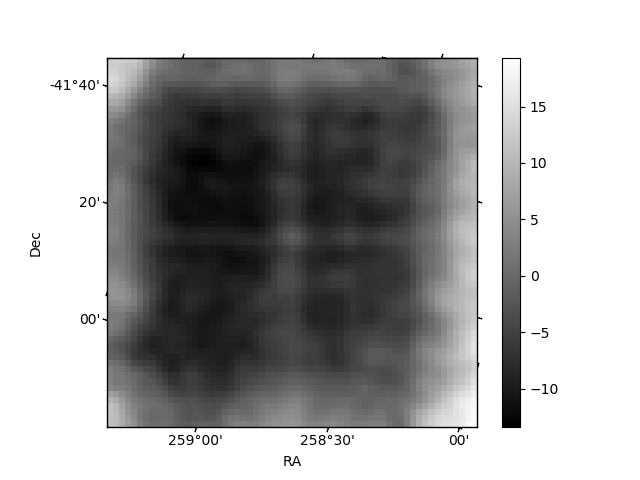
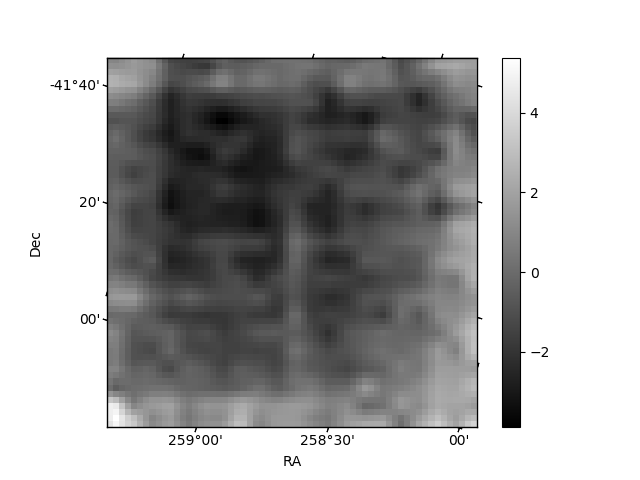
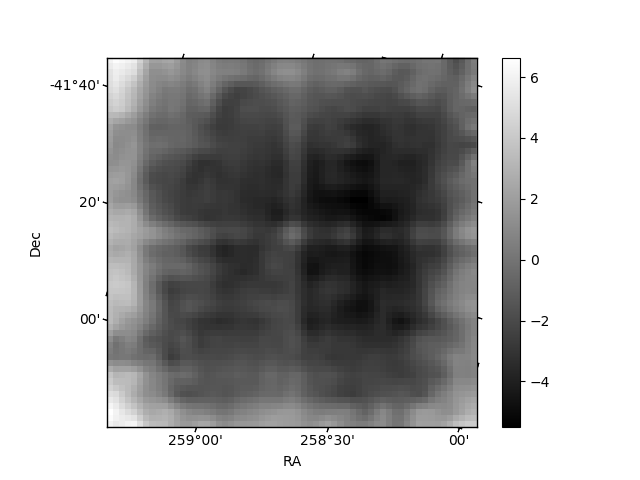
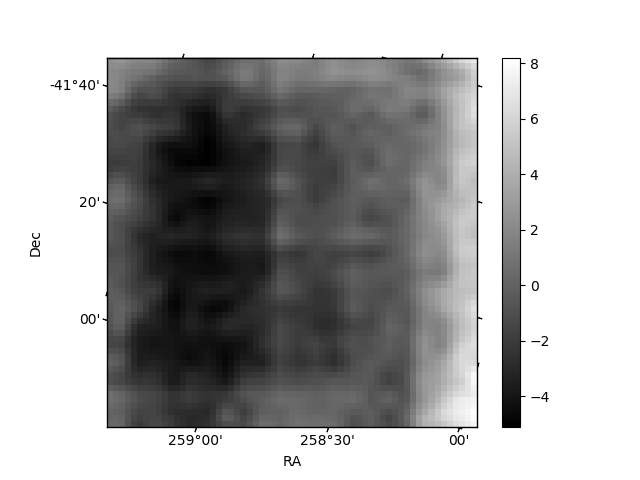
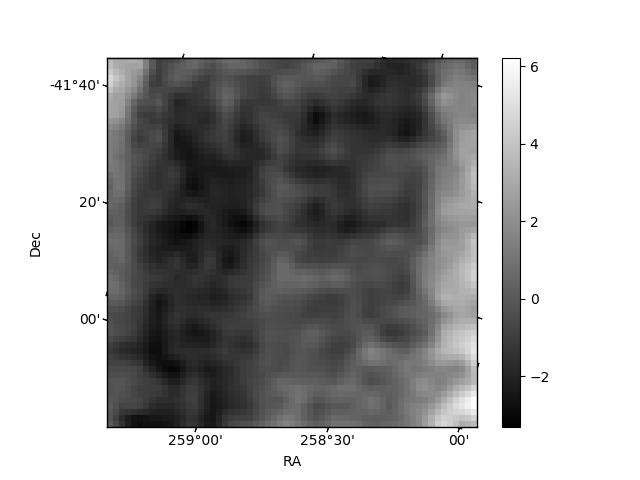
Histogram calculated using DETX and DETY for each event in the final _common_clean file
| Quadrant A |  |
 |
Quadrant B |
|---|---|---|---|
| Quadrant D | 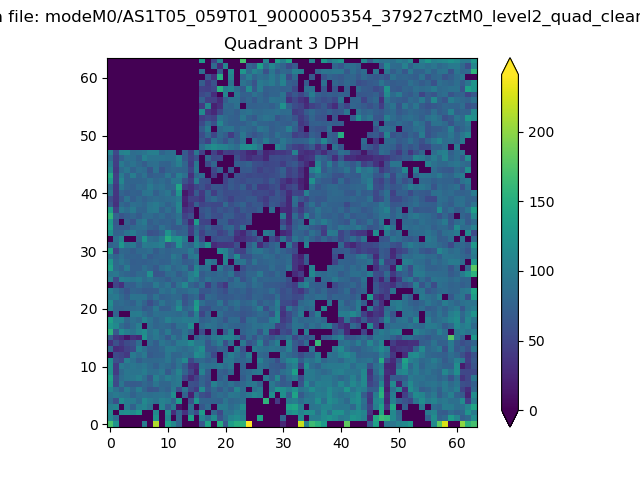 |
 |
Quadrant C |
| Plot type | Count rate plots | Images |
|---|---|---|
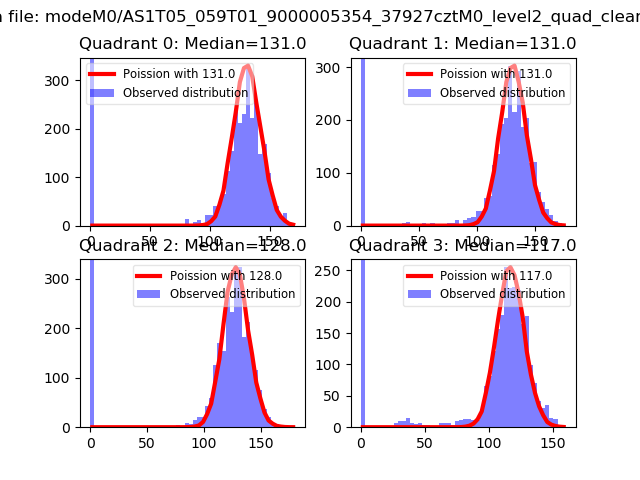
| Comparison with Poisson distribution Blue bars denote a histogram of data divided into 1 sec bins. Red curve is a Poisson curve with rate = median count rate of data. |
 |
 |
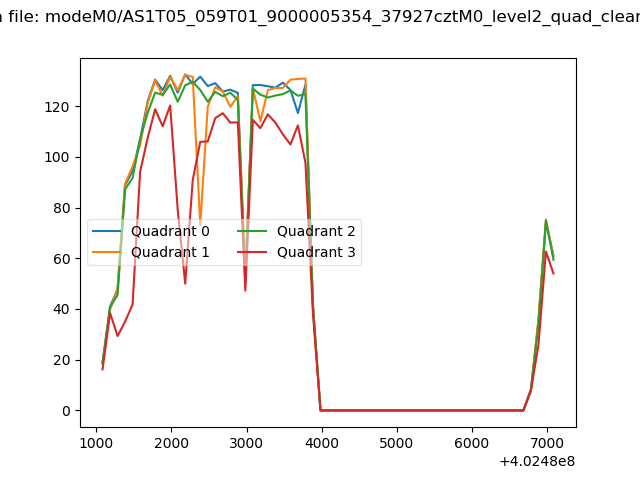
| Quadrant-wise count rates Data is divided into 100 sec bins |
 |
|
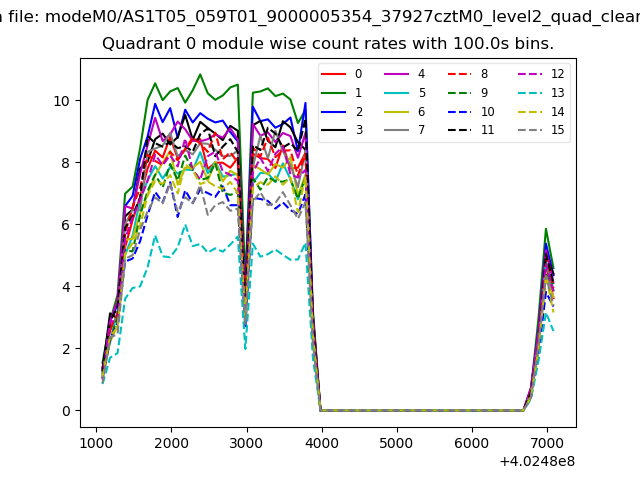
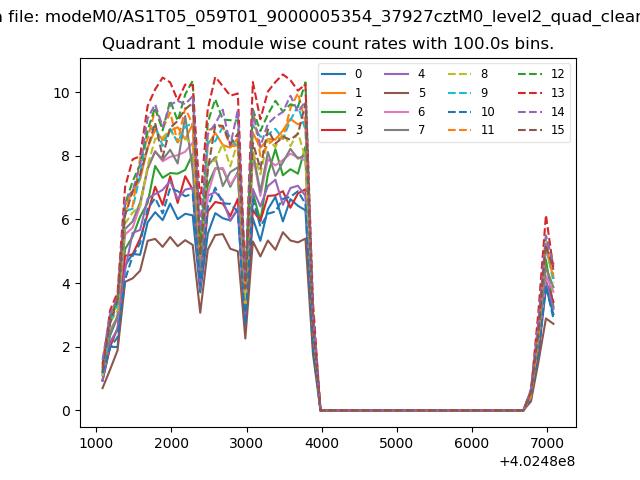
| Module-wise count rates for Quadrant A Data is divided into 100 sec bins |
 |
 |
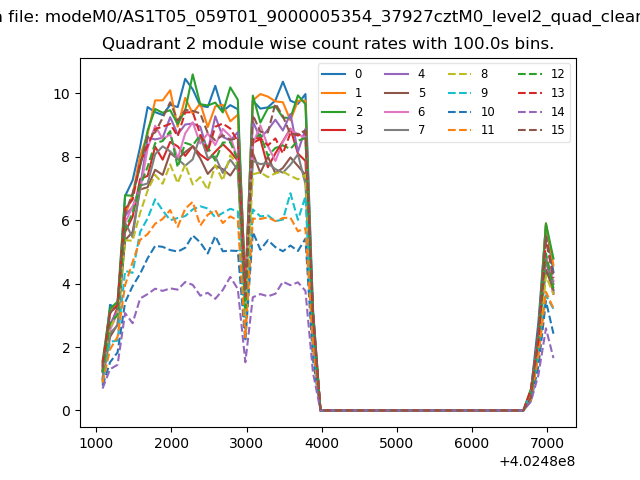
| Module-wise count rates for Quadrant B Data is divided into 100 sec bins |
 |
 |
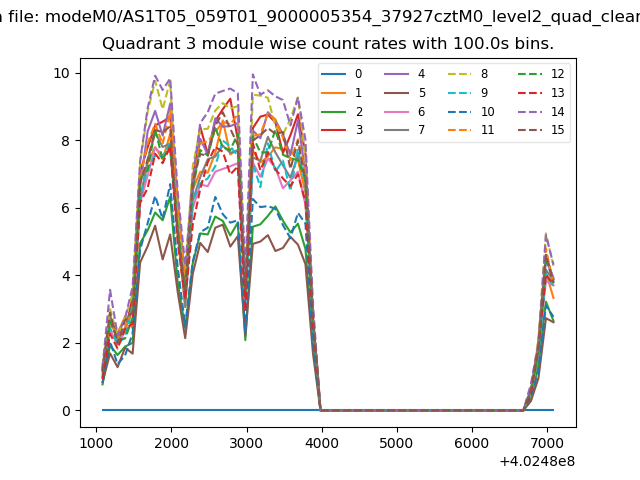
| Module-wise count rates for Quadrant C Data is divided into 100 sec bins |
 |
 |
| Module-wise count rates for Quadrant D Data is divided into 100 sec bins |
 |
 |
| Parameter | Plot |
|---|---|
| CZT HV Monitor |  |
| D_VDD | 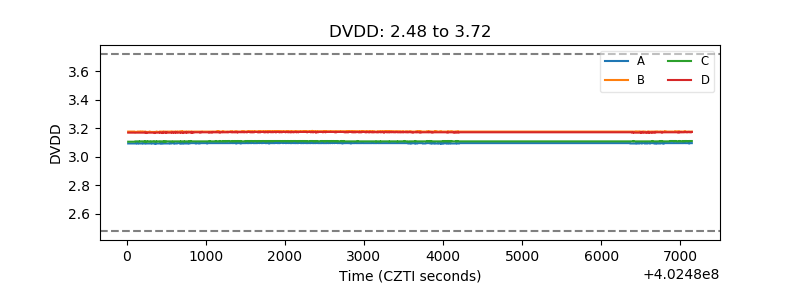 |
| Temperature 1 | 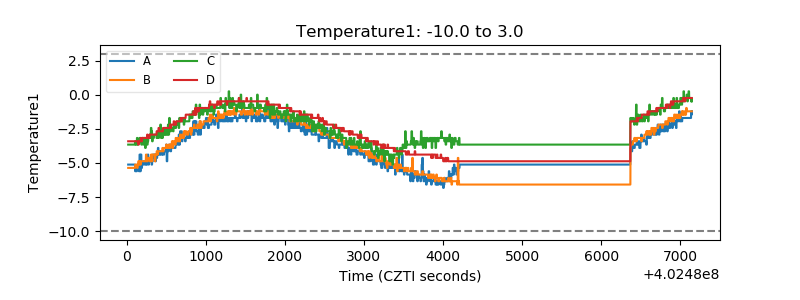 |
| Veto HV Monitor | 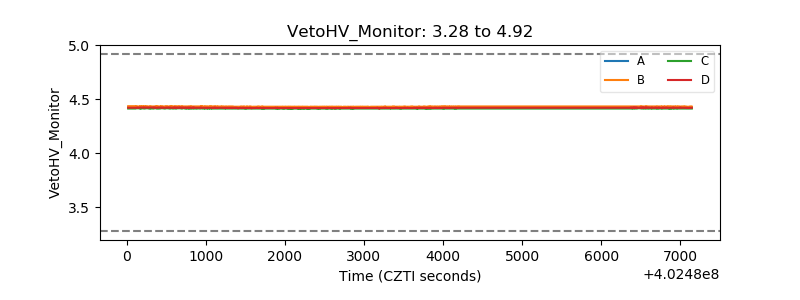 |
| Veto LLD | 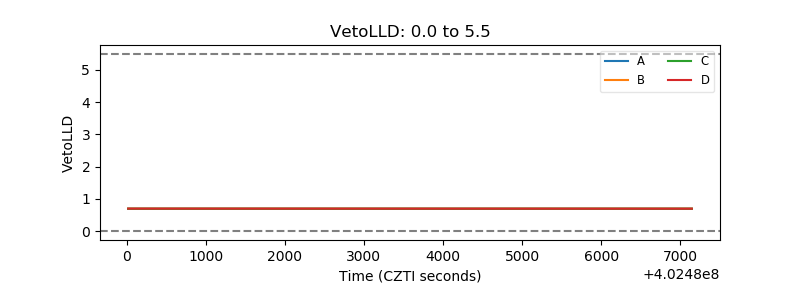 |
| Alpha Counter | 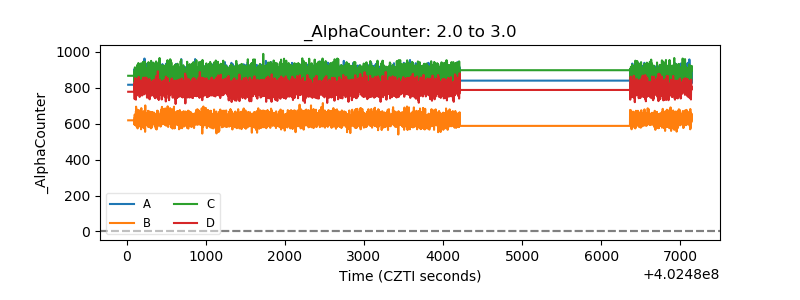 |
| _CPM_Rate | 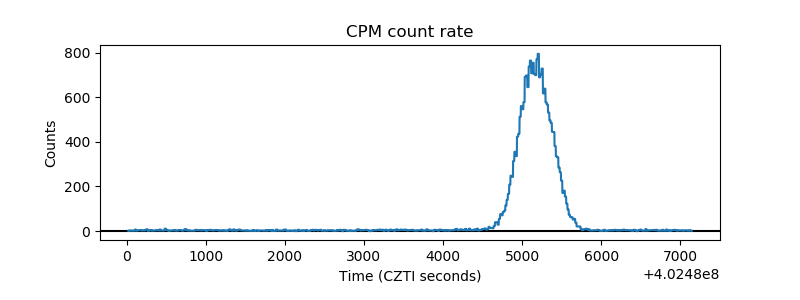 |
| CZT Counter | 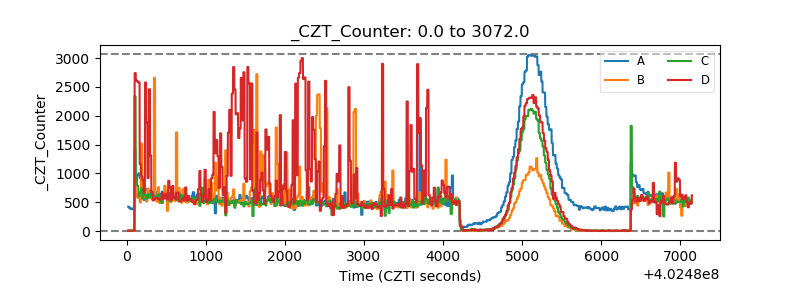 |
| +2.5 Volts monitor |  |
| +5 Volts monitor | 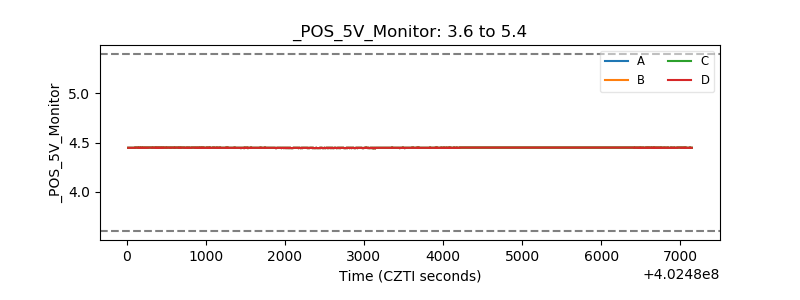 |
| _ROLL_ROT | 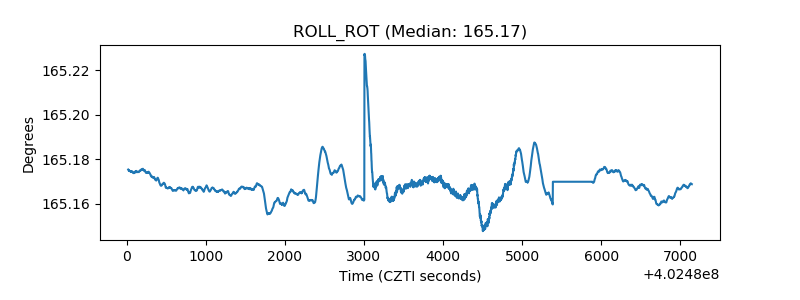 |
| _Roll_DEC | 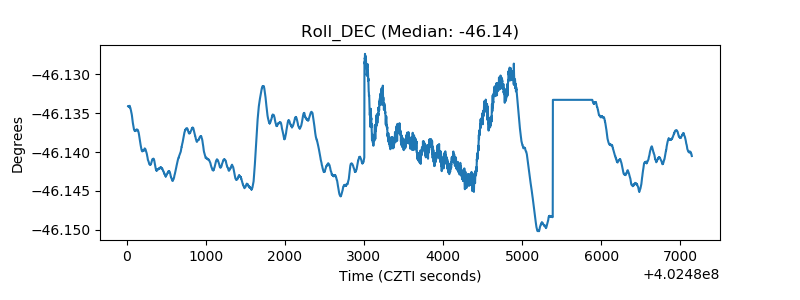 |
| _Roll_RA | 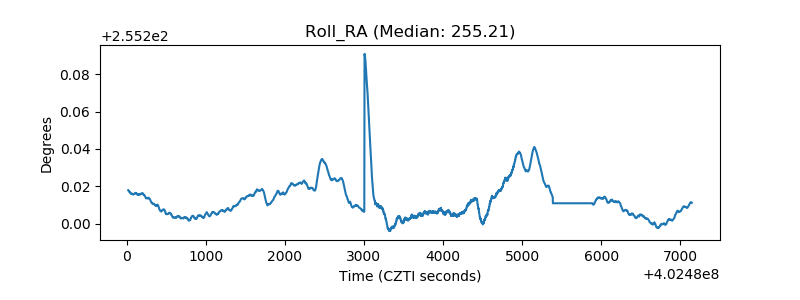 |
| Veto Counter | 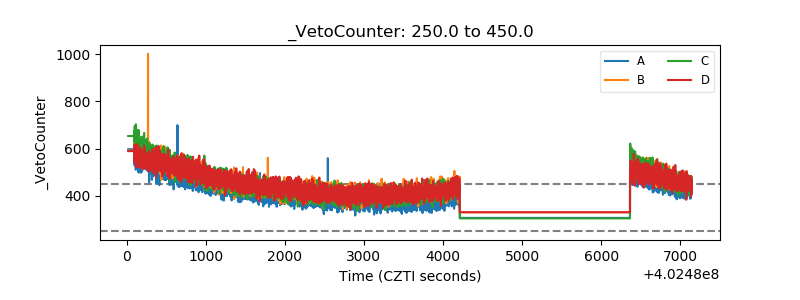 |