| Param | Original file | Final file |
|---|---|---|
| Filename | modeM0/AS1T05_059T01_9000005354_37928cztM0_level2.evt | modeM0/AS1T05_059T01_9000005354_37928cztM0_level2_quad_clean.evt |
| Size (bytes) | 438,425,280 | 66,565,440 |
| Size | 418.1 MB | 63.5 MB |
| Events in quadrant A | 2,809,150 | 438,524 |
| Events in quadrant B | 3,476,378 | 425,811 |
| Events in quadrant C | 2,608,564 | 429,213 |
| Events in quadrant D | 4,032,033 | 359,361 |
| Mode M0 | |||
|---|---|---|---|
| Quadrant | BADHDUFLAG | Total packets | Discarded packets |
| A | 0 | 11429 | 3 |
| B | 0 | 13653 | 2 |
| C | 0 | 10824 | 2 |
| D | 0 | 15456 | 2 |
| Mode SS | |||
|---|---|---|---|
| Quadrant | BADHDUFLAG | Total packets | Discarded packets |
| A | 0 | 106 | 0 |
| B | 0 | 106 | 0 |
| C | 0 | 106 | 0 |
| D | 0 | 106 | 0 |
| Mode M9 | |||
|---|---|---|---|
| Quadrant | BADHDUFLAG | Total packets | Discarded packets |
| A | 0 | 25 | 0 |
| B | 0 | 25 | 0 |
| C | 0 | 25 | 0 |
| D | 0 | 26 | 0 |
| Quadrant | Total seconds | Saturated seconds | Saturation percentage |
|---|---|---|---|
| A | 5173 | 8 | 0.154649% |
| B | 5173 | 180 | 3.479606% |
| C | 5173 | 19 | 0.367292% |
| D | 5173 | 514 | 9.936207% |
Noise dominated data is calculated using 1-second bins in cleaned event files. If a bin has >2000 counts, and if more than 50% of those come from <1% of pixels, then it is considered to be noise-dominated and hence unusable.
| Quadrant | # 1 sec bins | Bins with >0 counts | Bins with >2000 counts | High rate bins dominated by noise | Noise dominated (total time) | Noise dominated (detector-on time) | Marked lightcurve |
|---|---|---|---|---|---|---|---|
| A | 7266 | 5174 | 3 | 3 | 0.04% | 0.06% | 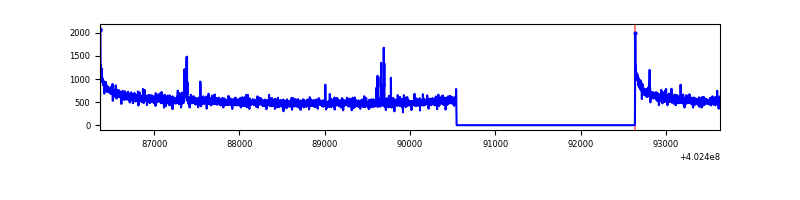 |
| B | 7266 | 5174 | 135 | 135 | 1.86% | 2.61% | 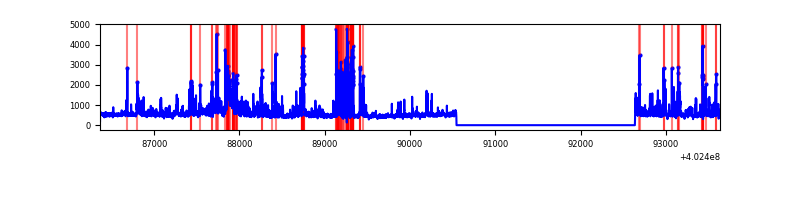 |
| C | 7266 | 5174 | 10 | 10 | 0.14% | 0.19% | 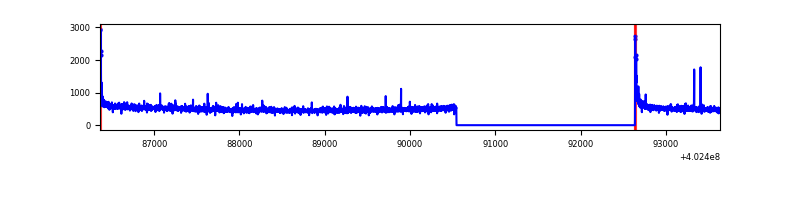 |
| D | 7266 | 5174 | 471 | 471 | 6.48% | 9.10% | 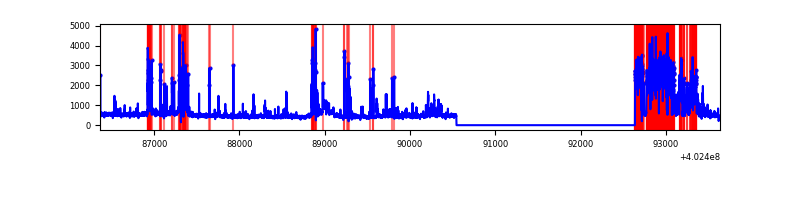 |
Top three noisy pixels from each quadrant. If the there are fewer than three noisy pixels in the level2.evt file, extra rows are filled as -1
| Pixel properties | Quadrant properties | ||||||
|---|---|---|---|---|---|---|---|
| Quadrant | DetID | PixID | Counts | Sigma | Mean | Median | Sigma |
| A | 10 | 83 | 373943 | 3029.24 | 608 | 598 | 123.2 |
| A | 15 | 174 | 31663 | 252.05 | 608 | 598 | 123.2 |
| A | 12 | 189 | 22221 | 175.44 | 608 | 598 | 123.2 |
| B | 5 | 172 | 631090 | 5596.82 | 590 | 577 | 112.7 |
| B | 0 | 229 | 212251 | 1878.95 | 590 | 577 | 112.7 |
| B | 4 | 171 | 89135 | 786.09 | 590 | 577 | 112.7 |
| C | 15 | 214 | 218976 | 1623.82 | 581 | 586 | 134.5 |
| C | 0 | 10 | 73833 | 544.62 | 581 | 586 | 134.5 |
| C | 14 | 254 | 13457 | 95.7 | 581 | 586 | 134.5 |
| D | 12 | 227 | 1084300 | 7912.71 | 559 | 544 | 137.0 |
| D | 13 | 249 | 229966 | 1675.05 | 559 | 544 | 137.0 |
| D | 5 | 32 | 130848 | 951.37 | 559 | 544 | 137.0 |
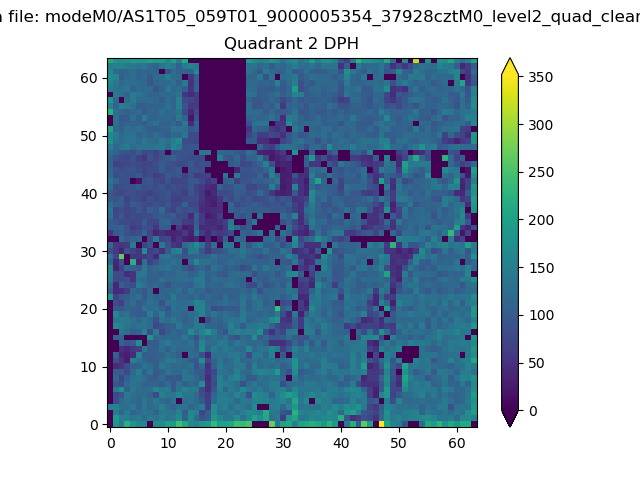
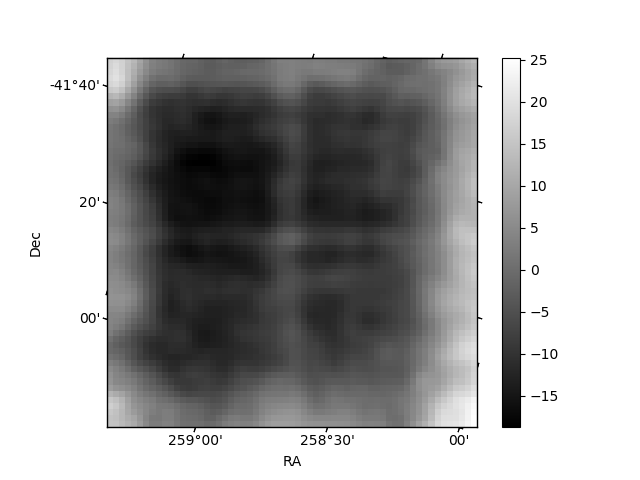
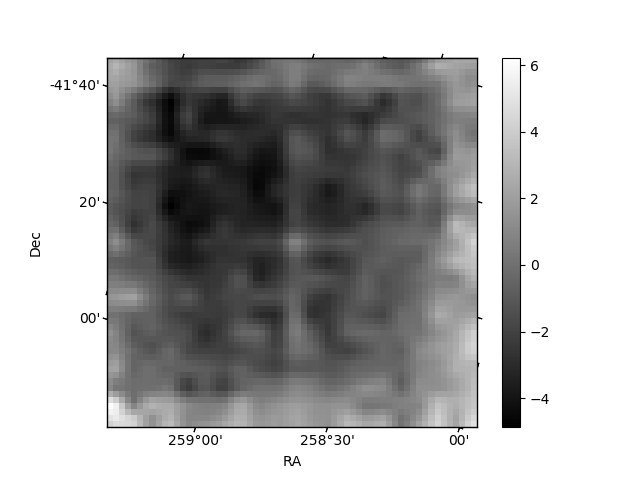
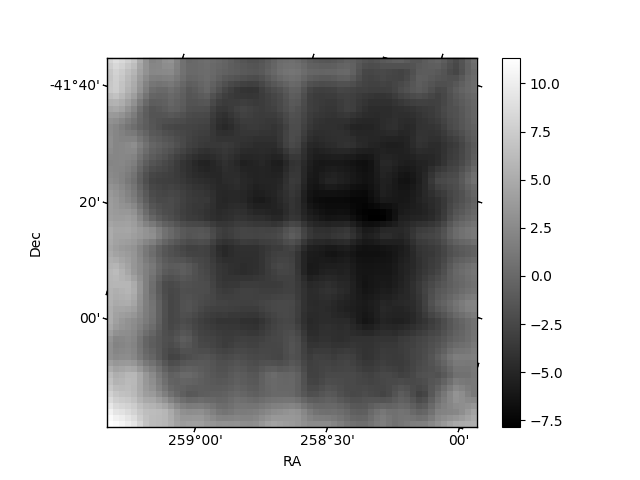
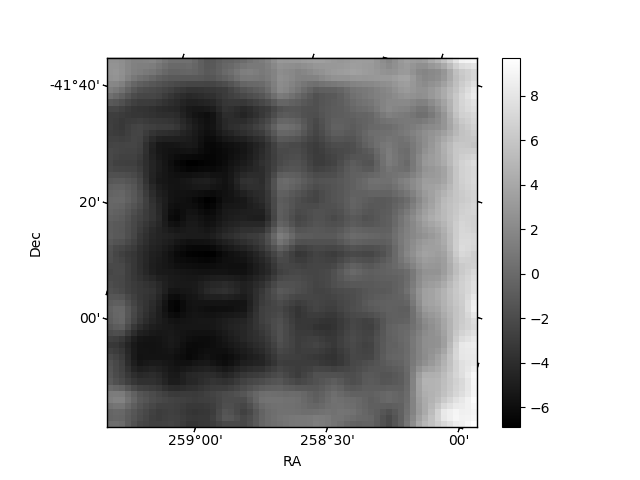
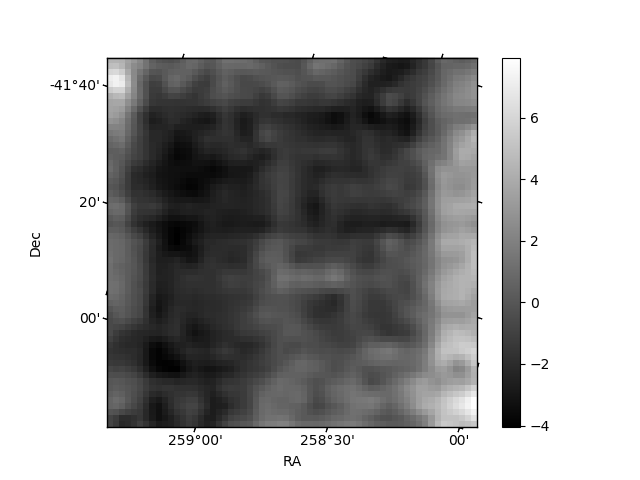
Histogram calculated using DETX and DETY for each event in the final _common_clean file
| Quadrant A | 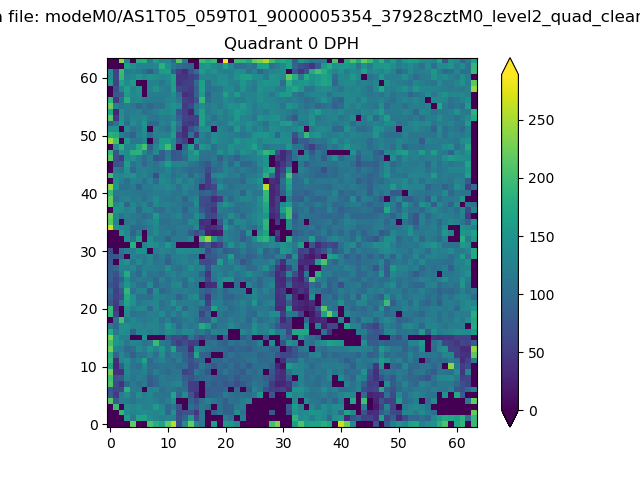 |
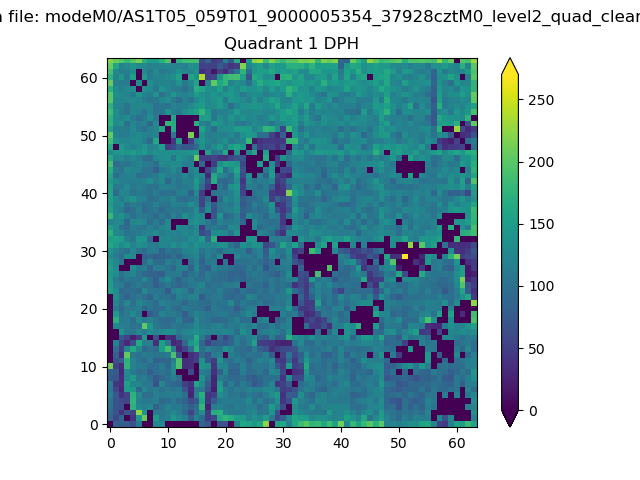 |
Quadrant B |
|---|---|---|---|
| Quadrant D | 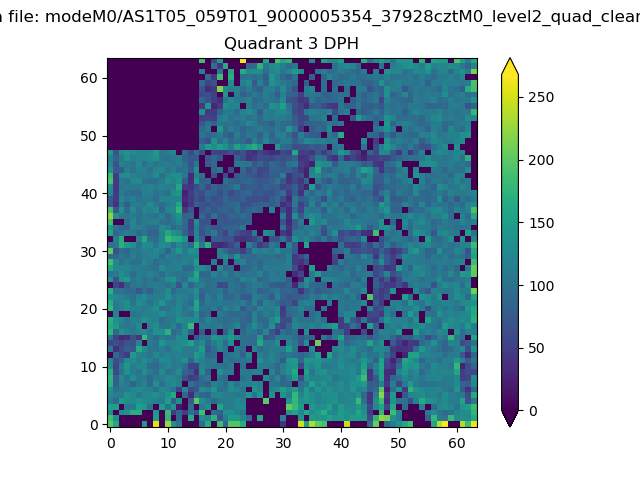 |
 |
Quadrant C |
| Plot type | Count rate plots | Images |
|---|---|---|
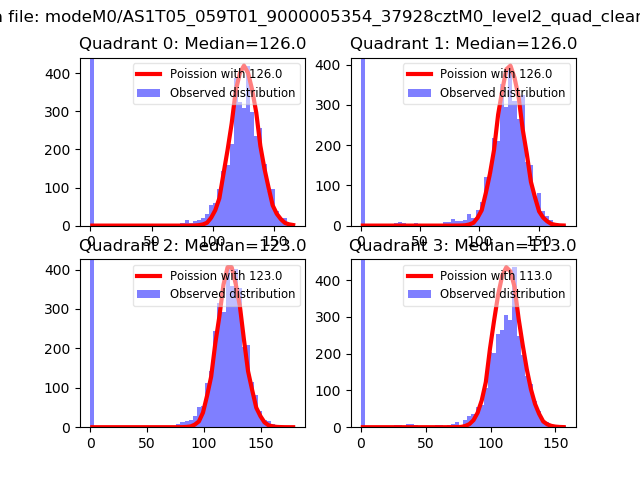
| Comparison with Poisson distribution Blue bars denote a histogram of data divided into 1 sec bins. Red curve is a Poisson curve with rate = median count rate of data. |
 |
 |
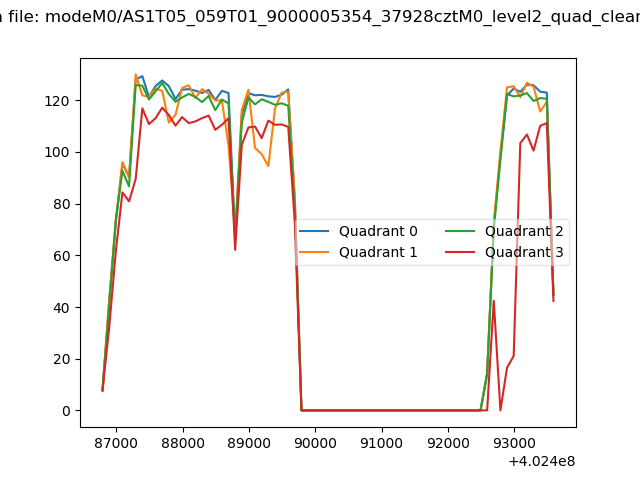
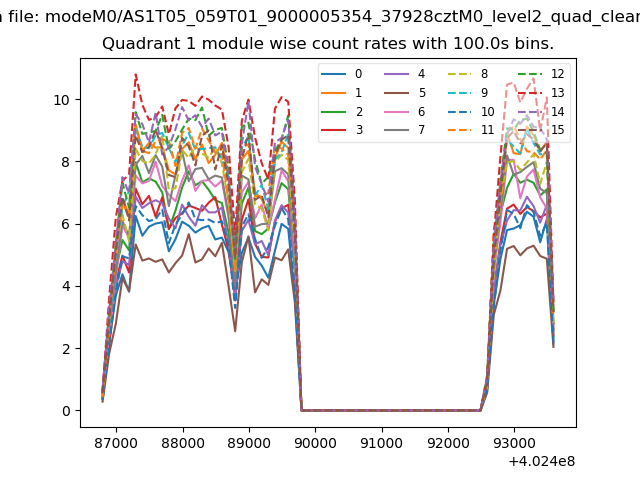
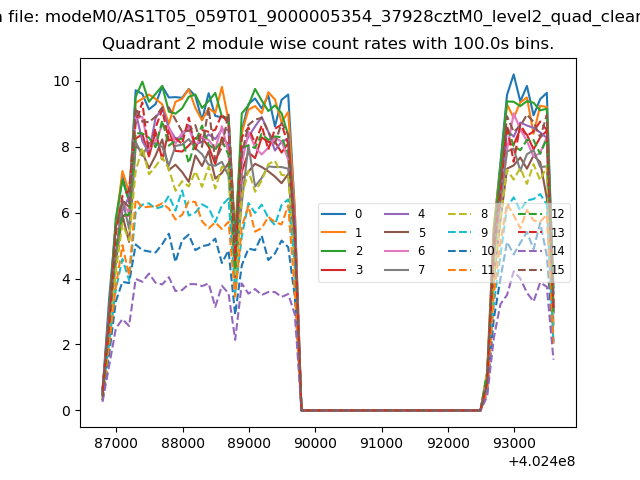
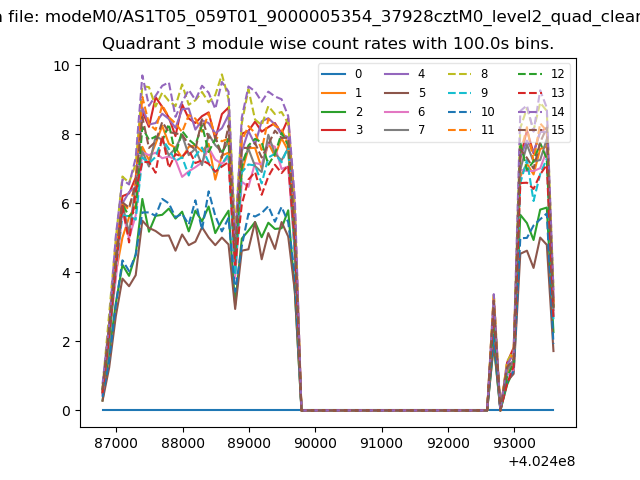
| Quadrant-wise count rates Data is divided into 100 sec bins |
 |
|
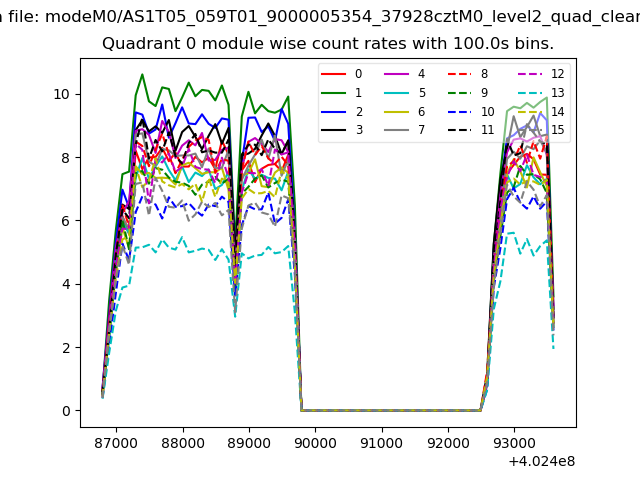
| Module-wise count rates for Quadrant A Data is divided into 100 sec bins |
 |
 |
| Module-wise count rates for Quadrant B Data is divided into 100 sec bins |
 |
 |
| Module-wise count rates for Quadrant C Data is divided into 100 sec bins |
 |
 |
| Module-wise count rates for Quadrant D Data is divided into 100 sec bins |
 |
 |
| Parameter | Plot |
|---|---|
| CZT HV Monitor |  |
| D_VDD | 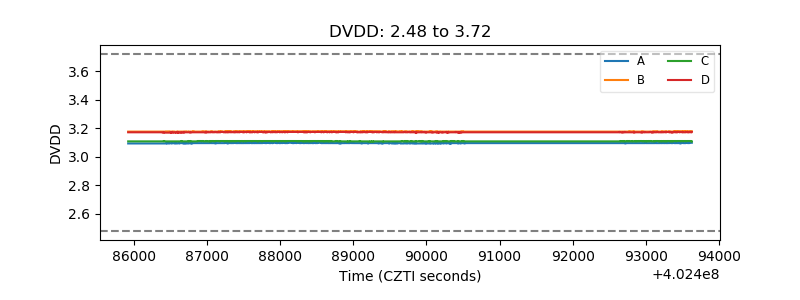 |
| Temperature 1 | 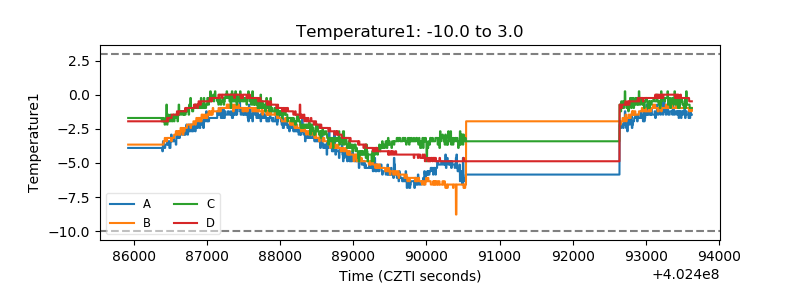 |
| Veto HV Monitor | 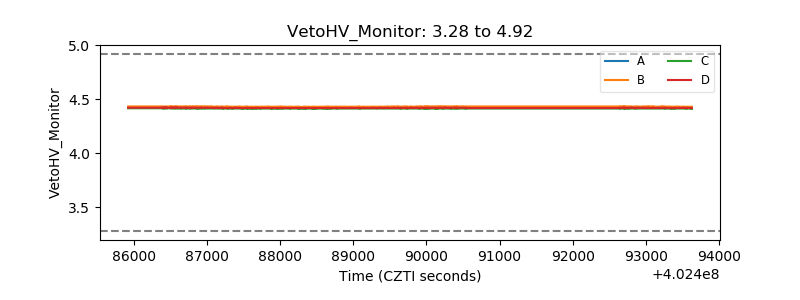 |
| Veto LLD | 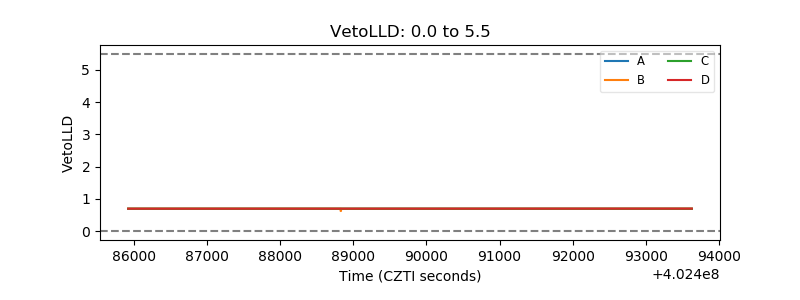 |
| Alpha Counter | 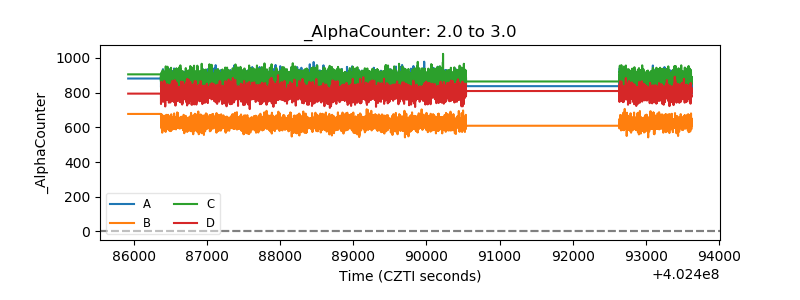 |
| _CPM_Rate | 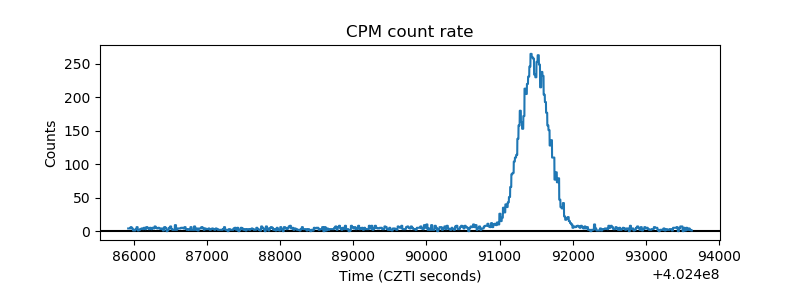 |
| CZT Counter | 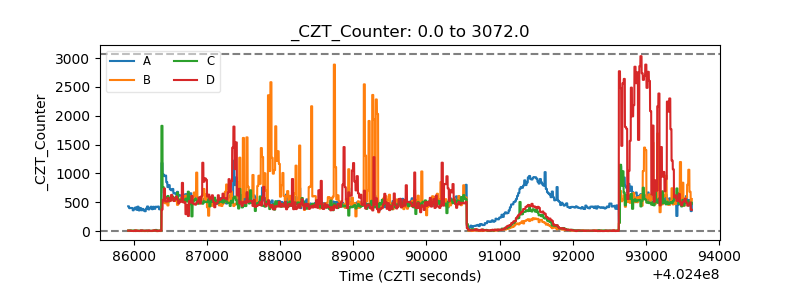 |
| +2.5 Volts monitor | 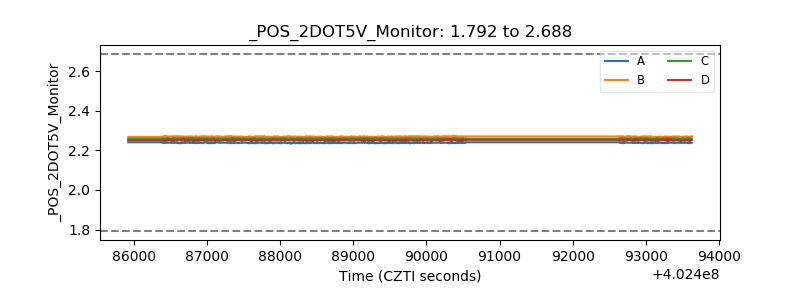 |
| +5 Volts monitor |  |
| _ROLL_ROT | 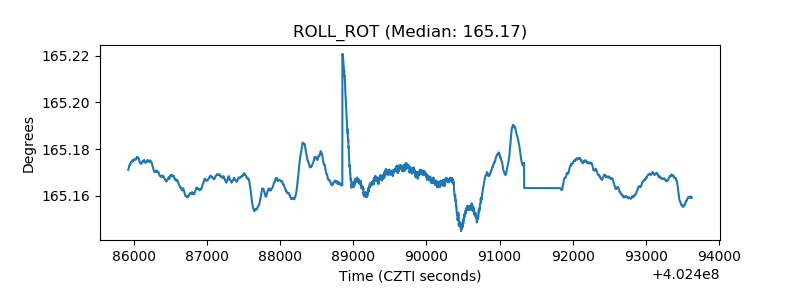 |
| _Roll_DEC | 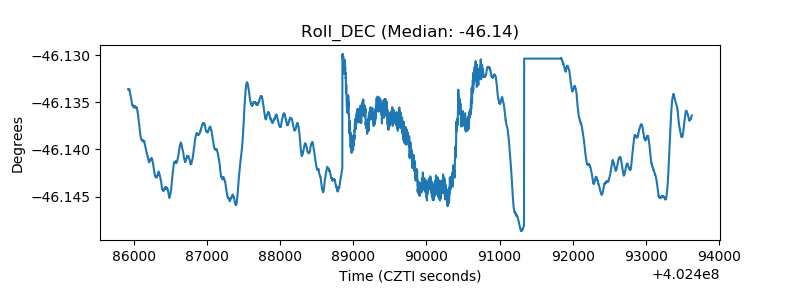 |
| _Roll_RA | 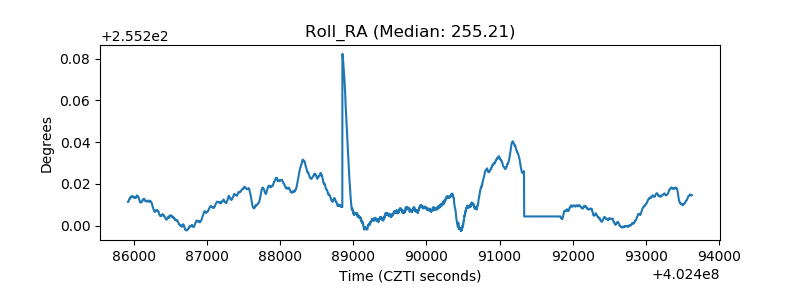 |
| Veto Counter | 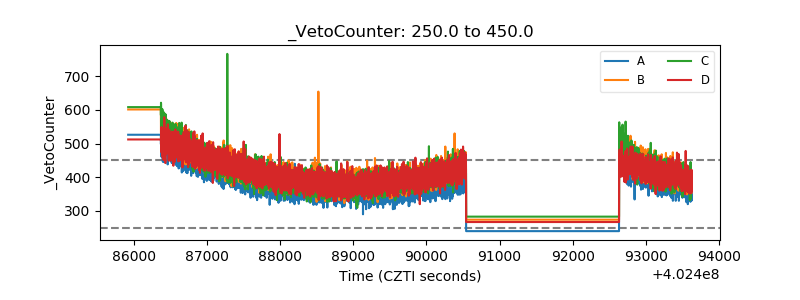 |