| Param | Original file | Final file |
|---|---|---|
| Filename | modeM0/AS1T05_059T01_9000005354_37929cztM0_level2.evt | modeM0/AS1T05_059T01_9000005354_37929cztM0_level2_quad_clean.evt |
| Size (bytes) | 445,547,520 | 69,163,200 |
| Size | 424.9 MB | 66.0 MB |
| Events in quadrant A | 2,939,200 | 452,909 |
| Events in quadrant B | 3,264,889 | 445,576 |
| Events in quadrant C | 2,674,663 | 443,612 |
| Events in quadrant D | 4,247,613 | 374,037 |
| Mode M0 | |||
|---|---|---|---|
| Quadrant | BADHDUFLAG | Total packets | Discarded packets |
| A | 0 | 12077 | 3 |
| B | 0 | 13280 | 2 |
| C | 0 | 11308 | 2 |
| D | 0 | 16370 | 2 |
| Mode SS | |||
|---|---|---|---|
| Quadrant | BADHDUFLAG | Total packets | Discarded packets |
| A | 0 | 110 | 0 |
| B | 0 | 110 | 0 |
| C | 0 | 110 | 0 |
| D | 0 | 110 | 0 |
| Mode M9 | |||
|---|---|---|---|
| Quadrant | BADHDUFLAG | Total packets | Discarded packets |
| A | 0 | 25 | 0 |
| B | 0 | 25 | 0 |
| C | 0 | 25 | 0 |
| D | 0 | 26 | 0 |
| Quadrant | Total seconds | Saturated seconds | Saturation percentage |
|---|---|---|---|
| A | 5400 | 12 | 0.222222% |
| B | 5400 | 128 | 2.370370% |
| C | 5400 | 18 | 0.333333% |
| D | 5400 | 586 | 10.851852% |
Noise dominated data is calculated using 1-second bins in cleaned event files. If a bin has >2000 counts, and if more than 50% of those come from <1% of pixels, then it is considered to be noise-dominated and hence unusable.
| Quadrant | # 1 sec bins | Bins with >0 counts | Bins with >2000 counts | High rate bins dominated by noise | Noise dominated (total time) | Noise dominated (detector-on time) | Marked lightcurve |
|---|---|---|---|---|---|---|---|
| A | 7252 | 5401 | 3 | 3 | 0.04% | 0.06% | 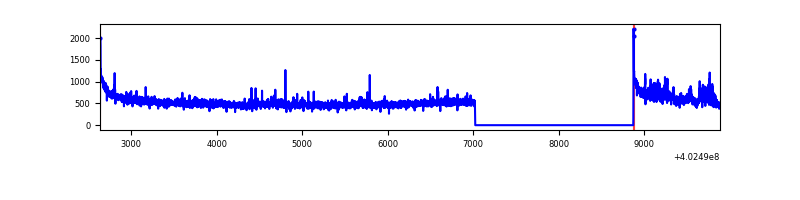 |
| B | 7252 | 5401 | 103 | 103 | 1.42% | 1.91% | 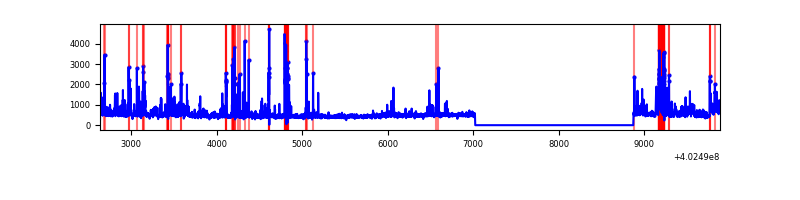 |
| C | 7252 | 5401 | 11 | 11 | 0.15% | 0.20% | 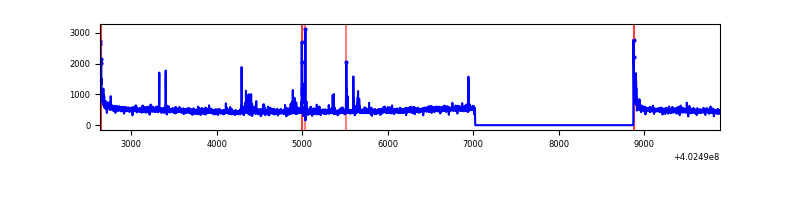 |
| D | 7252 | 5401 | 523 | 523 | 7.21% | 9.68% | 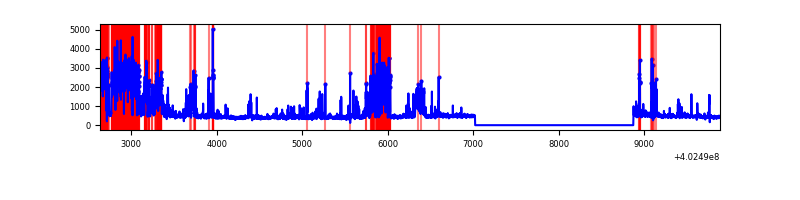 |
Top three noisy pixels from each quadrant. If the there are fewer than three noisy pixels in the level2.evt file, extra rows are filled as -1
| Pixel properties | Quadrant properties | ||||||
|---|---|---|---|---|---|---|---|
| Quadrant | DetID | PixID | Counts | Sigma | Mean | Median | Sigma |
| A | 10 | 83 | 390776 | 3122.14 | 612 | 601 | 125.0 |
| A | 12 | 189 | 149809 | 1193.95 | 612 | 601 | 125.0 |
| A | 13 | 6 | 15705 | 120.86 | 612 | 601 | 125.0 |
| B | 5 | 172 | 483683 | 4183.67 | 599 | 585 | 115.5 |
| B | 0 | 229 | 166659 | 1438.22 | 599 | 585 | 115.5 |
| B | 0 | 230 | 79181 | 680.65 | 599 | 585 | 115.5 |
| C | 15 | 214 | 228300 | 1668.17 | 586 | 591 | 136.5 |
| C | 0 | 10 | 72363 | 525.79 | 586 | 591 | 136.5 |
| C | 14 | 254 | 68516 | 497.61 | 586 | 591 | 136.5 |
| D | 12 | 227 | 1199944 | 8641.07 | 559 | 542 | 138.8 |
| D | 2 | 249 | 338024 | 2431.38 | 559 | 542 | 138.8 |
| D | 13 | 249 | 151063 | 1084.43 | 559 | 542 | 138.8 |
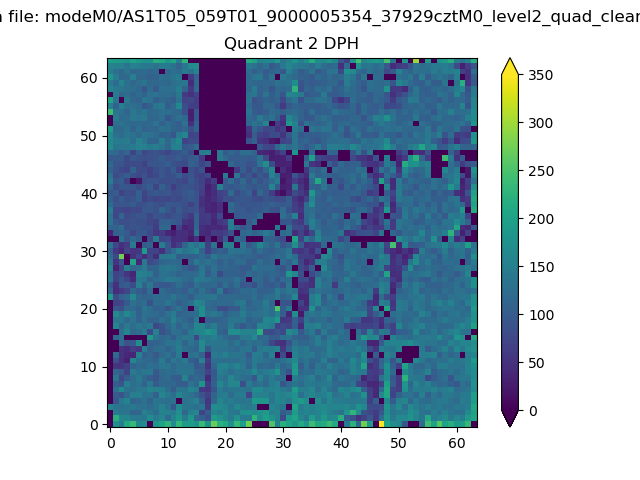
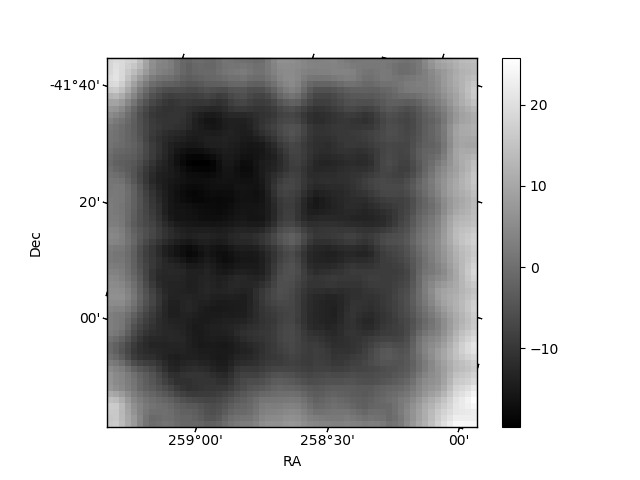
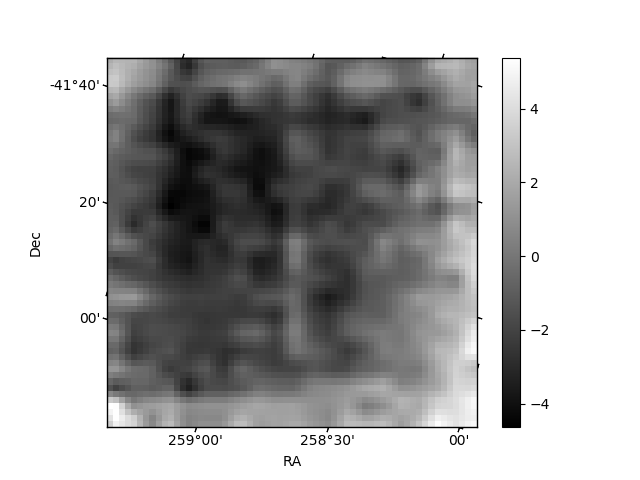
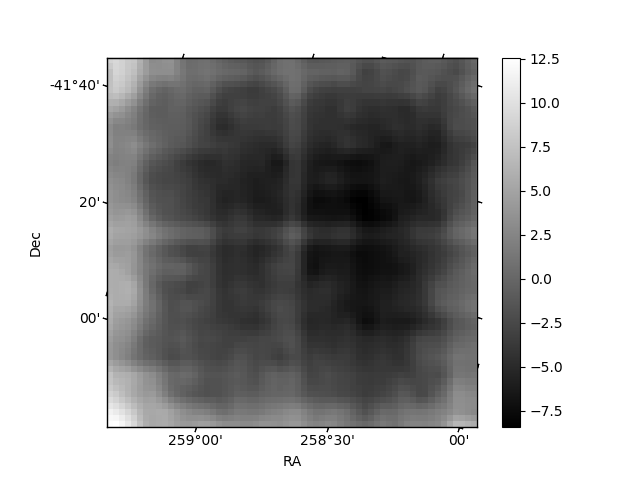
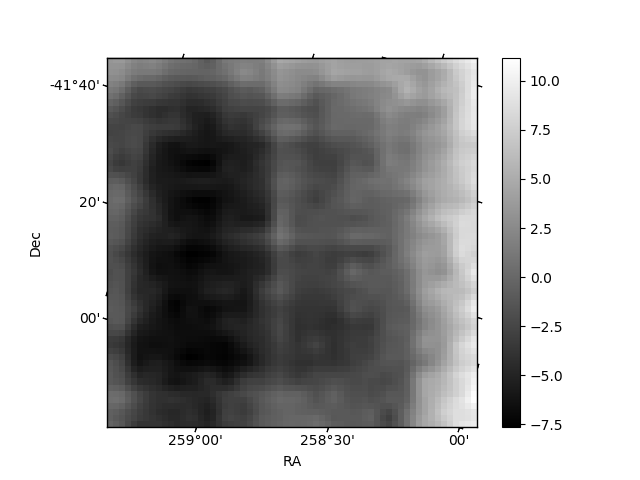
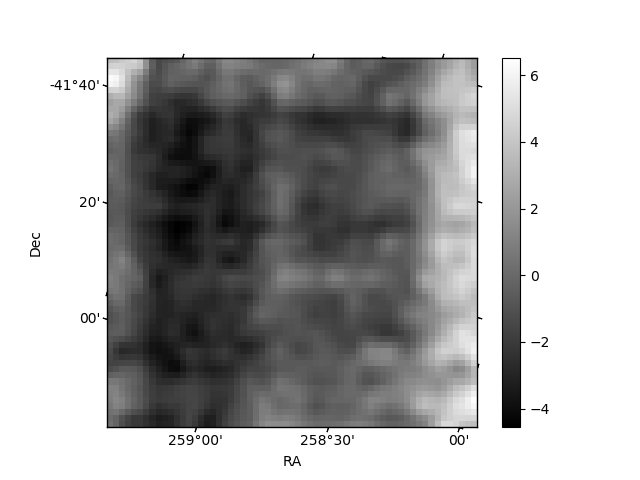
Histogram calculated using DETX and DETY for each event in the final _common_clean file
| Quadrant A | 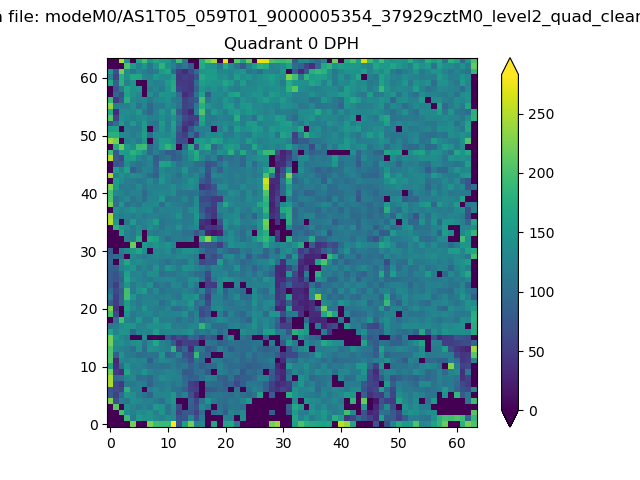 |
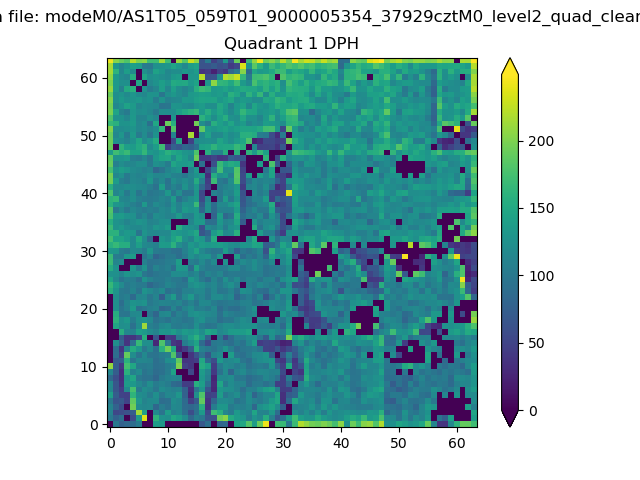 |
Quadrant B |
|---|---|---|---|
| Quadrant D | 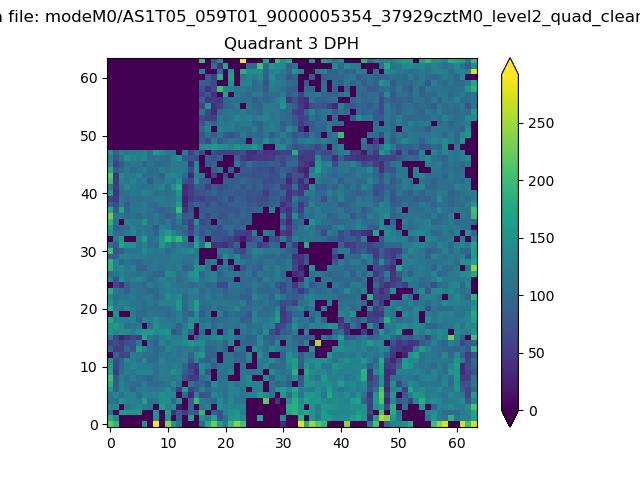 |
 |
Quadrant C |
| Plot type | Count rate plots | Images |
|---|---|---|
| Comparison with Poisson distribution Blue bars denote a histogram of data divided into 1 sec bins. Red curve is a Poisson curve with rate = median count rate of data. |
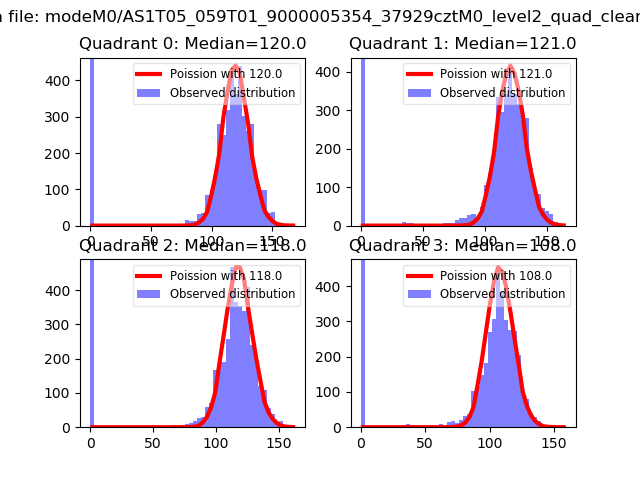 |
 |
| Quadrant-wise count rates Data is divided into 100 sec bins |
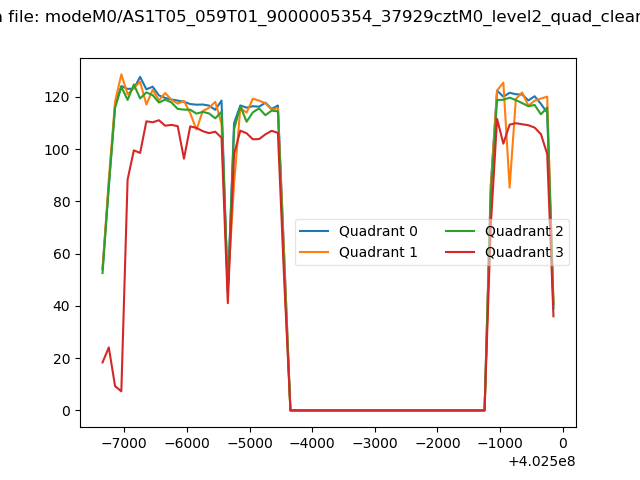 |
|
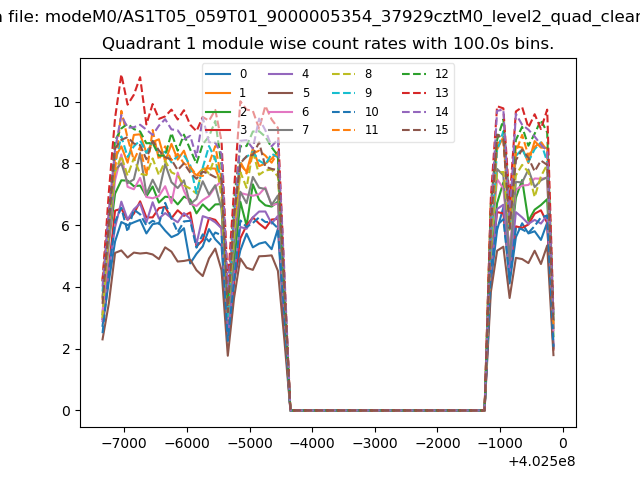
| Module-wise count rates for Quadrant A Data is divided into 100 sec bins |
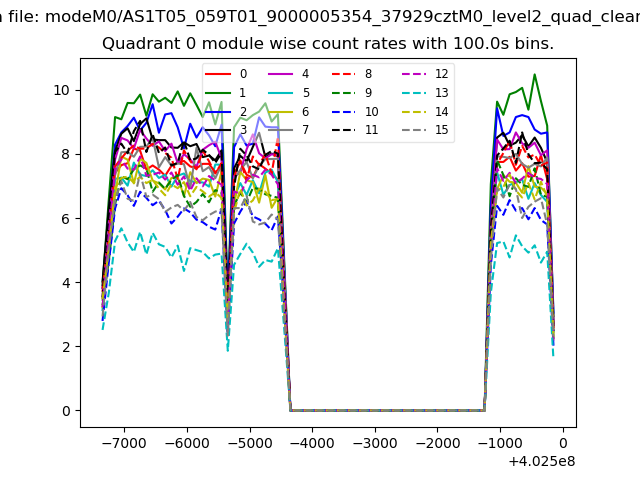 |
 |
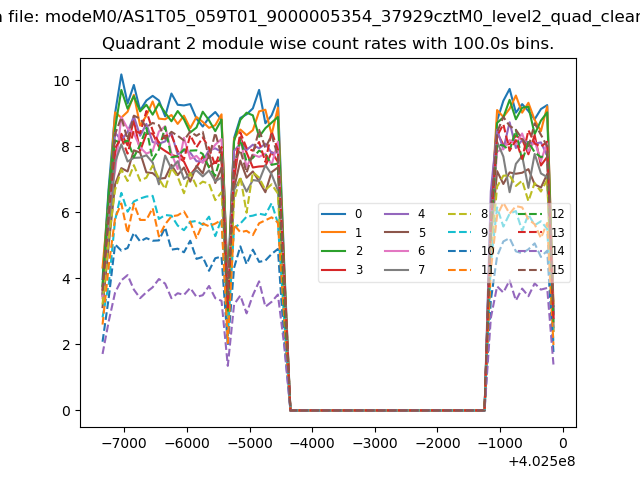
| Module-wise count rates for Quadrant B Data is divided into 100 sec bins |
 |
 |
| Module-wise count rates for Quadrant C Data is divided into 100 sec bins |
 |
 |
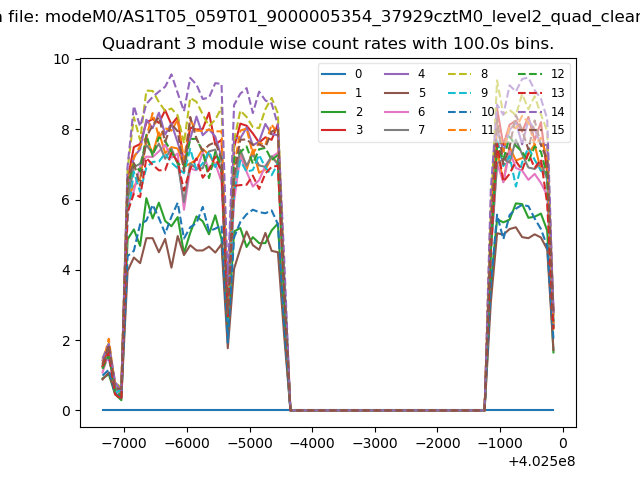
| Module-wise count rates for Quadrant D Data is divided into 100 sec bins |
 |
 |
| Parameter | Plot |
|---|---|
| CZT HV Monitor | 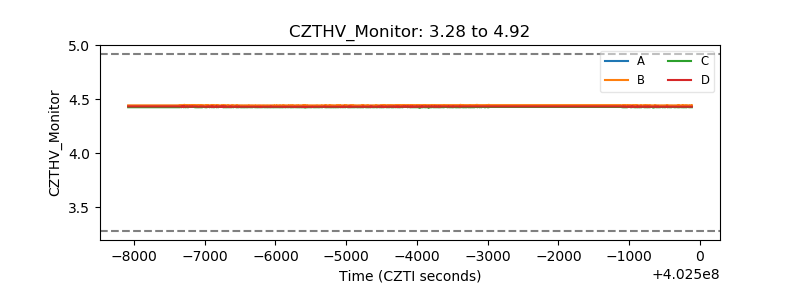 |
| D_VDD | 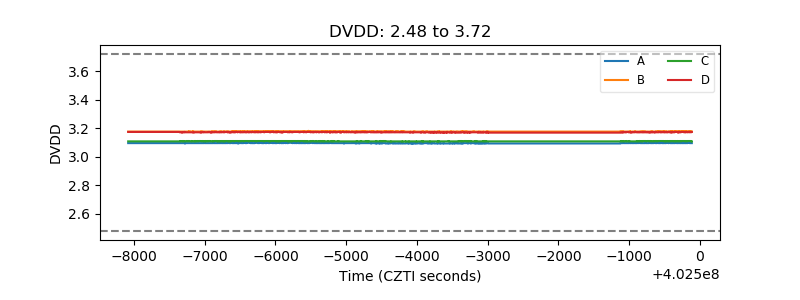 |
| Temperature 1 |  |
| Veto HV Monitor | 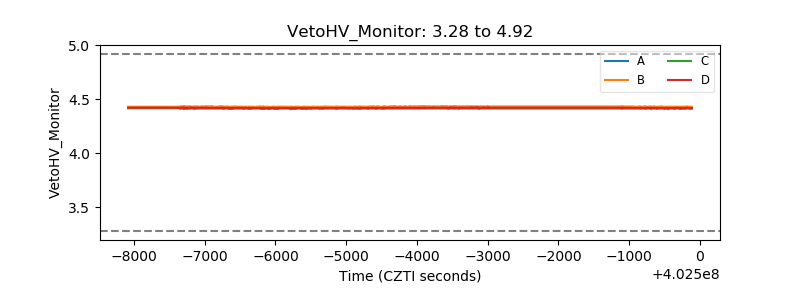 |
| Veto LLD | 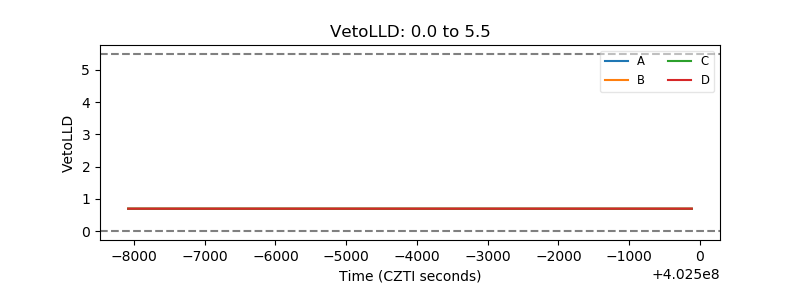 |
| Alpha Counter | 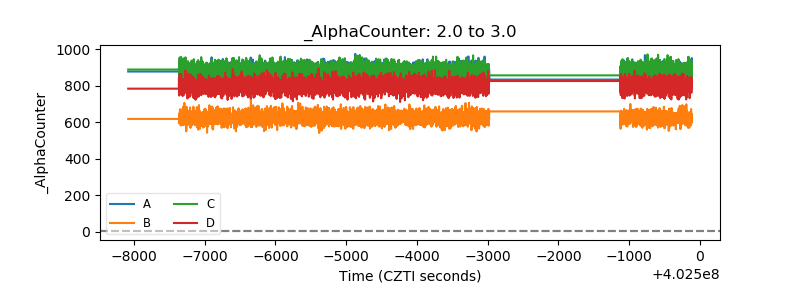 |
| _CPM_Rate | 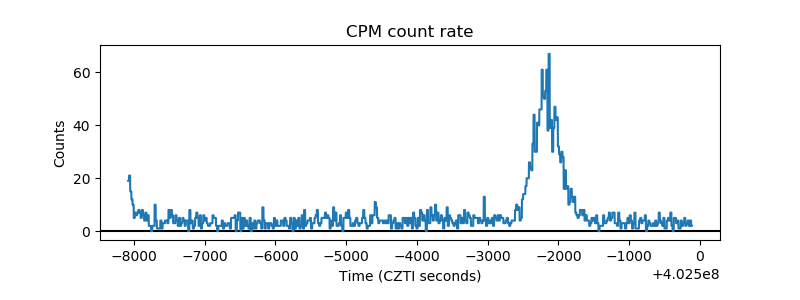 |
| CZT Counter | 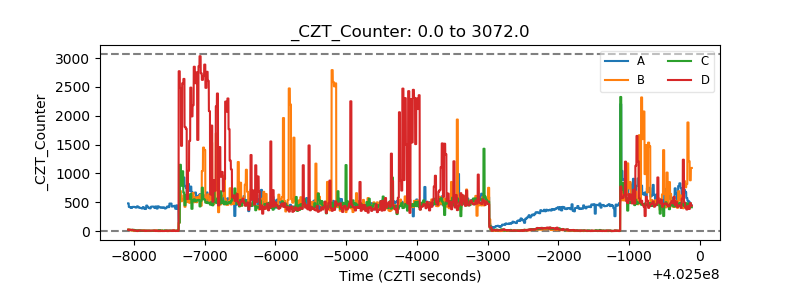 |
| +2.5 Volts monitor | 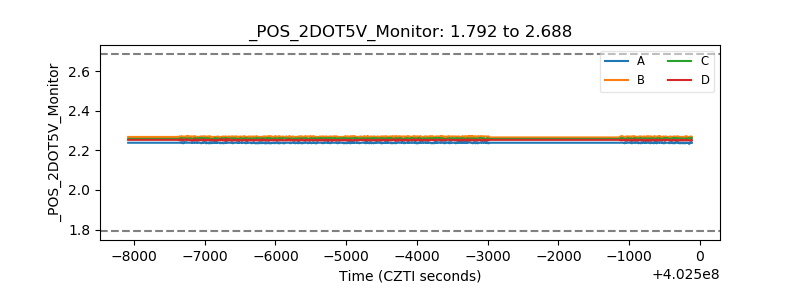 |
| +5 Volts monitor | 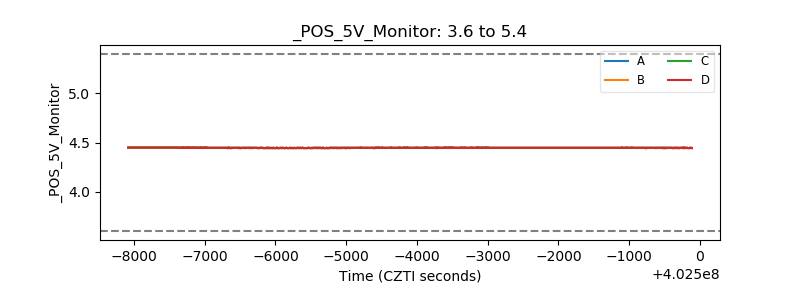 |
| _ROLL_ROT | 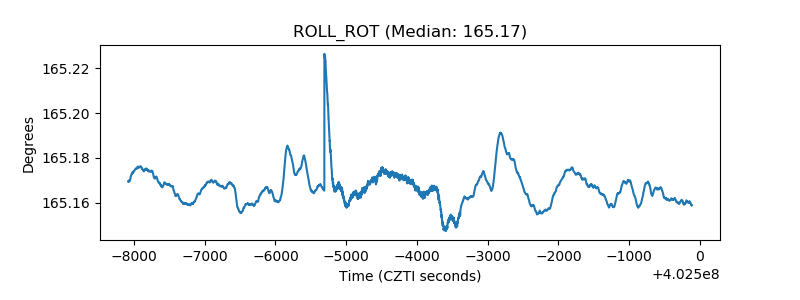 |
| _Roll_DEC | 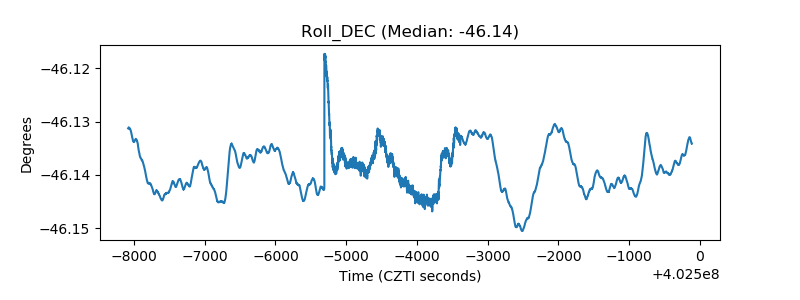 |
| _Roll_RA | 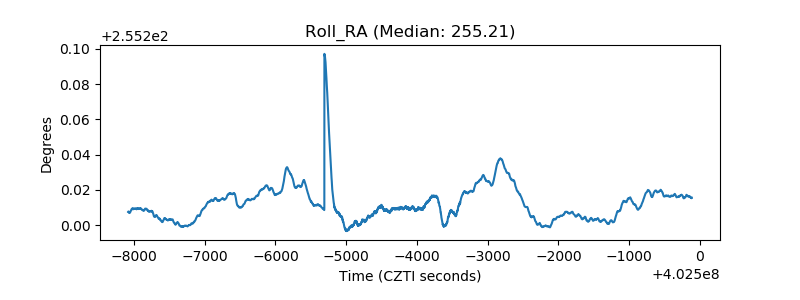 |
| Veto Counter | 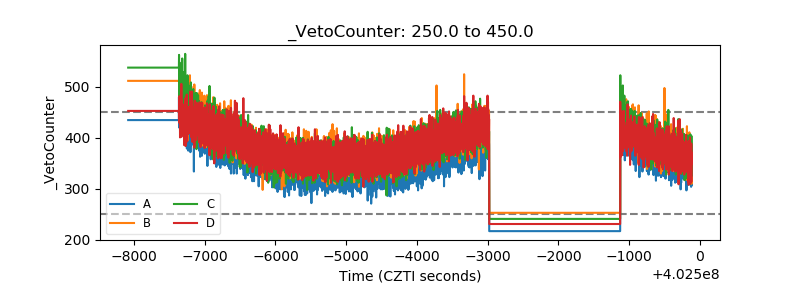 |