| Param | Original file | Final file |
|---|---|---|
| Filename | modeM0/AS1T05_059T01_9000005354_37930cztM0_level2.evt | modeM0/AS1T05_059T01_9000005354_37930cztM0_level2_quad_clean.evt |
| Size (bytes) | 183,021,120 | 41,909,760 |
| Size | 174.5 MB | 40.0 MB |
| Events in quadrant A | 1,385,547 | 280,382 |
| Events in quadrant B | 1,611,943 | 274,176 |
| Events in quadrant C | 1,059,051 | 282,506 |
| Events in quadrant D | 1,328,528 | 266,562 |
| Mode M0 | |||
|---|---|---|---|
| Quadrant | BADHDUFLAG | Total packets | Discarded packets |
| A | 0 | 5665 | 1 |
| B | 0 | 6404 | 1 |
| C | 0 | 4713 | 1 |
| D | 0 | 5592 | 1 |
| Mode SS | |||
|---|---|---|---|
| Quadrant | BADHDUFLAG | Total packets | Discarded packets |
| A | 0 | 46 | 0 |
| B | 0 | 46 | 0 |
| C | 0 | 46 | 0 |
| D | 0 | 46 | 0 |
| Mode M9 | |||
|---|---|---|---|
| Quadrant | BADHDUFLAG | Total packets | Discarded packets |
| A | 0 | 10 | 0 |
| B | 0 | 10 | 0 |
| C | 0 | 10 | 0 |
| D | 0 | 11 | 0 |
| Quadrant | Total seconds | Saturated seconds | Saturation percentage |
|---|---|---|---|
| A | 2288 | 4 | 0.174825% |
| B | 2288 | 130 | 5.681818% |
| C | 2288 | 5 | 0.218531% |
| D | 2288 | 105 | 4.589161% |
Noise dominated data is calculated using 1-second bins in cleaned event files. If a bin has >2000 counts, and if more than 50% of those come from <1% of pixels, then it is considered to be noise-dominated and hence unusable.
| Quadrant | # 1 sec bins | Bins with >0 counts | Bins with >2000 counts | High rate bins dominated by noise | Noise dominated (total time) | Noise dominated (detector-on time) | Marked lightcurve |
|---|---|---|---|---|---|---|---|
| A | 2288 | 2288 | 2 | 2 | 0.09% | 0.09% | 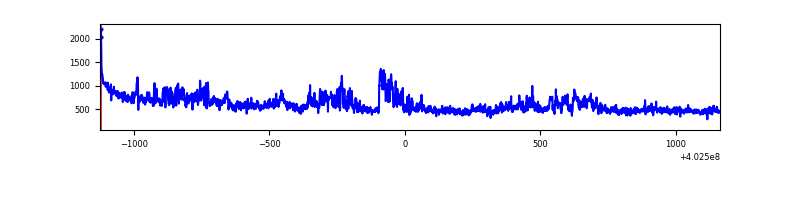 |
| B | 2288 | 2288 | 117 | 117 | 5.11% | 5.11% | 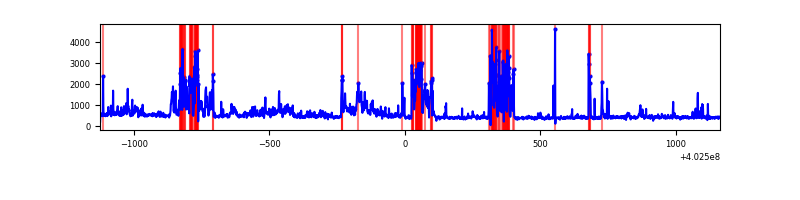 |
| C | 2288 | 2288 | 2 | 2 | 0.09% | 0.09% | 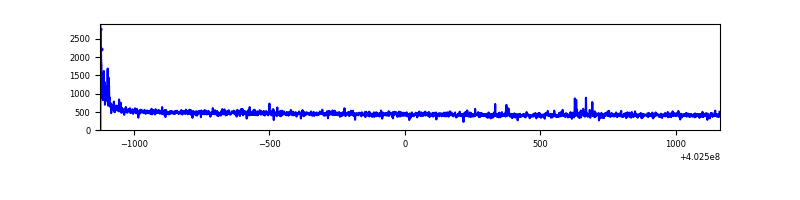 |
| D | 2288 | 2288 | 90 | 90 | 3.93% | 3.93% | 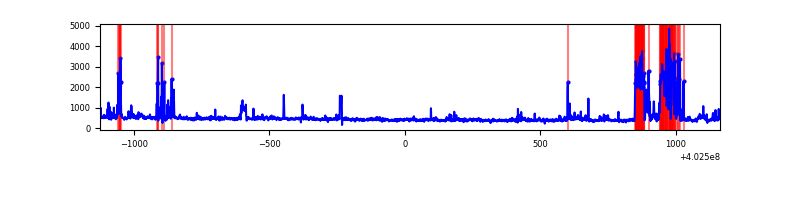 |
Top three noisy pixels from each quadrant. If the there are fewer than three noisy pixels in the level2.evt file, extra rows are filled as -1
| Pixel properties | Quadrant properties | ||||||
|---|---|---|---|---|---|---|---|
| Quadrant | DetID | PixID | Counts | Sigma | Mean | Median | Sigma |
| A | 12 | 189 | 234336 | 4500.6 | 247 | 243 | 52.0 |
| A | 10 | 83 | 183596 | 3525.09 | 247 | 243 | 52.0 |
| A | 13 | 248 | 5486 | 100.8 | 247 | 243 | 52.0 |
| B | 5 | 172 | 498813 | 10313.76 | 238 | 232 | 48.3 |
| B | 0 | 229 | 90846 | 1874.46 | 238 | 232 | 48.3 |
| B | 0 | 230 | 50795 | 1045.96 | 238 | 232 | 48.3 |
| C | 15 | 214 | 97250 | 1724.22 | 234 | 235 | 56.3 |
| C | 0 | 10 | 33148 | 584.95 | 234 | 235 | 56.3 |
| C | 14 | 254 | 5949 | 101.55 | 234 | 235 | 56.3 |
| D | 13 | 249 | 163858 | 2807.42 | 233 | 227 | 58.3 |
| D | 10 | 253 | 115018 | 1969.47 | 233 | 227 | 58.3 |
| D | 10 | 199 | 38792 | 661.66 | 233 | 227 | 58.3 |
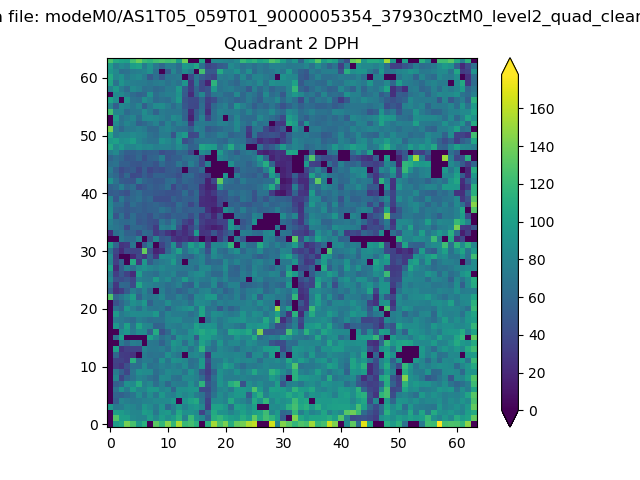
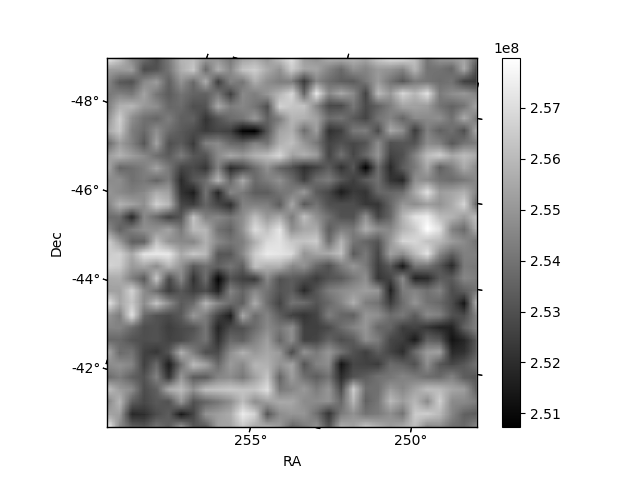
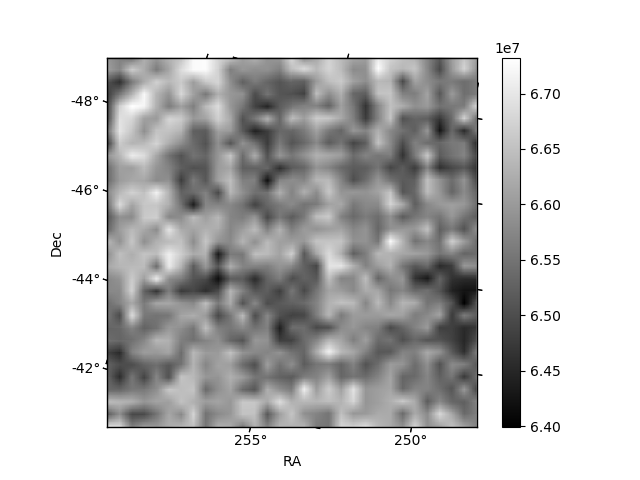
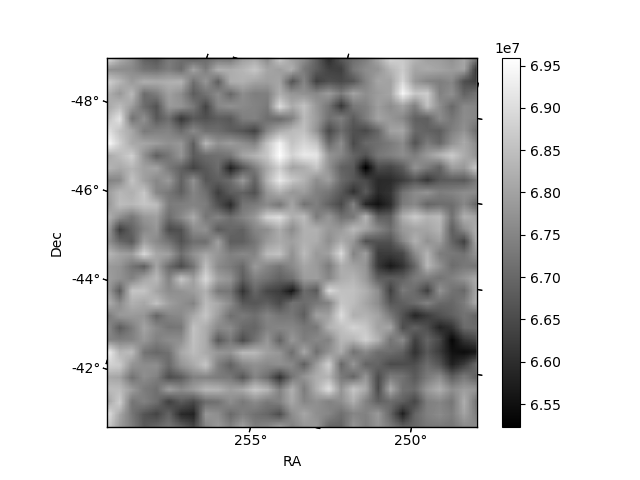
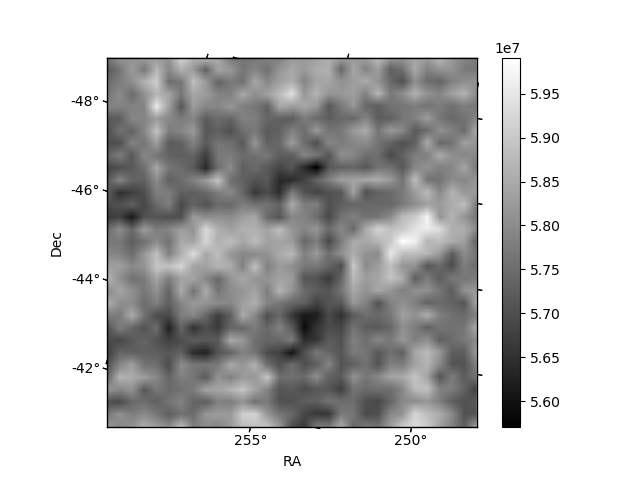
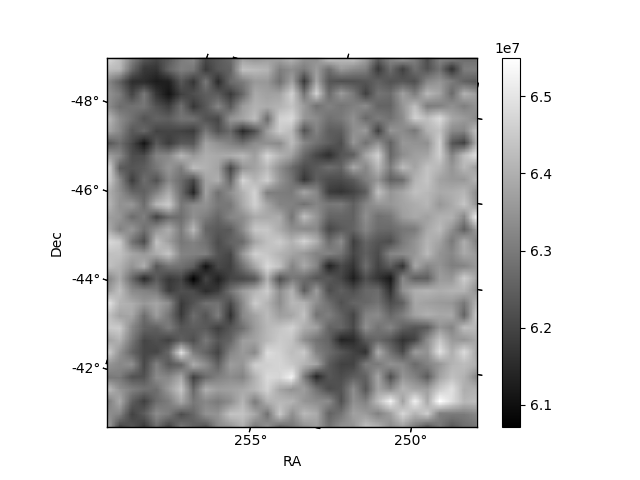
Histogram calculated using DETX and DETY for each event in the final _common_clean file
| Quadrant A | 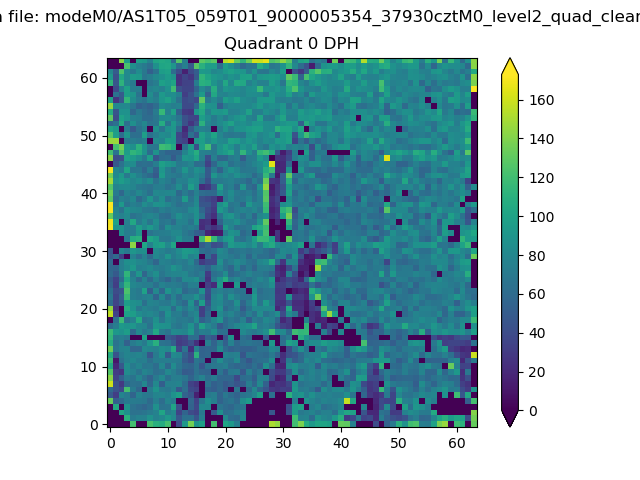 |
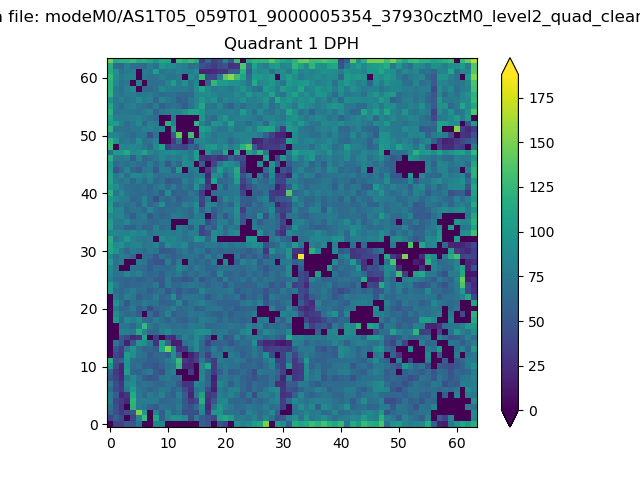 |
Quadrant B |
|---|---|---|---|
| Quadrant D | 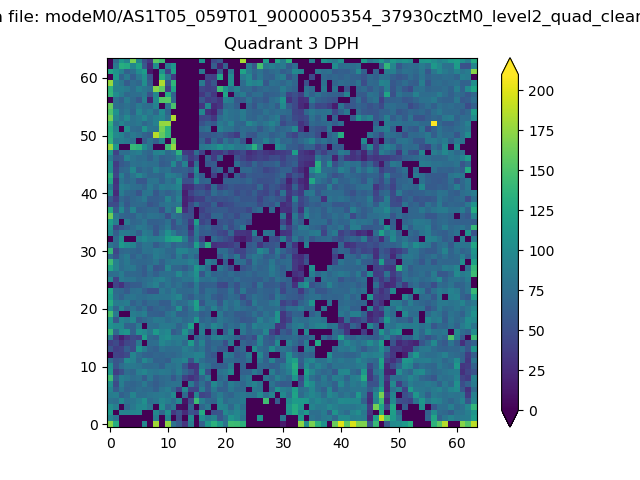 |
 |
Quadrant C |
| Plot type | Count rate plots | Images |
|---|---|---|
| Comparison with Poisson distribution Blue bars denote a histogram of data divided into 1 sec bins. Red curve is a Poisson curve with rate = median count rate of data. |
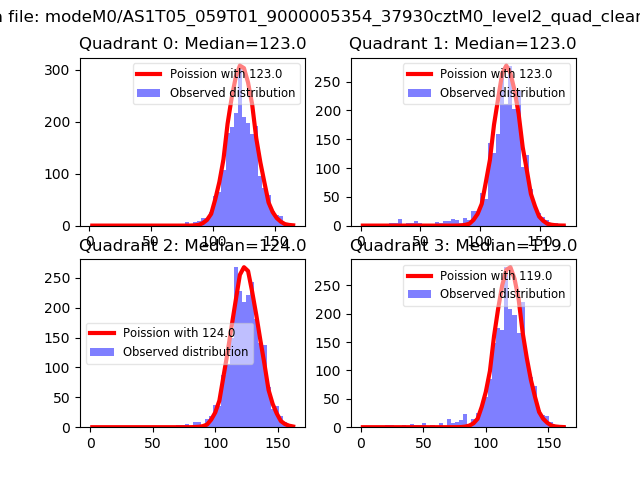 |
 |
| Quadrant-wise count rates Data is divided into 100 sec bins |
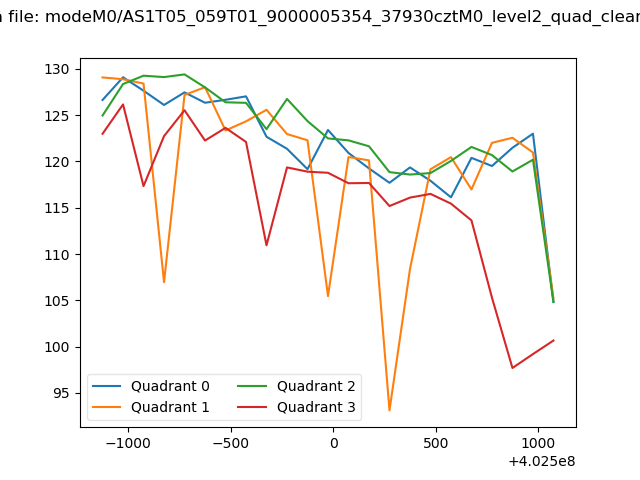 |
|
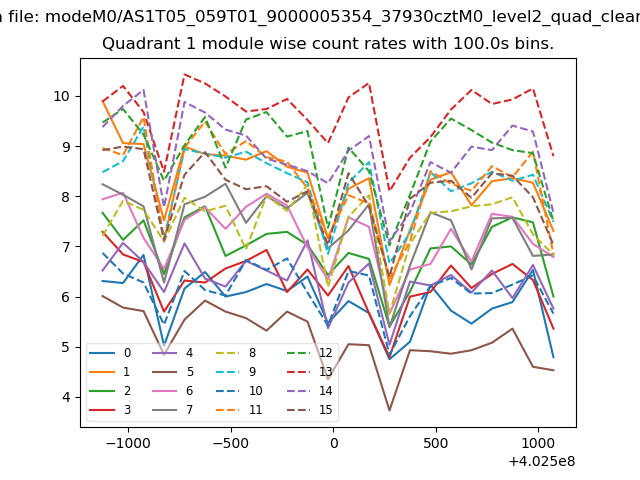
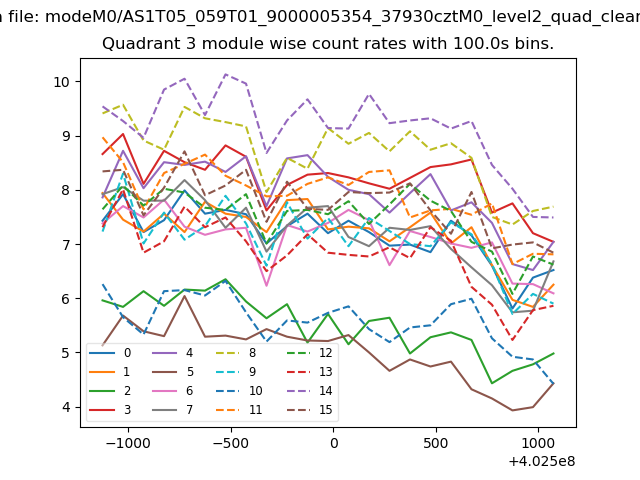
| Module-wise count rates for Quadrant A Data is divided into 100 sec bins |
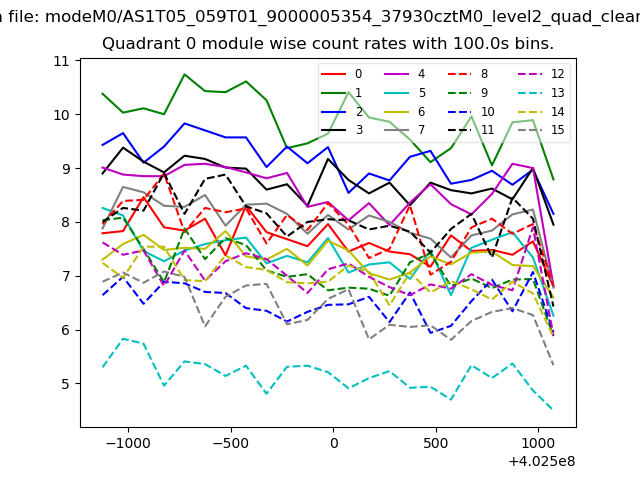 |
 |
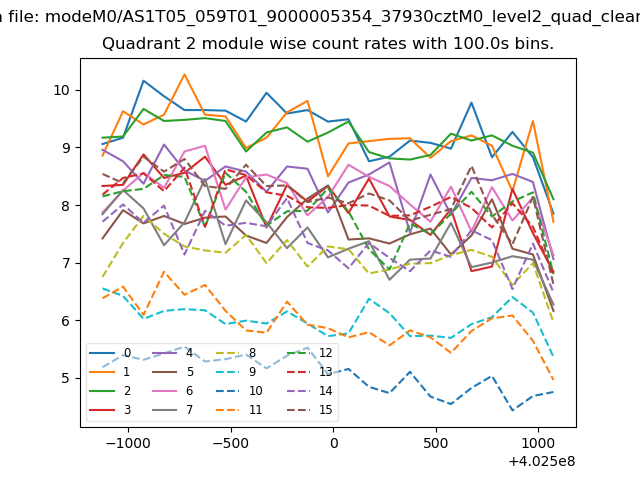
| Module-wise count rates for Quadrant B Data is divided into 100 sec bins |
 |
 |
| Module-wise count rates for Quadrant C Data is divided into 100 sec bins |
 |
 |
| Module-wise count rates for Quadrant D Data is divided into 100 sec bins |
 |
 |
| Parameter | Plot |
|---|---|
| CZT HV Monitor | 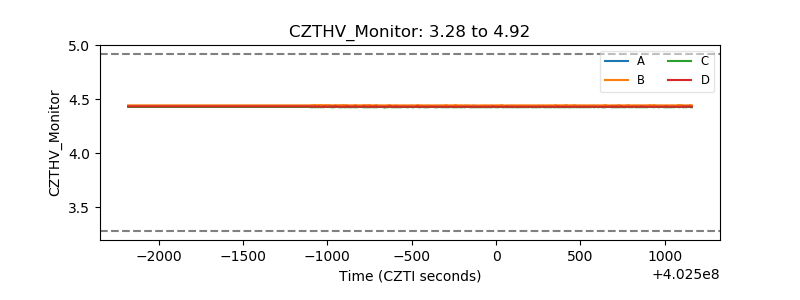 |
| D_VDD | 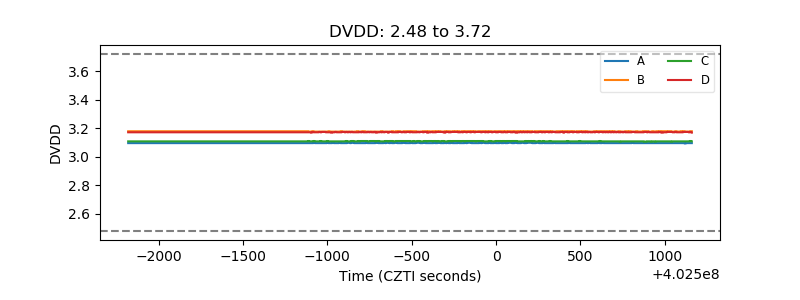 |
| Temperature 1 | 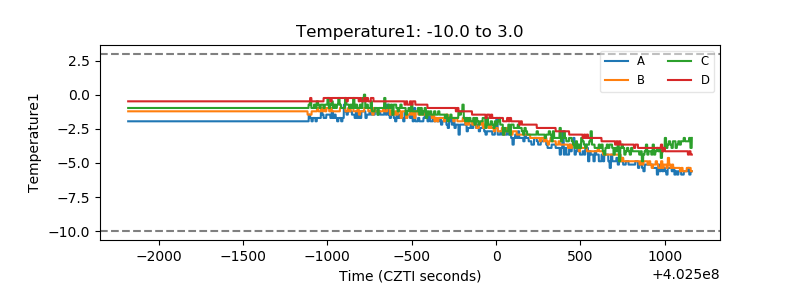 |
| Veto HV Monitor | 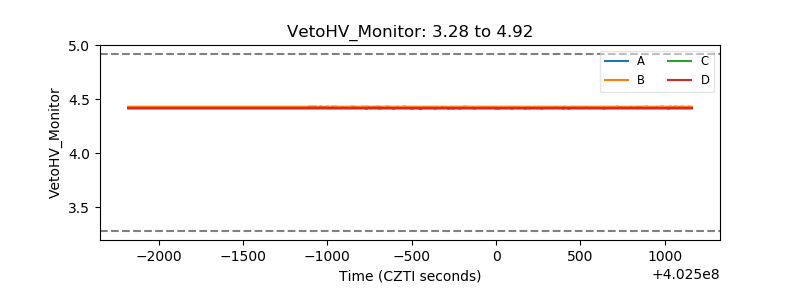 |
| Veto LLD | 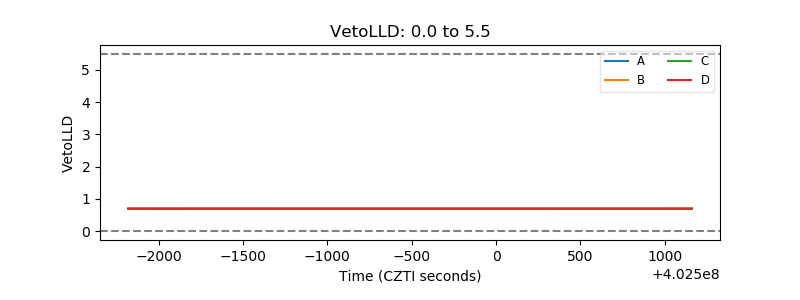 |
| Alpha Counter | 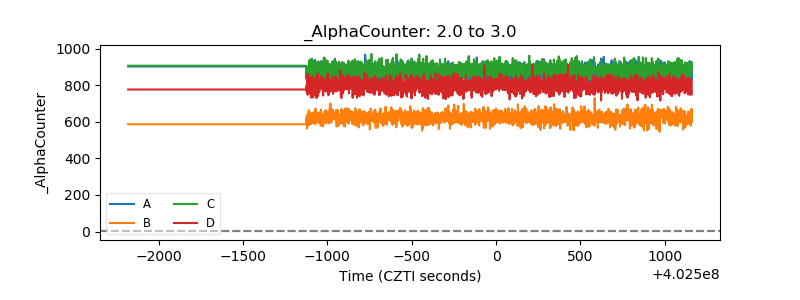 |
| _CPM_Rate | 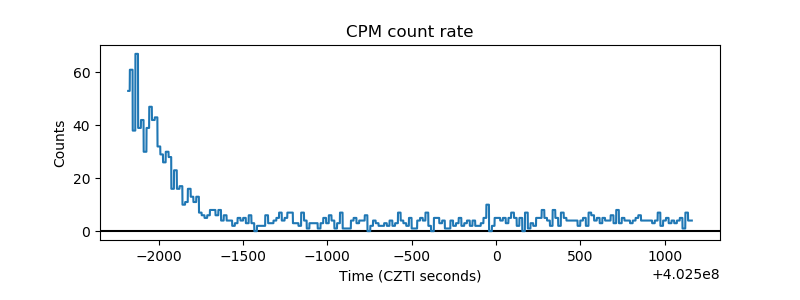 |
| CZT Counter | 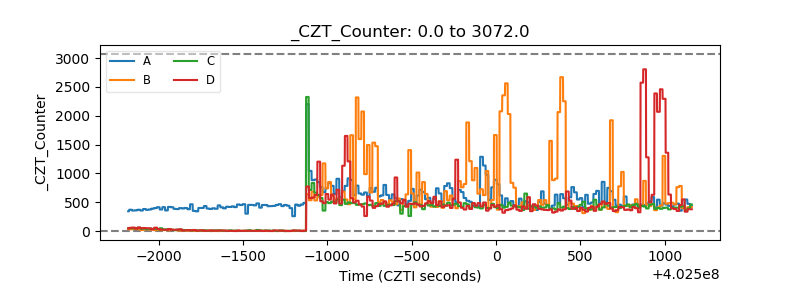 |
| +2.5 Volts monitor | 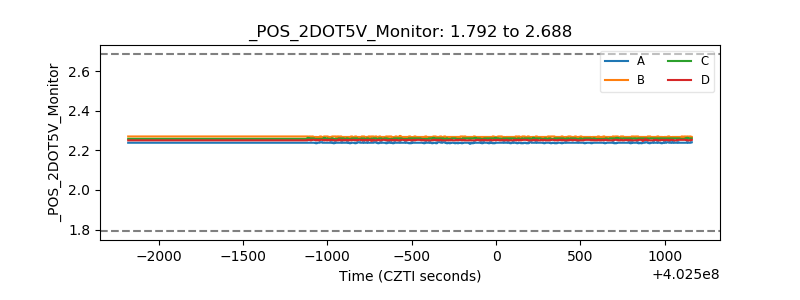 |
| +5 Volts monitor |  |
| _ROLL_ROT | 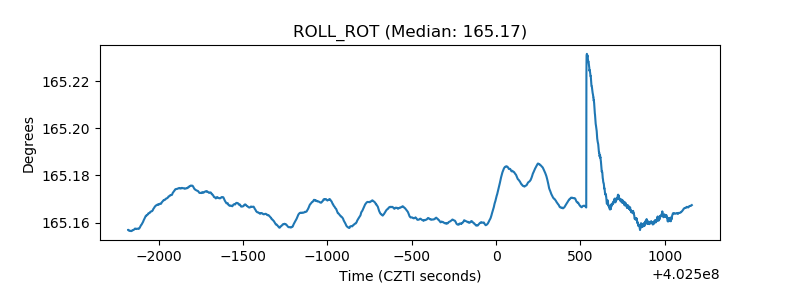 |
| _Roll_DEC | 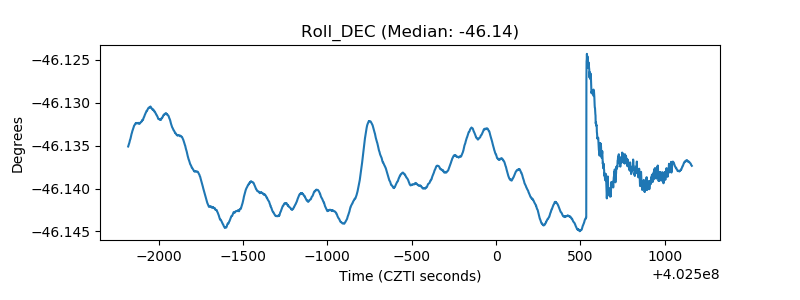 |
| _Roll_RA | 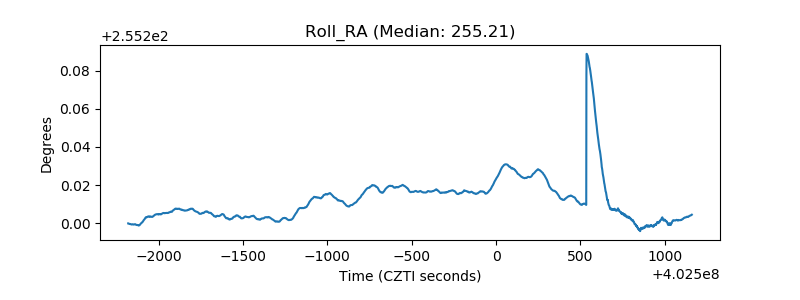 |
| Veto Counter | 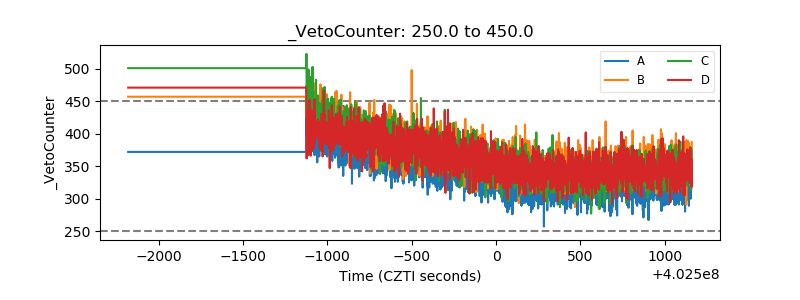 |