| Param | Original file | Final file |
|---|---|---|
| Filename | modeM0/AS1A11_082T01_9000005356_37930cztM0_level2.evt | modeM0/AS1A11_082T01_9000005356_37930cztM0_level2_quad_clean.evt |
| Size (bytes) | 245,946,240 | 28,607,040 |
| Size | 234.6 MB | 27.3 MB |
| Events in quadrant A | 1,548,255 | 164,569 |
| Events in quadrant B | 1,761,063 | 164,562 |
| Events in quadrant C | 1,556,196 | 166,676 |
| Events in quadrant D | 2,379,112 | 157,721 |
| Mode M0 | |||
|---|---|---|---|
| Quadrant | BADHDUFLAG | Total packets | Discarded packets |
| A | 0 | 6355 | 2 |
| B | 0 | 7093 | 1 |
| C | 0 | 6385 | 1 |
| D | 0 | 9086 | 1 |
| Mode SS | |||
|---|---|---|---|
| Quadrant | BADHDUFLAG | Total packets | Discarded packets |
| A | 0 | 62 | 0 |
| B | 0 | 62 | 0 |
| C | 0 | 62 | 0 |
| D | 0 | 62 | 0 |
| Mode M9 | |||
|---|---|---|---|
| Quadrant | BADHDUFLAG | Total packets | Discarded packets |
| A | 0 | 15 | 0 |
| B | 0 | 15 | 0 |
| C | 0 | 15 | 0 |
| D | 0 | 15 | 0 |
| Quadrant | Total seconds | Saturated seconds | Saturation percentage |
|---|---|---|---|
| A | 2973 | 6 | 0.201816% |
| B | 2973 | 51 | 1.715439% |
| C | 2973 | 14 | 0.470905% |
| D | 2973 | 337 | 11.335351% |
Noise dominated data is calculated using 1-second bins in cleaned event files. If a bin has >2000 counts, and if more than 50% of those come from <1% of pixels, then it is considered to be noise-dominated and hence unusable.
| Quadrant | # 1 sec bins | Bins with >0 counts | Bins with >2000 counts | High rate bins dominated by noise | Noise dominated (total time) | Noise dominated (detector-on time) | Marked lightcurve |
|---|---|---|---|---|---|---|---|
| A | 4496 | 2974 | 2 | 2 | 0.04% | 0.07% | 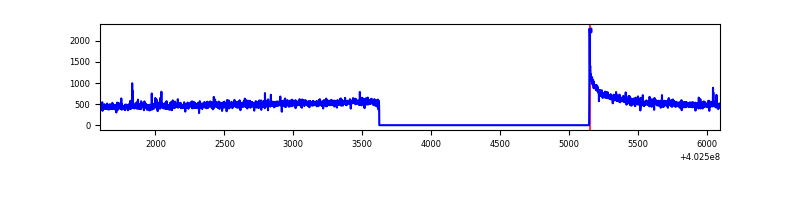 |
| B | 4496 | 2974 | 34 | 34 | 0.76% | 1.14% | 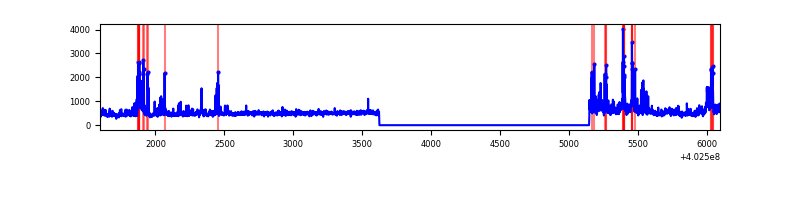 |
| C | 4496 | 2974 | 9 | 9 | 0.20% | 0.30% | 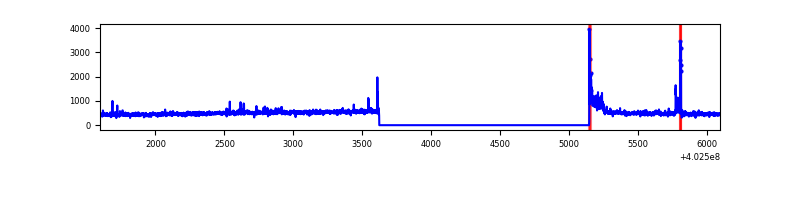 |
| D | 4496 | 2974 | 307 | 307 | 6.83% | 10.32% | 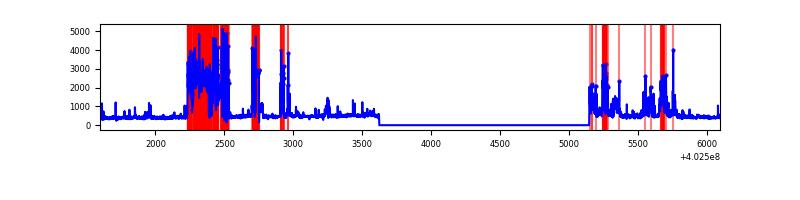 |
Top three noisy pixels from each quadrant. If the there are fewer than three noisy pixels in the level2.evt file, extra rows are filled as -1
| Pixel properties | Quadrant properties | ||||||
|---|---|---|---|---|---|---|---|
| Quadrant | DetID | PixID | Counts | Sigma | Mean | Median | Sigma |
| A | 10 | 83 | 199592 | 2781.2 | 341 | 334 | 71.6 |
| A | 12 | 189 | 12392 | 168.3 | 341 | 334 | 71.6 |
| A | 13 | 248 | 8930 | 119.98 | 341 | 334 | 71.6 |
| B | 5 | 172 | 152411 | 2304.13 | 340 | 331 | 66.0 |
| B | 4 | 81 | 86929 | 1312.03 | 340 | 331 | 66.0 |
| B | 0 | 229 | 80045 | 1207.73 | 340 | 331 | 66.0 |
| C | 15 | 214 | 124632 | 1587.6 | 335 | 335 | 78.3 |
| C | 0 | 10 | 68753 | 873.88 | 335 | 335 | 78.3 |
| C | 14 | 254 | 42588 | 539.68 | 335 | 335 | 78.3 |
| D | 12 | 227 | 1017824 | 13220.52 | 314 | 304 | 77.0 |
| D | 12 | 233 | 41260 | 532.14 | 314 | 304 | 77.0 |
| D | 10 | 199 | 37652 | 485.26 | 314 | 304 | 77.0 |
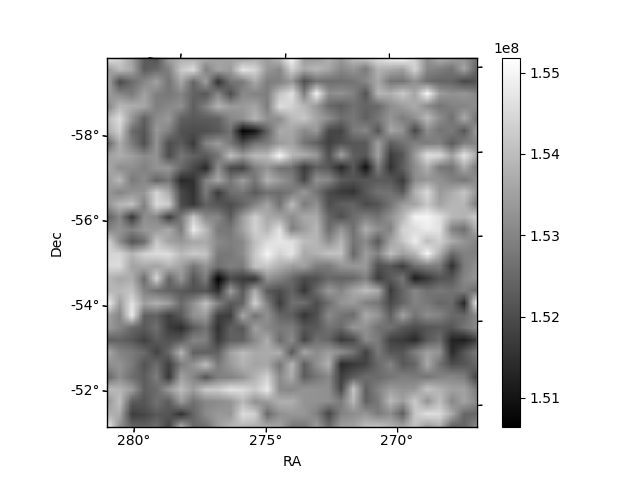
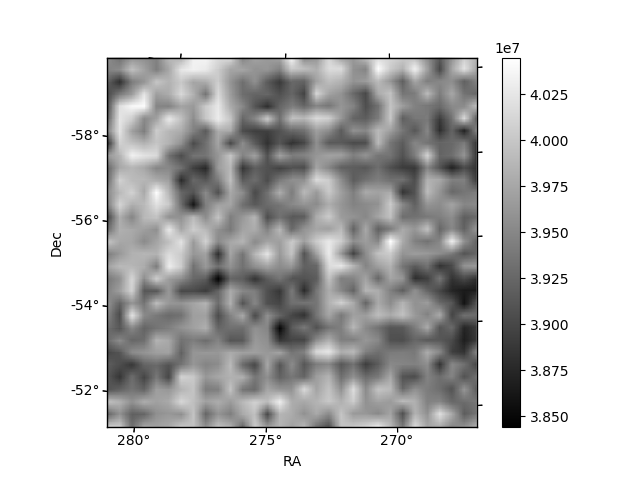
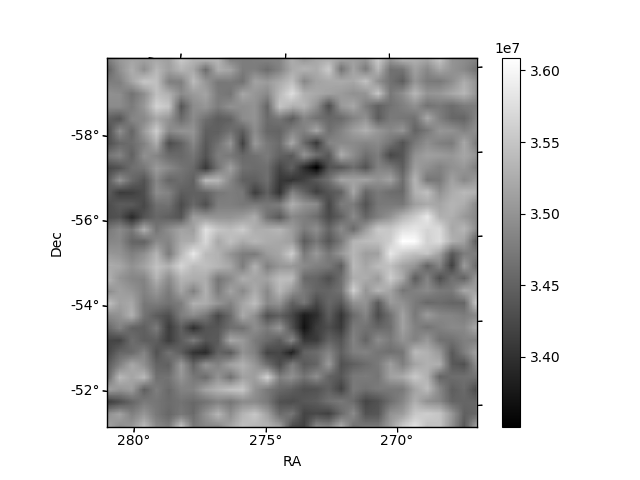
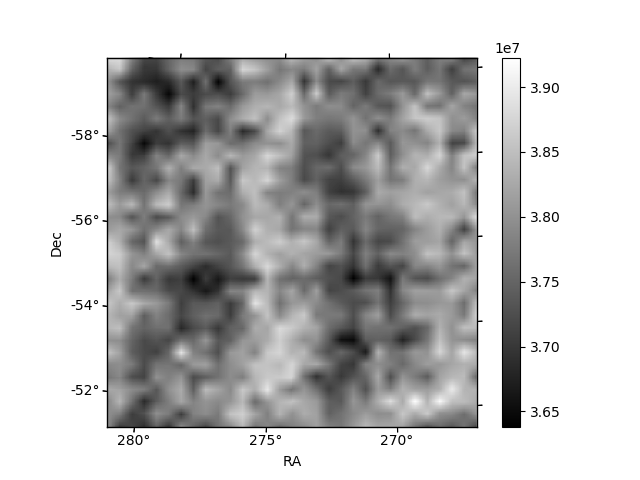
Histogram calculated using DETX and DETY for each event in the final _common_clean file
| Quadrant A | 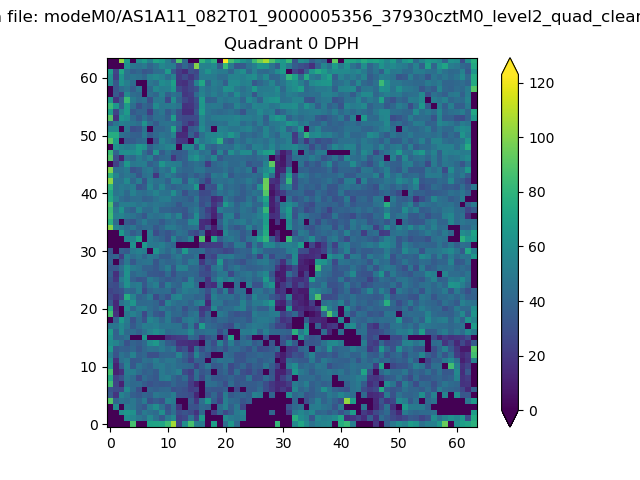 |
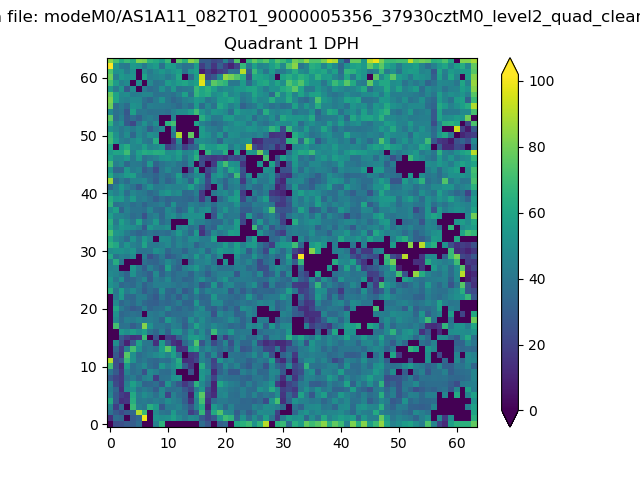 |
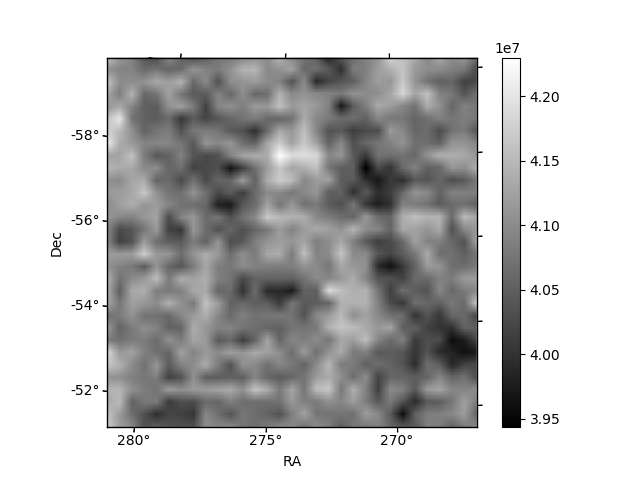
Quadrant B |
|---|---|---|---|
| Quadrant D | 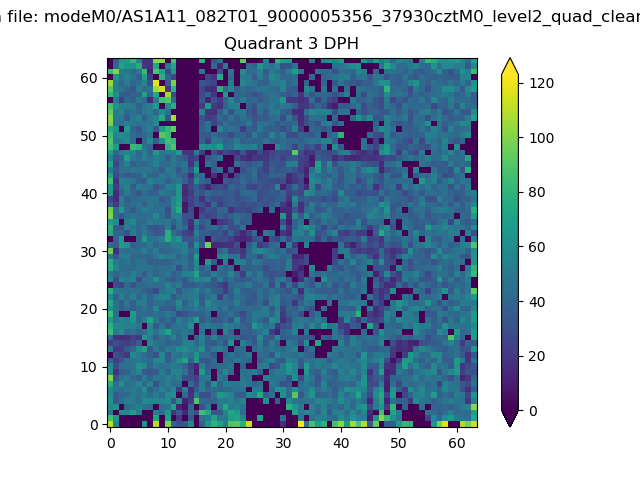 |
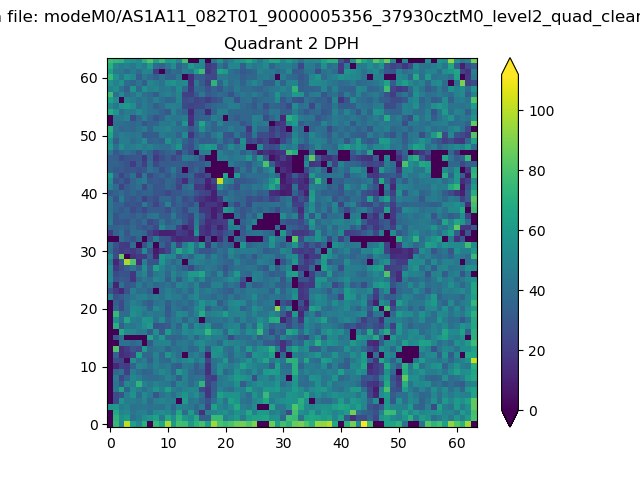 |
Quadrant C |
| Plot type | Count rate plots | Images |
|---|---|---|
| Comparison with Poisson distribution Blue bars denote a histogram of data divided into 1 sec bins. Red curve is a Poisson curve with rate = median count rate of data. |
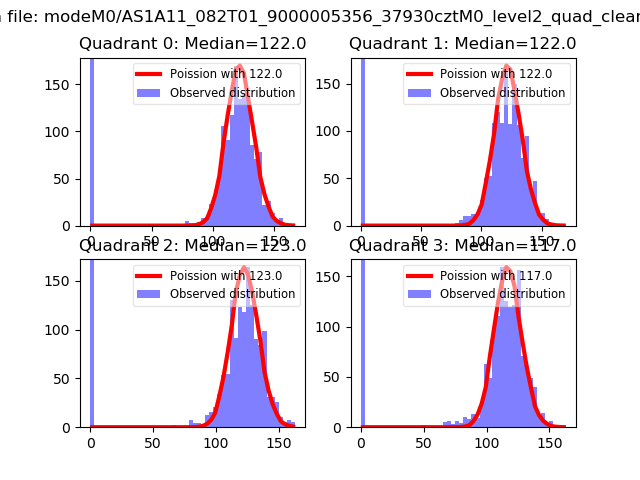 |
 |
| Quadrant-wise count rates Data is divided into 100 sec bins |
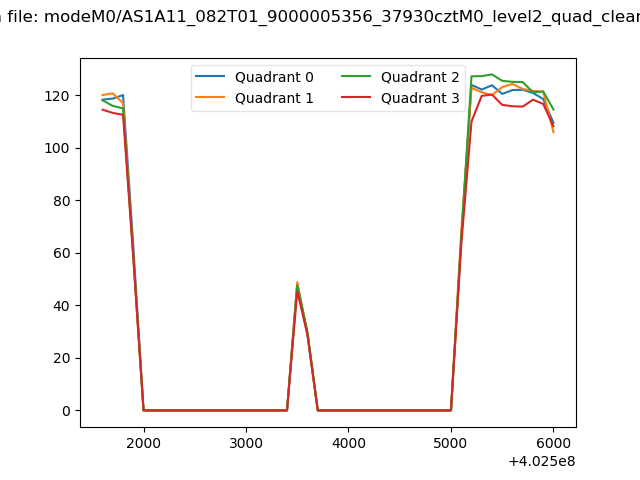 |
|
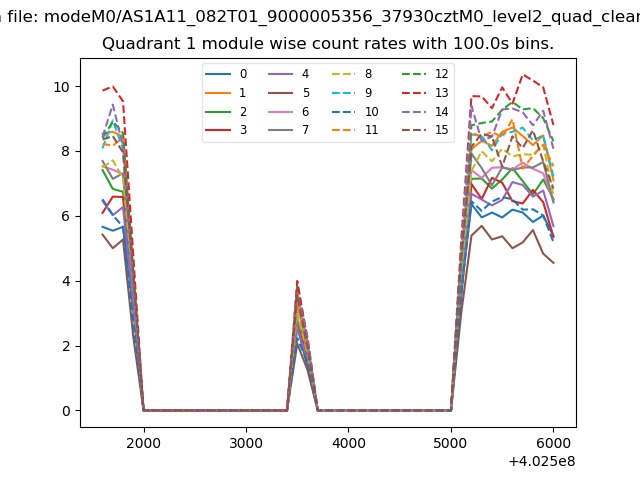
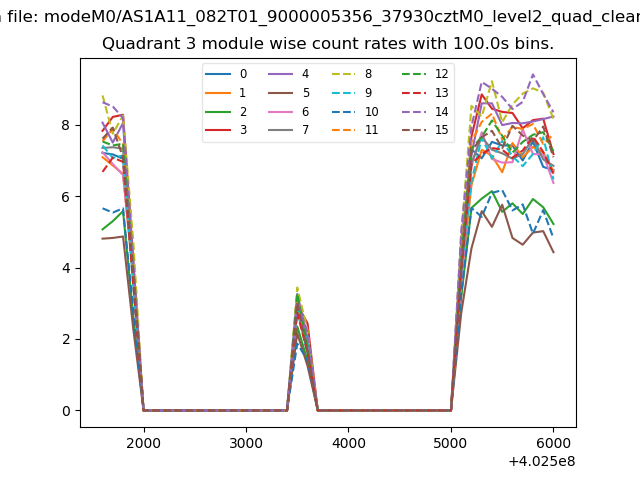
| Module-wise count rates for Quadrant A Data is divided into 100 sec bins |
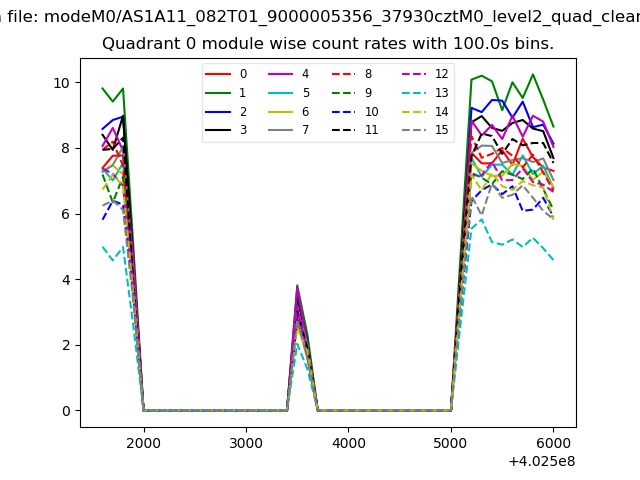 |
 |
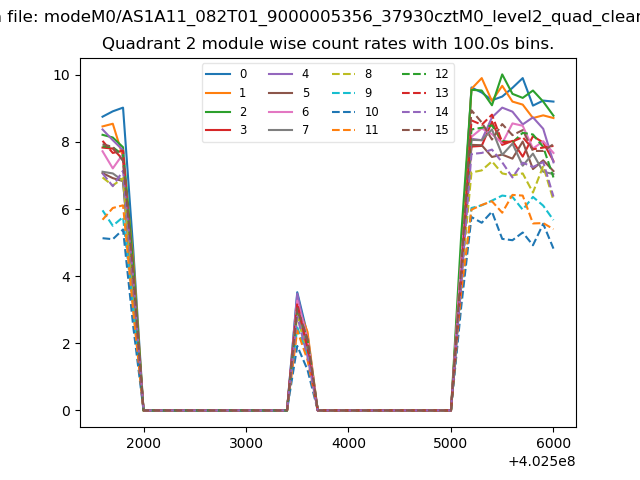
| Module-wise count rates for Quadrant B Data is divided into 100 sec bins |
 |
 |
| Module-wise count rates for Quadrant C Data is divided into 100 sec bins |
 |
 |
| Module-wise count rates for Quadrant D Data is divided into 100 sec bins |
 |
 |
| Parameter | Plot |
|---|---|
| CZT HV Monitor | 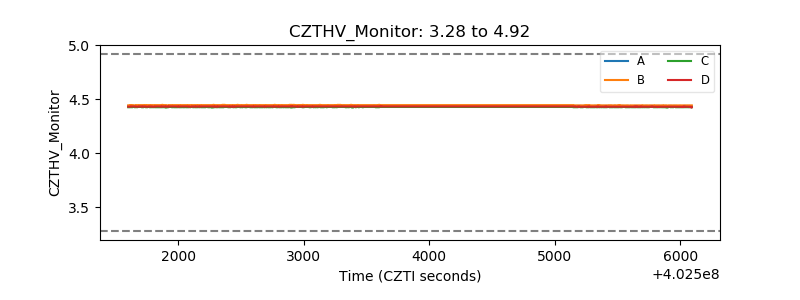 |
| D_VDD | 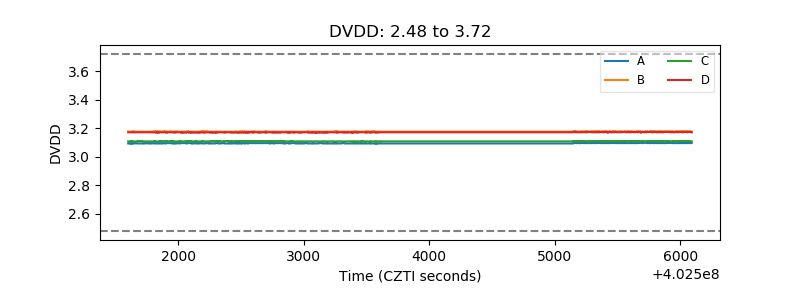 |
| Temperature 1 | 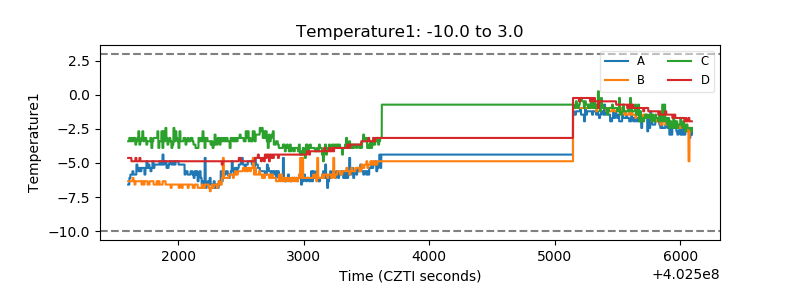 |
| Veto HV Monitor |  |
| Veto LLD | 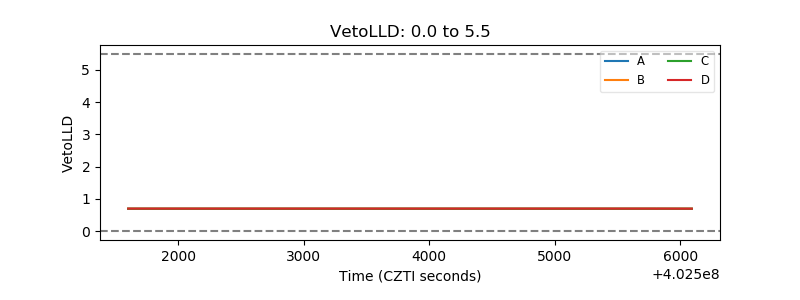 |
| Alpha Counter | 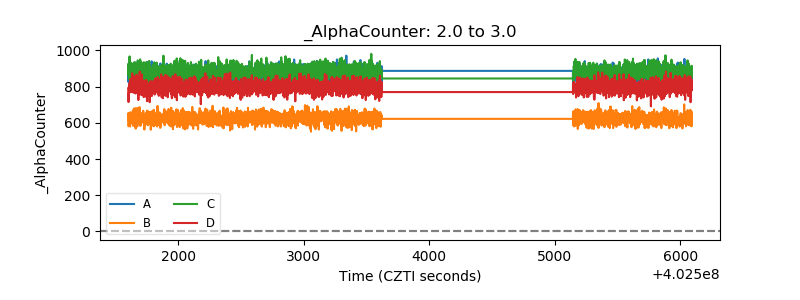 |
| _CPM_Rate | 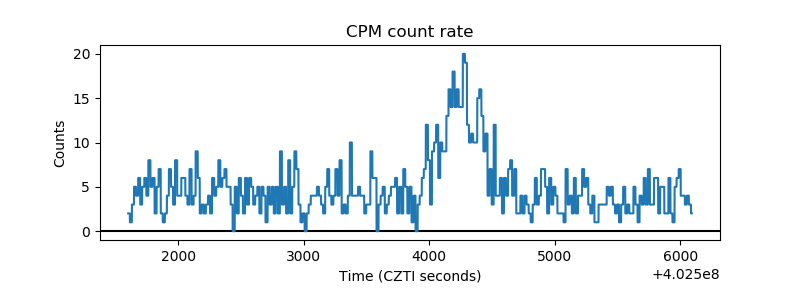 |
| CZT Counter | 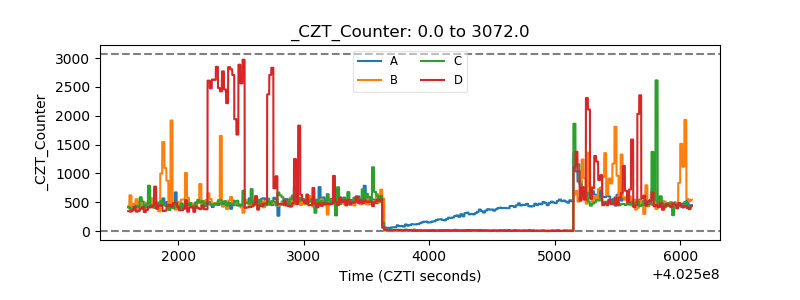 |
| +2.5 Volts monitor | 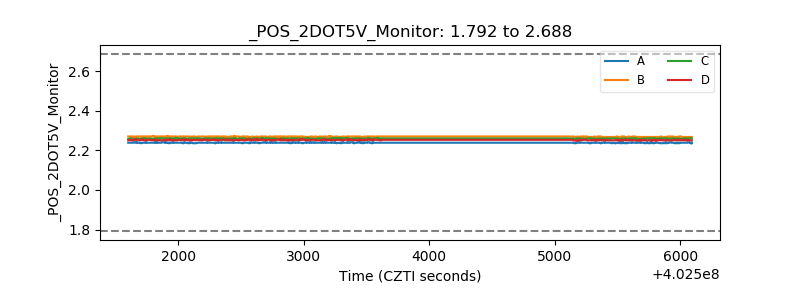 |
| +5 Volts monitor | 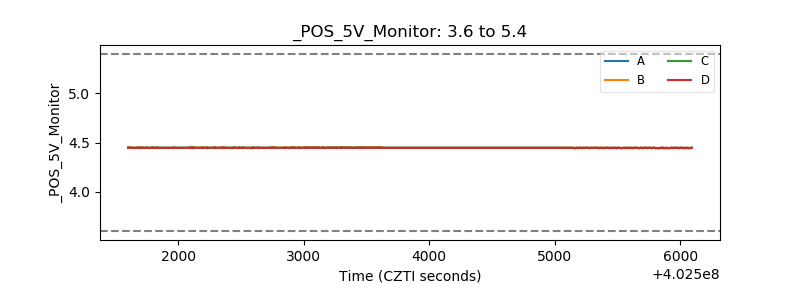 |
| _ROLL_ROT | 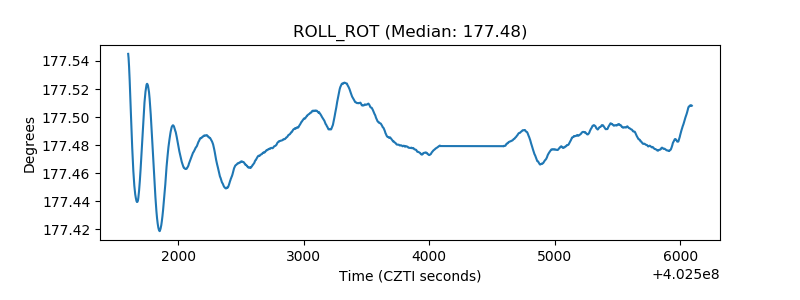 |
| _Roll_DEC | 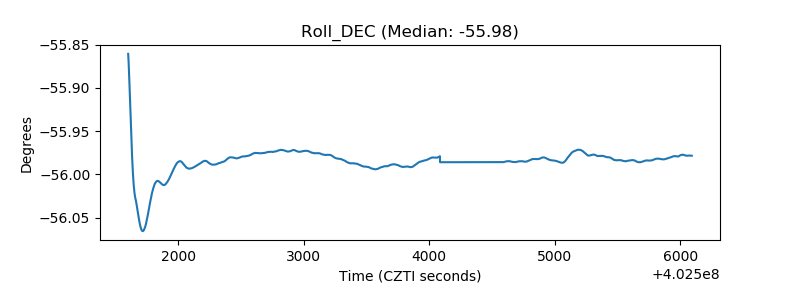 |
| _Roll_RA | 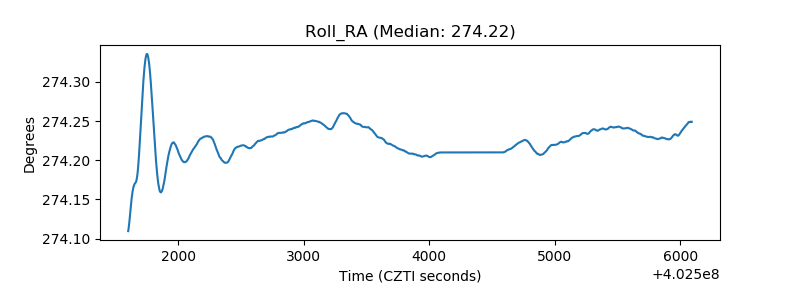 |
| Veto Counter | 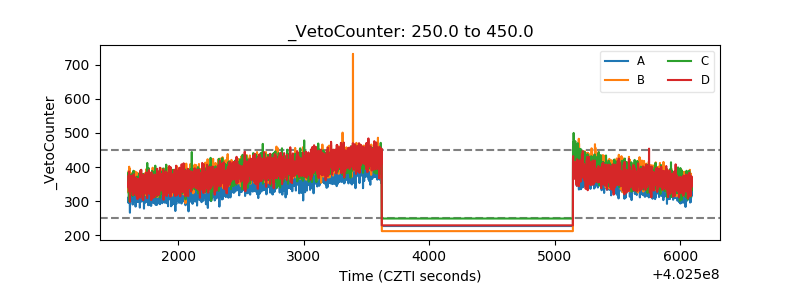 |