| Param | Original file | Final file |
|---|---|---|
| Filename | modeM0/AS1A11_082T01_9000005356_37931cztM0_level2.evt | modeM0/AS1A11_082T01_9000005356_37931cztM0_level2_quad_clean.evt |
| Size (bytes) | 489,856,320 | 72,593,280 |
| Size | 467.2 MB | 69.2 MB |
| Events in quadrant A | 3,021,096 | 472,587 |
| Events in quadrant B | 3,845,064 | 461,103 |
| Events in quadrant C | 2,865,950 | 469,921 |
| Events in quadrant D | 4,707,224 | 386,415 |
| Mode M0 | |||
|---|---|---|---|
| Quadrant | BADHDUFLAG | Total packets | Discarded packets |
| A | 0 | 12636 | 3 |
| B | 0 | 15355 | 2 |
| C | 0 | 12252 | 2 |
| D | 0 | 18013 | 2 |
| Mode SS | |||
|---|---|---|---|
| Quadrant | BADHDUFLAG | Total packets | Discarded packets |
| A | 0 | 118 | 0 |
| B | 0 | 118 | 0 |
| C | 0 | 118 | 0 |
| D | 0 | 118 | 0 |
| Mode M9 | |||
|---|---|---|---|
| Quadrant | BADHDUFLAG | Total packets | Discarded packets |
| A | 0 | 18 | 0 |
| B | 0 | 18 | 0 |
| C | 0 | 18 | 0 |
| D | 0 | 19 | 0 |
| Quadrant | Total seconds | Saturated seconds | Saturation percentage |
|---|---|---|---|
| A | 5837 | 16 | 0.274113% |
| B | 5837 | 248 | 4.248758% |
| C | 5837 | 22 | 0.376906% |
| D | 5837 | 564 | 9.662498% |
Noise dominated data is calculated using 1-second bins in cleaned event files. If a bin has >2000 counts, and if more than 50% of those come from <1% of pixels, then it is considered to be noise-dominated and hence unusable.
| Quadrant | # 1 sec bins | Bins with >0 counts | Bins with >2000 counts | High rate bins dominated by noise | Noise dominated (total time) | Noise dominated (detector-on time) | Marked lightcurve |
|---|---|---|---|---|---|---|---|
| A | 7150 | 5838 | 6 | 6 | 0.08% | 0.10% | 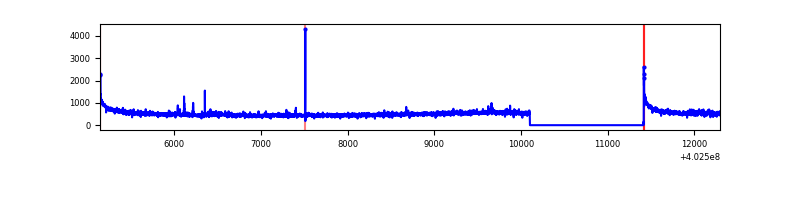 |
| B | 7150 | 5838 | 149 | 149 | 2.08% | 2.55% | 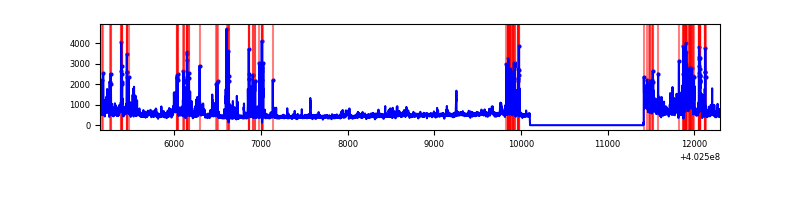 |
| C | 7150 | 5838 | 12 | 12 | 0.17% | 0.21% | 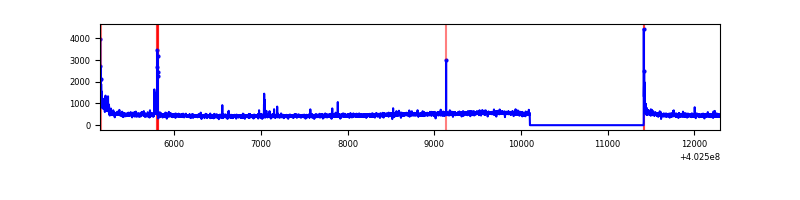 |
| D | 7150 | 5838 | 586 | 586 | 8.20% | 10.04% | 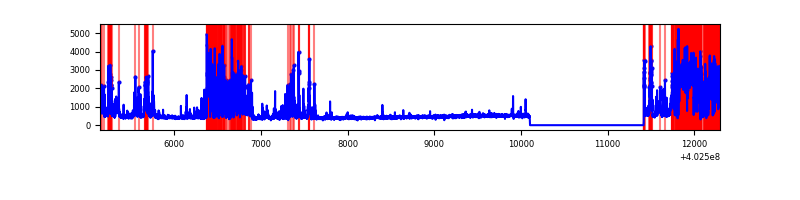 |
Top three noisy pixels from each quadrant. If the there are fewer than three noisy pixels in the level2.evt file, extra rows are filled as -1
| Pixel properties | Quadrant properties | ||||||
|---|---|---|---|---|---|---|---|
| Quadrant | DetID | PixID | Counts | Sigma | Mean | Median | Sigma |
| A | 10 | 83 | 406554 | 3074.72 | 648 | 634 | 132.0 |
| A | 15 | 222 | 41160 | 306.97 | 648 | 634 | 132.0 |
| A | 12 | 189 | 31780 | 235.92 | 648 | 634 | 132.0 |
| B | 5 | 172 | 617217 | 5055.93 | 636 | 620 | 122.0 |
| B | 0 | 229 | 176636 | 1443.28 | 636 | 620 | 122.0 |
| B | 4 | 171 | 157143 | 1283.45 | 636 | 620 | 122.0 |
| C | 15 | 214 | 245092 | 1655.51 | 630 | 633 | 147.7 |
| C | 0 | 10 | 104060 | 700.42 | 630 | 633 | 147.7 |
| C | 14 | 254 | 43461 | 290.04 | 630 | 633 | 147.7 |
| D | 12 | 227 | 1348377 | 9163.56 | 606 | 589 | 147.1 |
| D | 12 | 233 | 724926 | 4924.74 | 606 | 589 | 147.1 |
| D | 2 | 250 | 66014 | 444.82 | 606 | 589 | 147.1 |
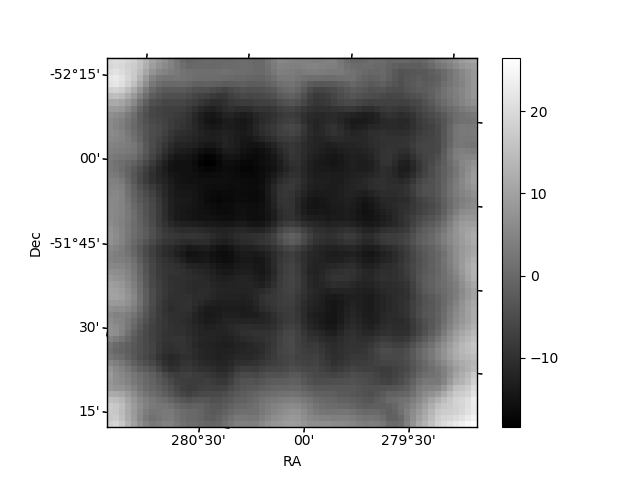
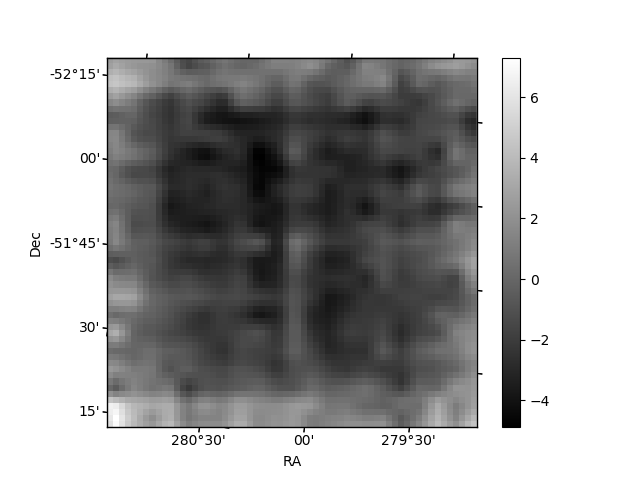
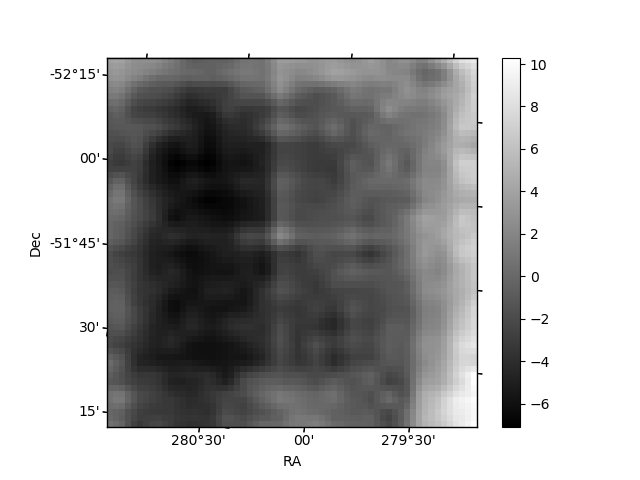
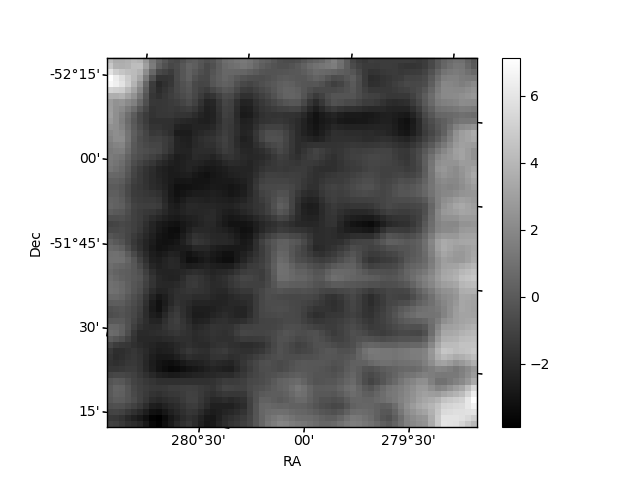
Histogram calculated using DETX and DETY for each event in the final _common_clean file
| Quadrant A | 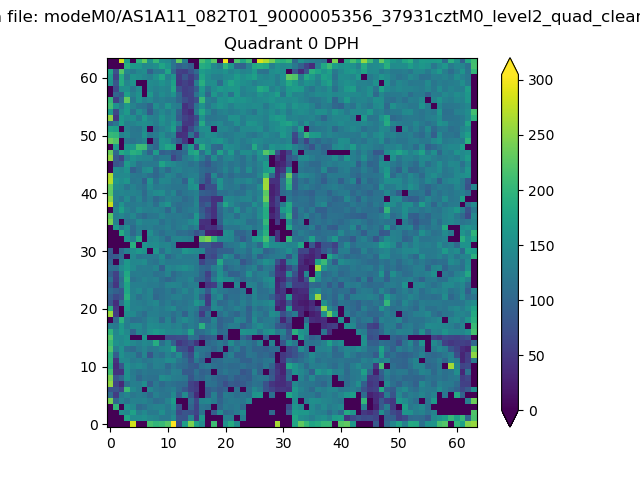 |
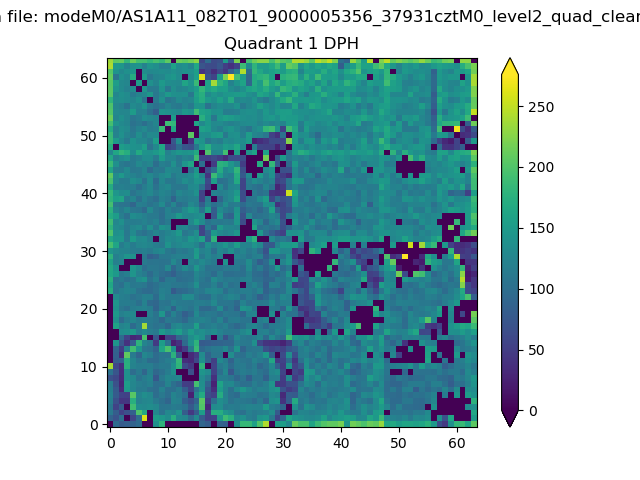 |
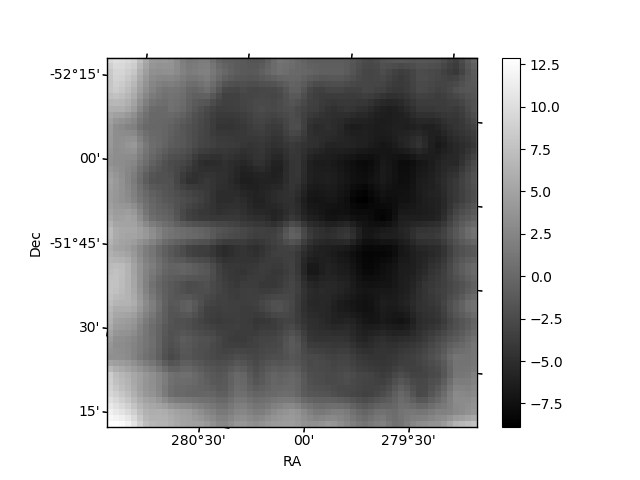
Quadrant B |
|---|---|---|---|
| Quadrant D | 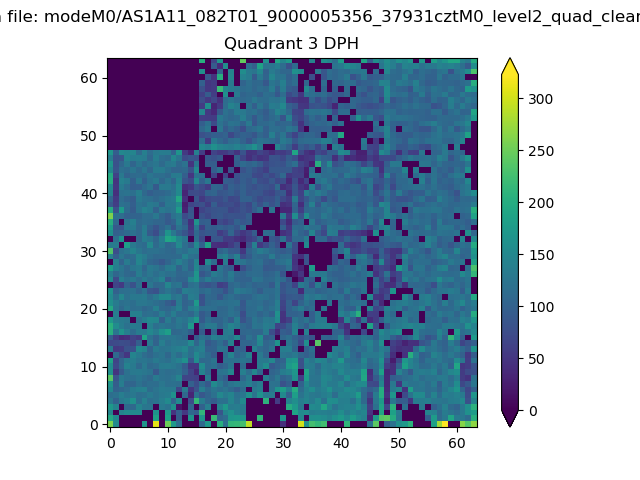 |
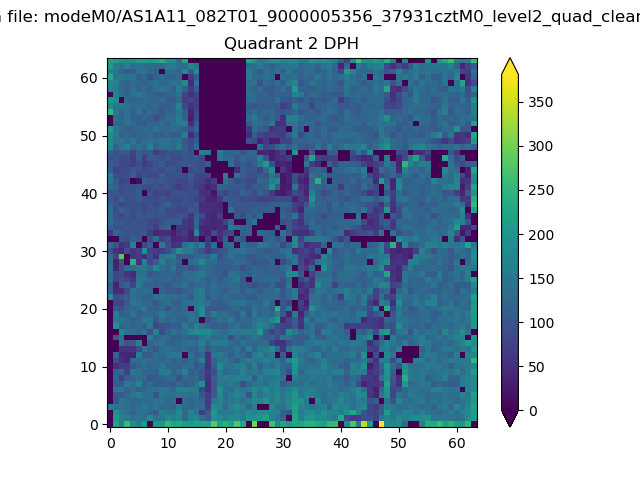 |
Quadrant C |
| Plot type | Count rate plots | Images |
|---|---|---|
| Comparison with Poisson distribution Blue bars denote a histogram of data divided into 1 sec bins. Red curve is a Poisson curve with rate = median count rate of data. |
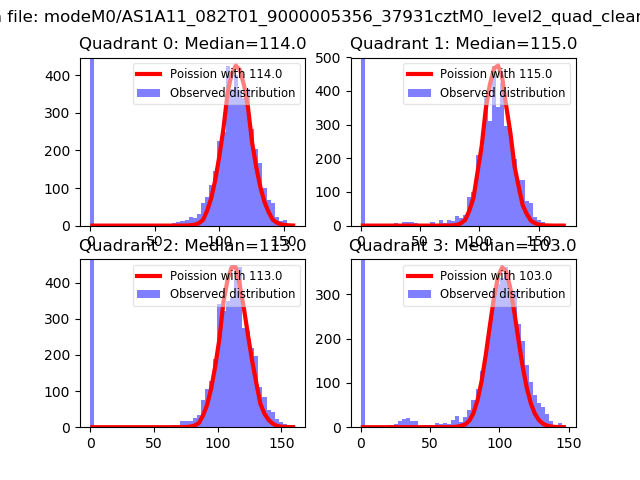 |
 |
| Quadrant-wise count rates Data is divided into 100 sec bins |
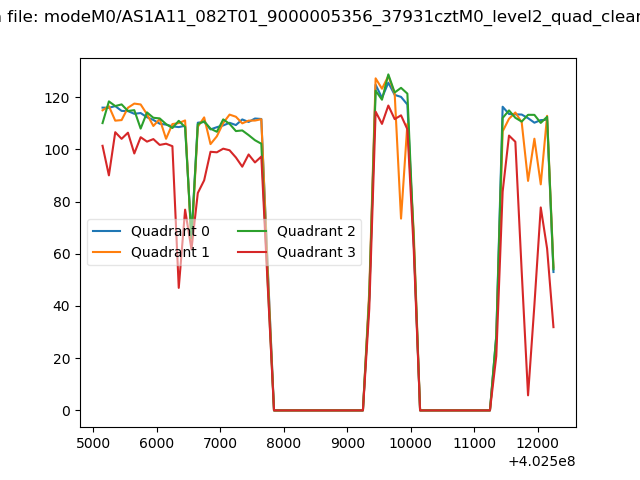 |
|
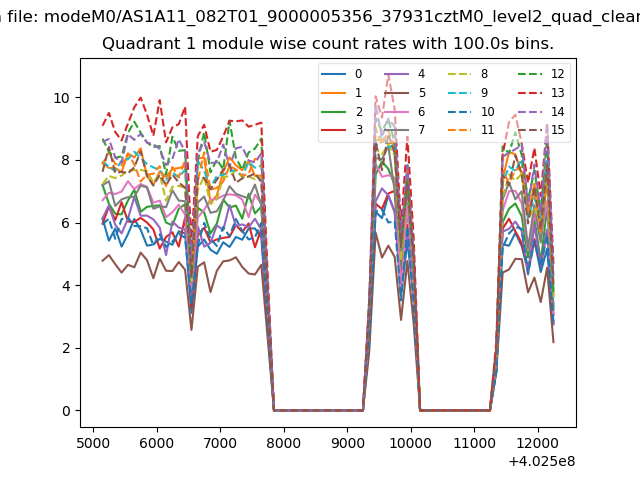
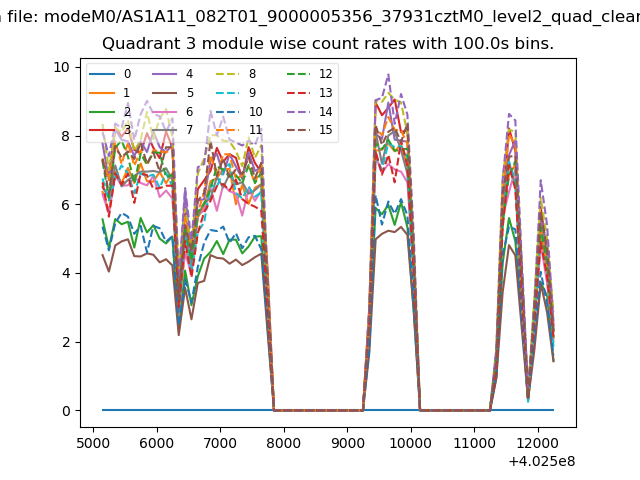
| Module-wise count rates for Quadrant A Data is divided into 100 sec bins |
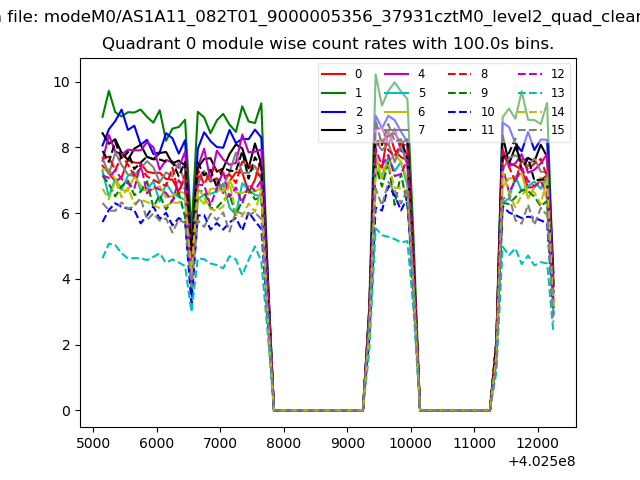 |
 |
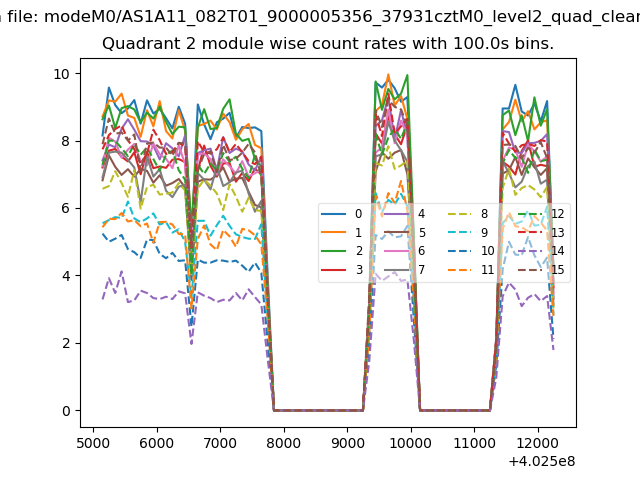
| Module-wise count rates for Quadrant B Data is divided into 100 sec bins |
 |
 |
| Module-wise count rates for Quadrant C Data is divided into 100 sec bins |
 |
 |
| Module-wise count rates for Quadrant D Data is divided into 100 sec bins |
 |
 |
| Parameter | Plot |
|---|---|
| CZT HV Monitor | 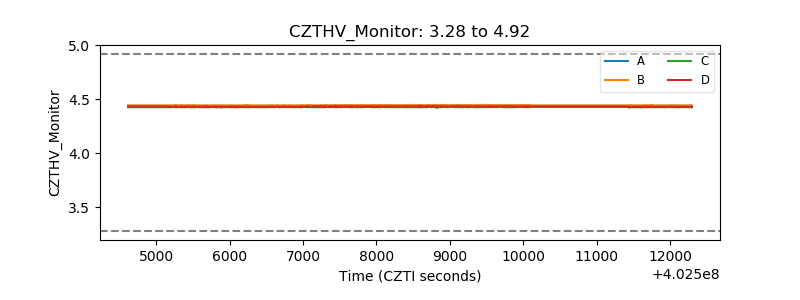 |
| D_VDD | 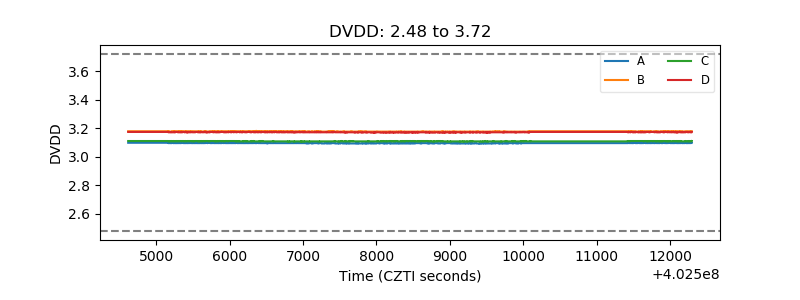 |
| Temperature 1 | 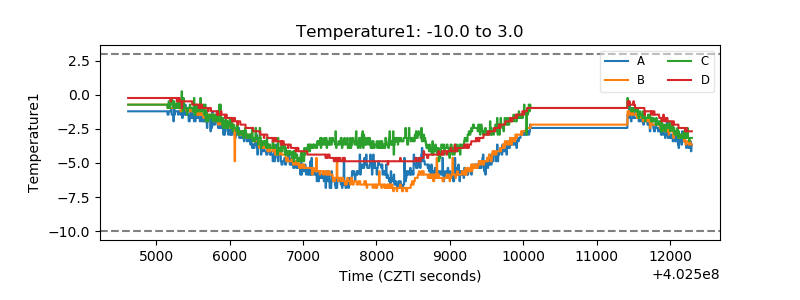 |
| Veto HV Monitor | 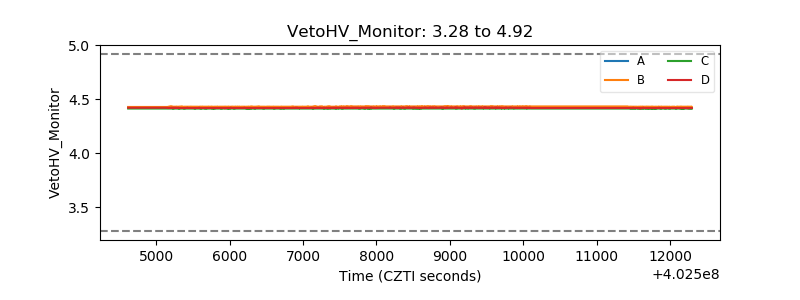 |
| Veto LLD | 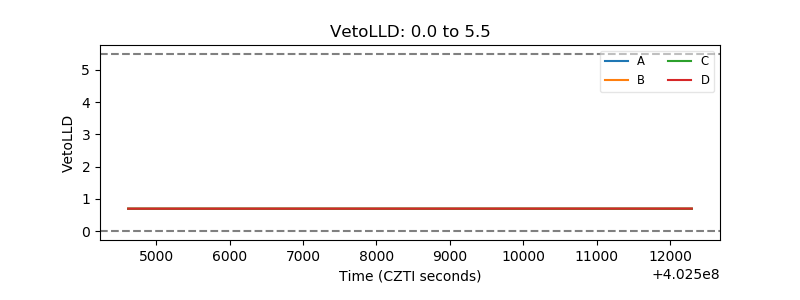 |
| Alpha Counter | 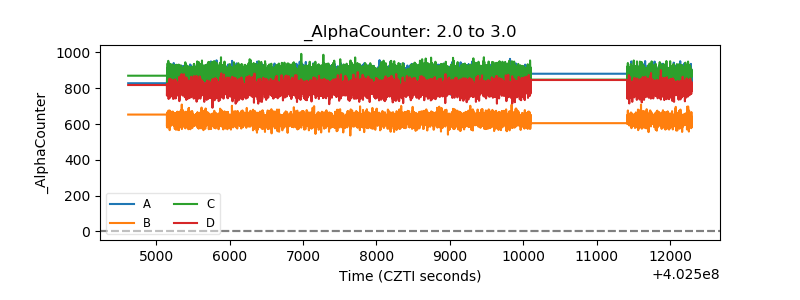 |
| _CPM_Rate | 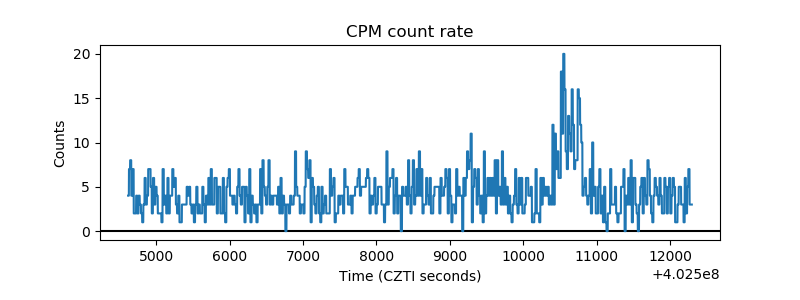 |
| CZT Counter | 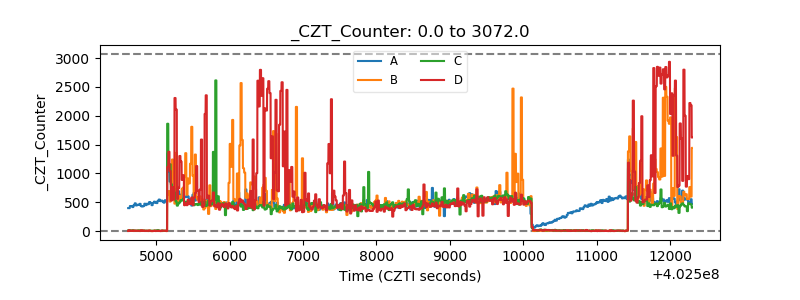 |
| +2.5 Volts monitor | 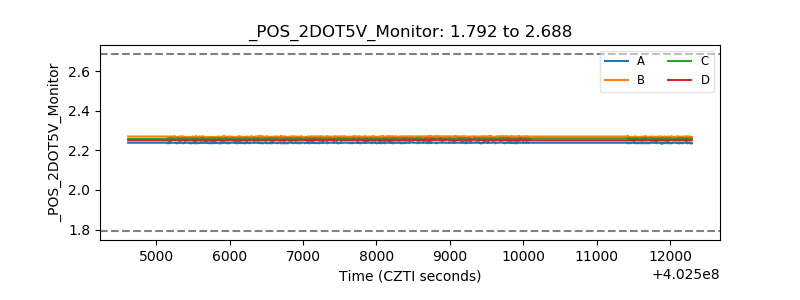 |
| +5 Volts monitor | 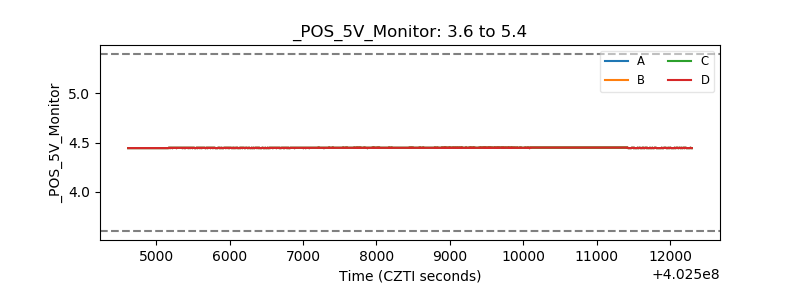 |
| _ROLL_ROT | 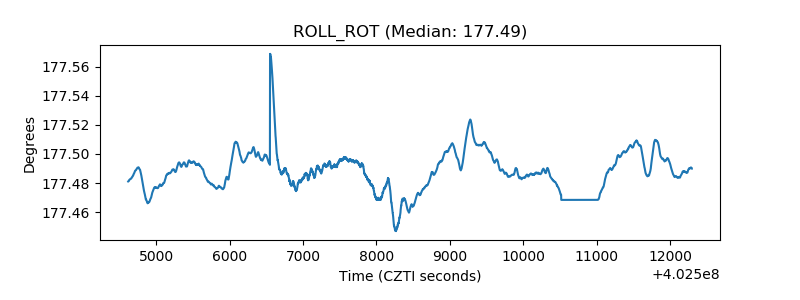 |
| _Roll_DEC | 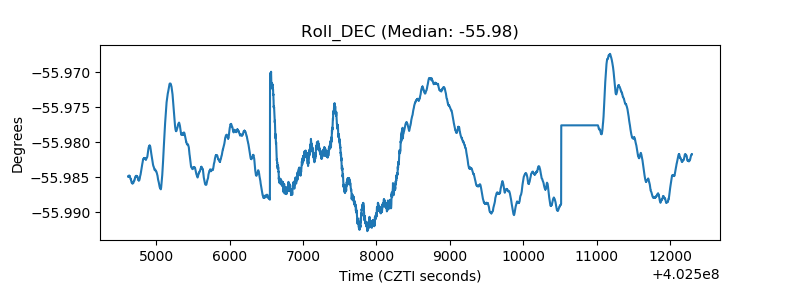 |
| _Roll_RA | 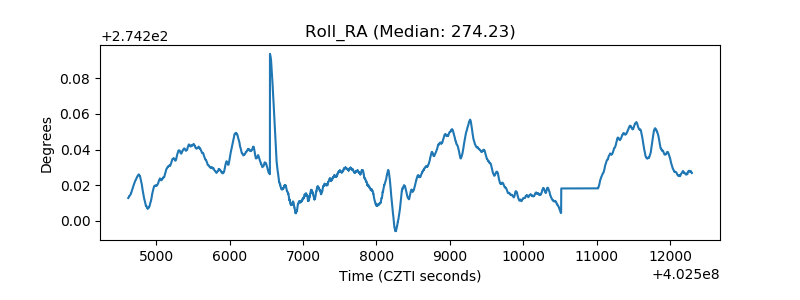 |
| Veto Counter | 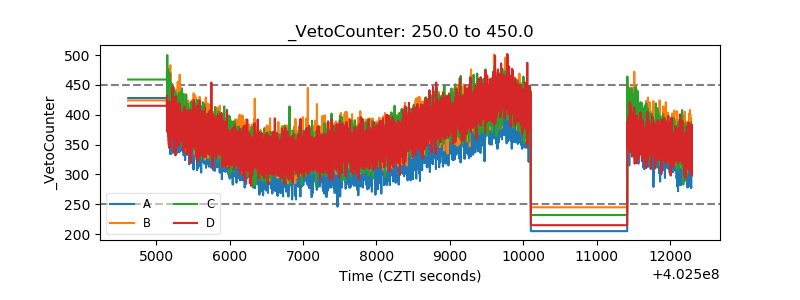 |