| Param | Original file | Final file |
|---|---|---|
| Filename | modeM0/AS1A11_082T01_9000005356_37932cztM0_level2.evt | modeM0/AS1A11_082T01_9000005356_37932cztM0_level2_quad_clean.evt |
| Size (bytes) | 578,413,440 | 71,784,000 |
| Size | 551.6 MB | 68.5 MB |
| Events in quadrant A | 3,800,190 | 458,216 |
| Events in quadrant B | 3,986,710 | 467,894 |
| Events in quadrant C | 2,888,696 | 476,322 |
| Events in quadrant D | 6,439,812 | 356,076 |
| Mode M0 | |||
|---|---|---|---|
| Quadrant | BADHDUFLAG | Total packets | Discarded packets |
| A | 0 | 15037 | 3 |
| B | 0 | 15837 | 2 |
| C | 0 | 12421 | 2 |
| D | 0 | 23303 | 2 |
| Mode SS | |||
|---|---|---|---|
| Quadrant | BADHDUFLAG | Total packets | Discarded packets |
| A | 0 | 122 | 0 |
| B | 0 | 122 | 0 |
| C | 0 | 122 | 0 |
| D | 0 | 122 | 0 |
| Mode M9 | |||
|---|---|---|---|
| Quadrant | BADHDUFLAG | Total packets | Discarded packets |
| A | 0 | 16 | 0 |
| B | 0 | 16 | 0 |
| C | 0 | 16 | 0 |
| D | 0 | 17 | 0 |
| Quadrant | Total seconds | Saturated seconds | Saturation percentage |
|---|---|---|---|
| A | 5932 | 211 | 3.556979% |
| B | 5932 | 261 | 4.399865% |
| C | 5932 | 18 | 0.303439% |
| D | 5932 | 1005 | 16.942009% |
Noise dominated data is calculated using 1-second bins in cleaned event files. If a bin has >2000 counts, and if more than 50% of those come from <1% of pixels, then it is considered to be noise-dominated and hence unusable.
| Quadrant | # 1 sec bins | Bins with >0 counts | Bins with >2000 counts | High rate bins dominated by noise | Noise dominated (total time) | Noise dominated (detector-on time) | Marked lightcurve |
|---|---|---|---|---|---|---|---|
| A | 7215 | 5933 | 195 | 195 | 2.70% | 3.29% | 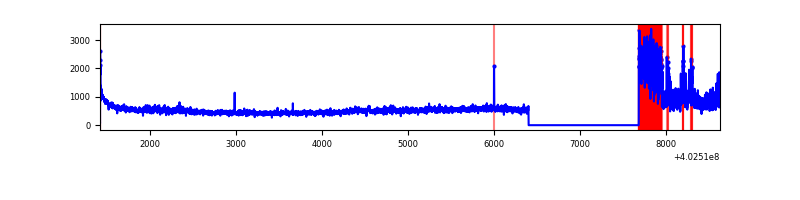 |
| B | 7215 | 5933 | 149 | 149 | 2.07% | 2.51% | 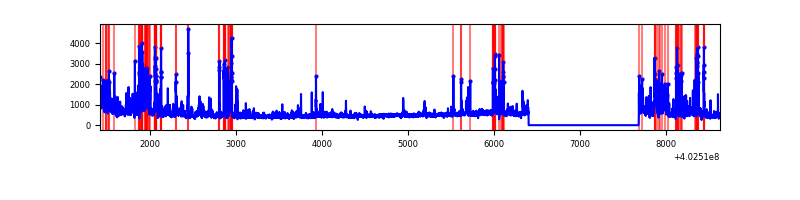 |
| C | 7215 | 5933 | 14 | 14 | 0.19% | 0.24% | 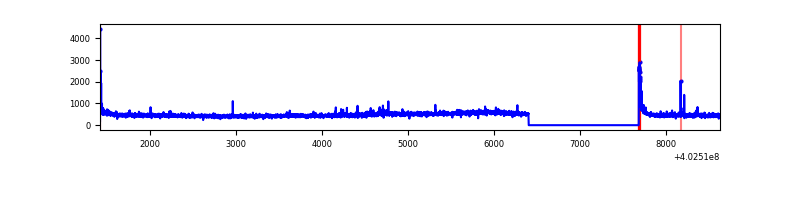 |
| D | 7215 | 5933 | 1034 | 1034 | 14.33% | 17.43% | 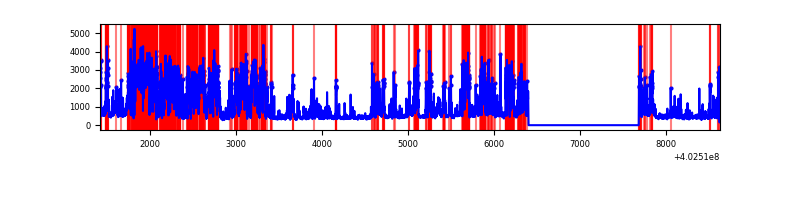 |
Top three noisy pixels from each quadrant. If the there are fewer than three noisy pixels in the level2.evt file, extra rows are filled as -1
| Pixel properties | Quadrant properties | ||||||
|---|---|---|---|---|---|---|---|
| Quadrant | DetID | PixID | Counts | Sigma | Mean | Median | Sigma |
| A | 15 | 222 | 834143 | 6301.95 | 649 | 636 | 132.3 |
| A | 10 | 83 | 388302 | 2931.05 | 649 | 636 | 132.3 |
| A | 12 | 189 | 33228 | 246.42 | 649 | 636 | 132.3 |
| B | 5 | 172 | 429947 | 3451.43 | 648 | 629 | 124.4 |
| B | 4 | 171 | 305981 | 2454.82 | 648 | 629 | 124.4 |
| B | 0 | 229 | 256363 | 2055.93 | 648 | 629 | 124.4 |
| C | 15 | 214 | 248875 | 1662.47 | 638 | 641 | 149.3 |
| C | 0 | 10 | 99957 | 665.14 | 638 | 641 | 149.3 |
| C | 14 | 254 | 32180 | 211.22 | 638 | 641 | 149.3 |
| D | 12 | 227 | 3583074 | 24638.11 | 597 | 581 | 145.4 |
| D | 10 | 253 | 134665 | 922.14 | 597 | 581 | 145.4 |
| D | 12 | 233 | 129252 | 884.91 | 597 | 581 | 145.4 |
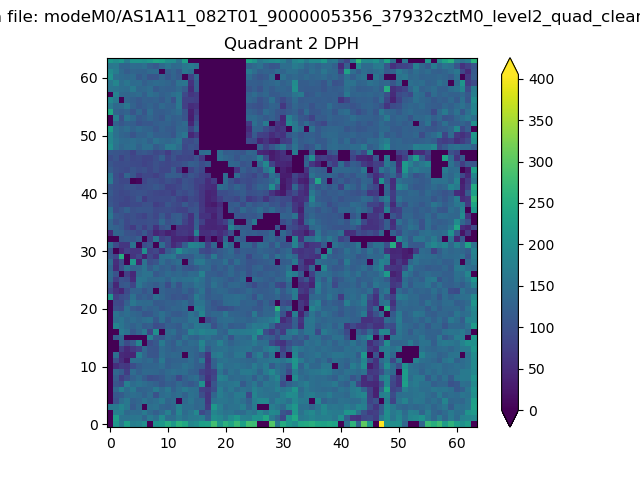
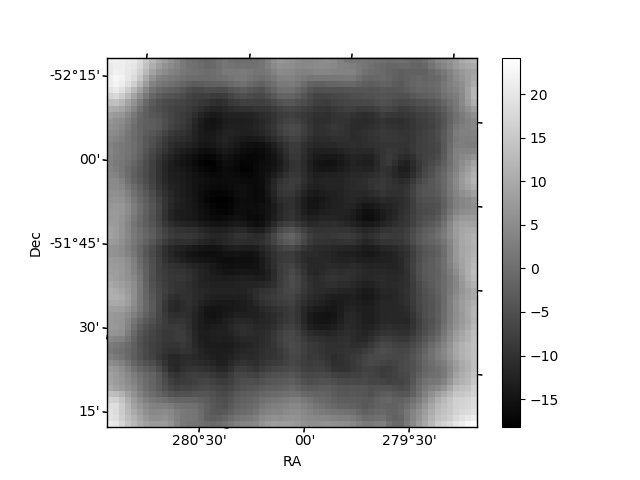
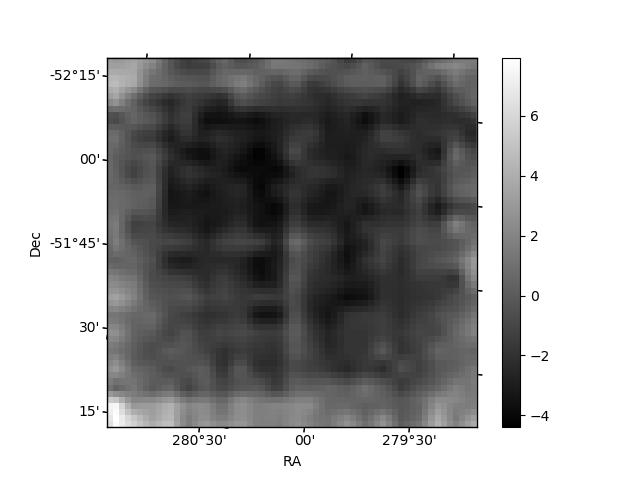
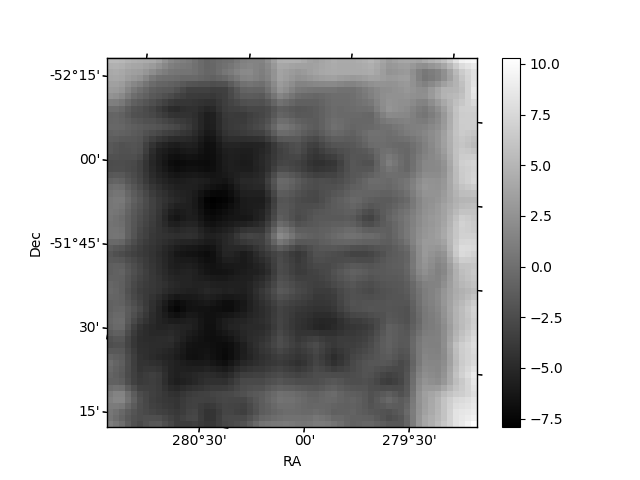
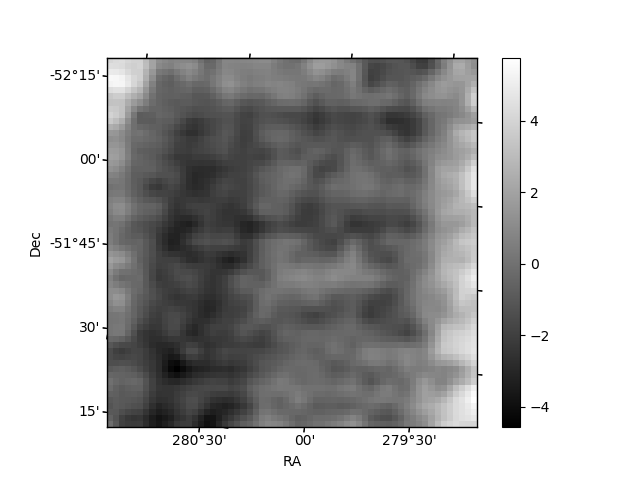
Histogram calculated using DETX and DETY for each event in the final _common_clean file
| Quadrant A | 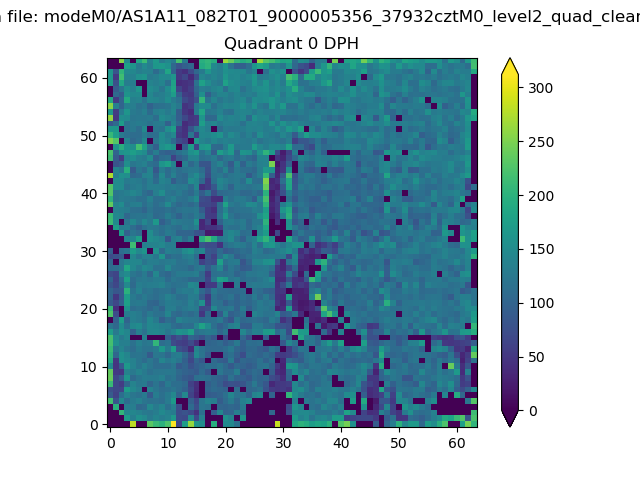 |
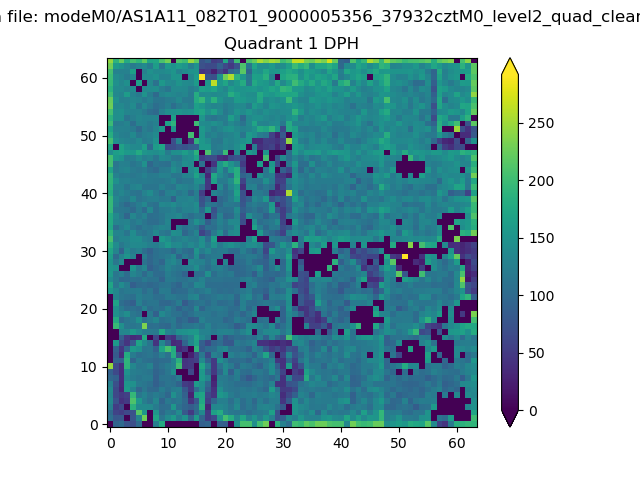 |
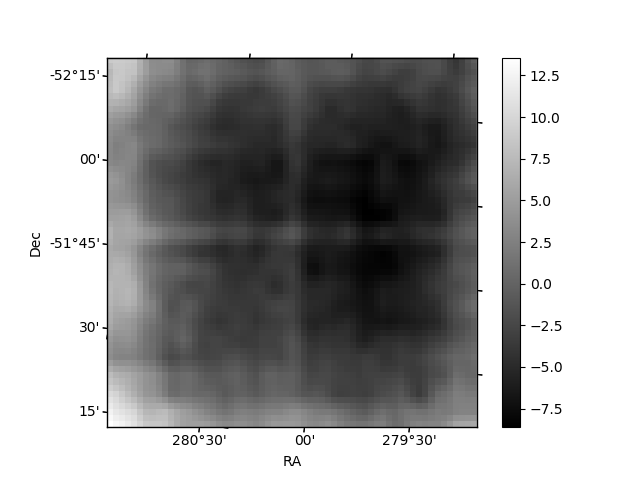
Quadrant B |
|---|---|---|---|
| Quadrant D | 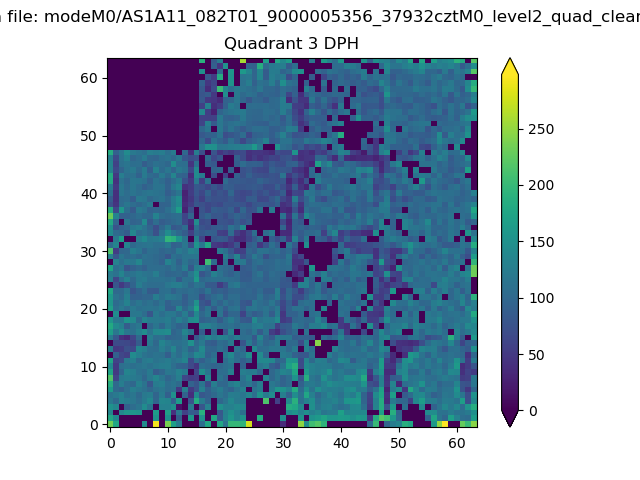 |
 |
Quadrant C |
| Plot type | Count rate plots | Images |
|---|---|---|
| Comparison with Poisson distribution Blue bars denote a histogram of data divided into 1 sec bins. Red curve is a Poisson curve with rate = median count rate of data. |
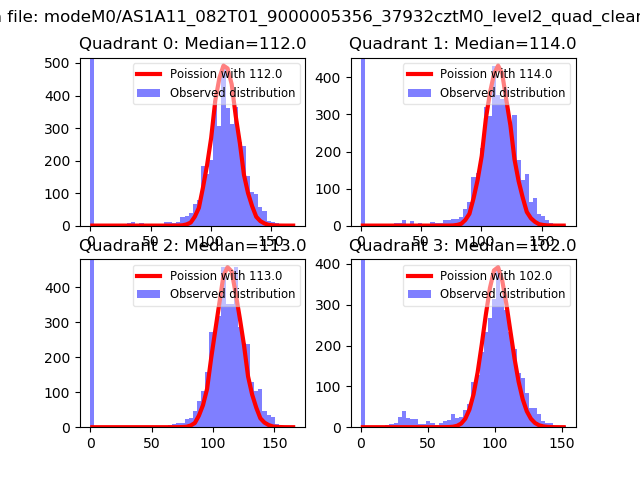 |
 |
| Quadrant-wise count rates Data is divided into 100 sec bins |
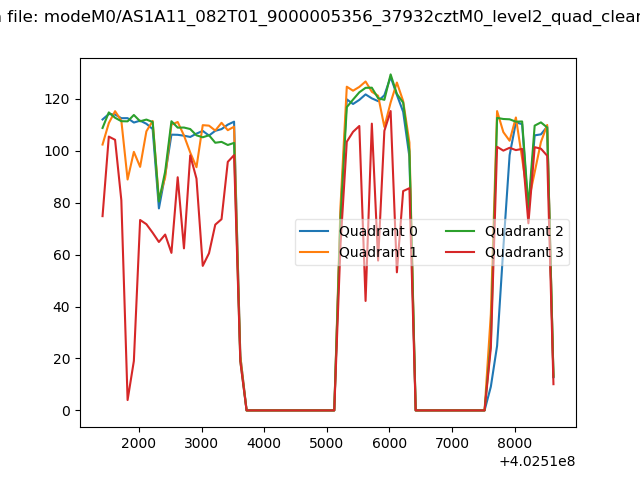 |
|
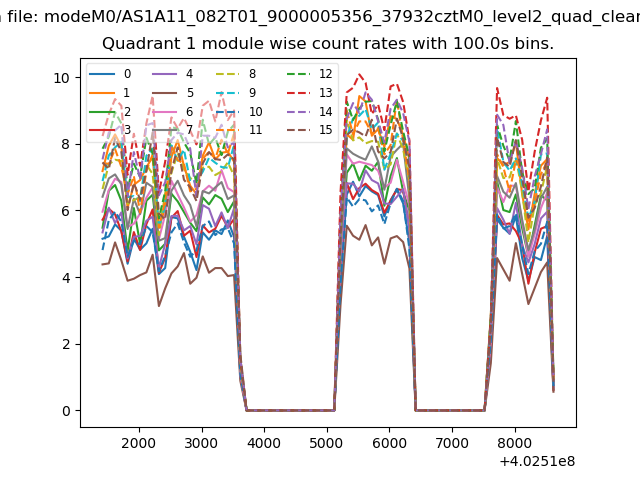
| Module-wise count rates for Quadrant A Data is divided into 100 sec bins |
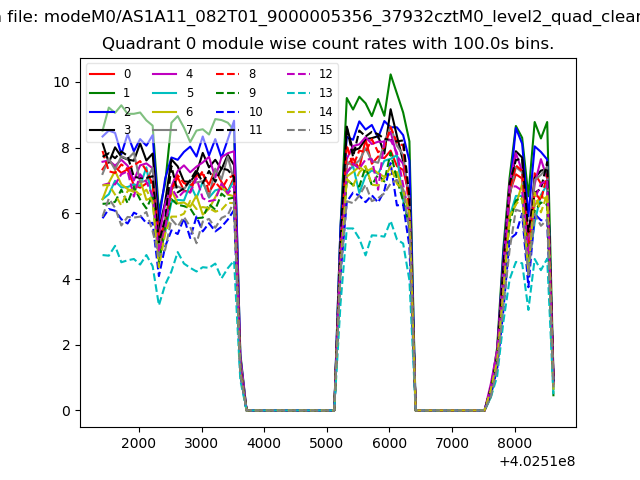 |
 |
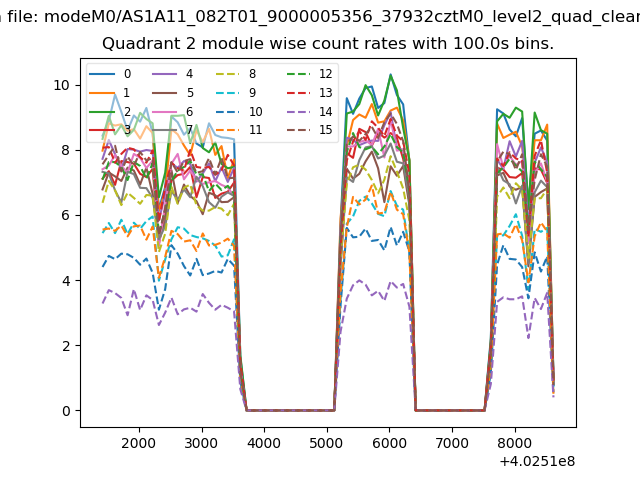
| Module-wise count rates for Quadrant B Data is divided into 100 sec bins |
 |
 |
| Module-wise count rates for Quadrant C Data is divided into 100 sec bins |
 |
 |
| Module-wise count rates for Quadrant D Data is divided into 100 sec bins |
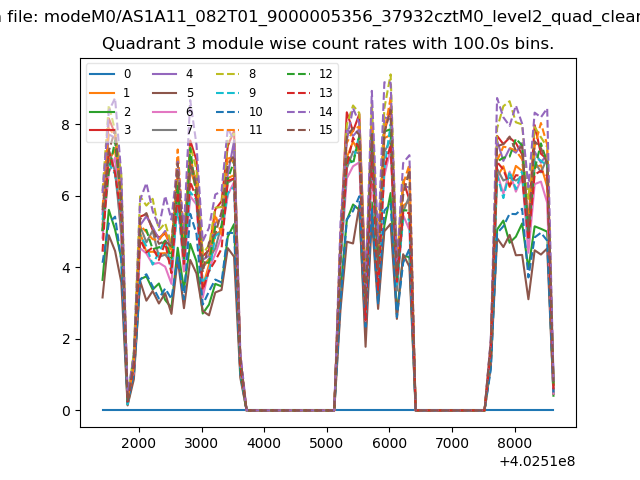 |
 |
| Parameter | Plot |
|---|---|
| CZT HV Monitor |  |
| D_VDD | 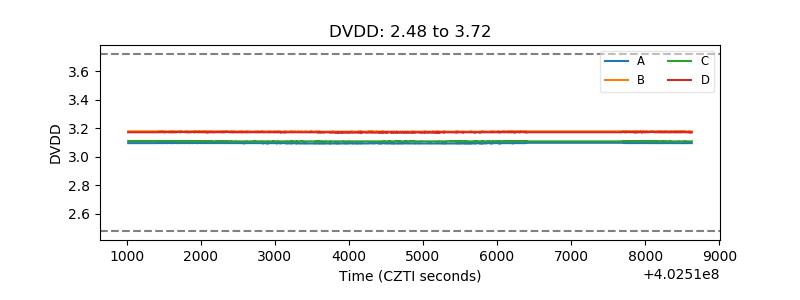 |
| Temperature 1 | 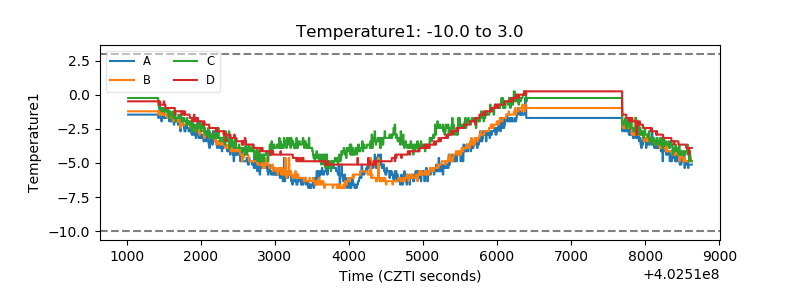 |
| Veto HV Monitor | 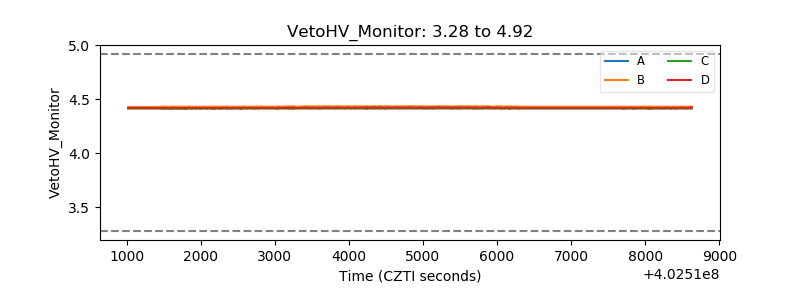 |
| Veto LLD | 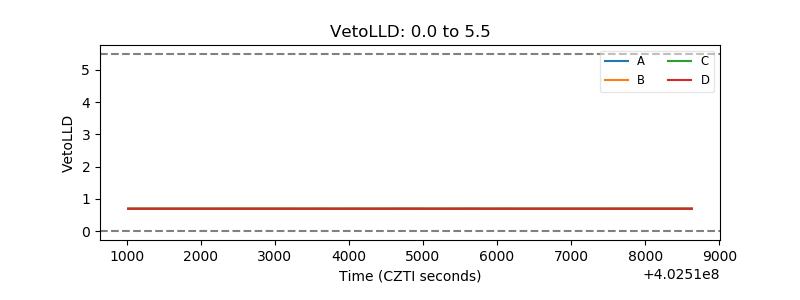 |
| Alpha Counter | 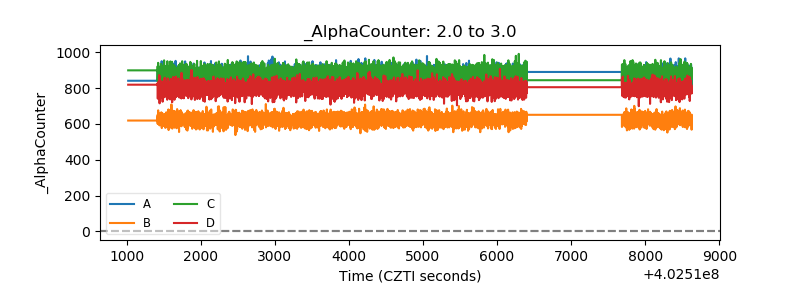 |
| _CPM_Rate | 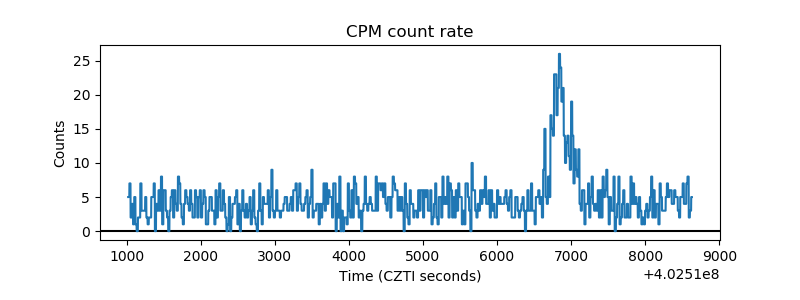 |
| CZT Counter | 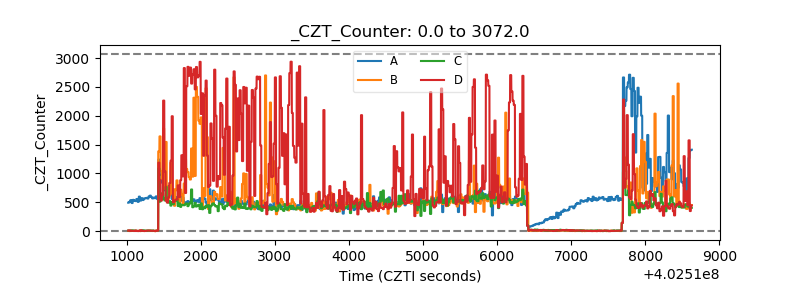 |
| +2.5 Volts monitor | 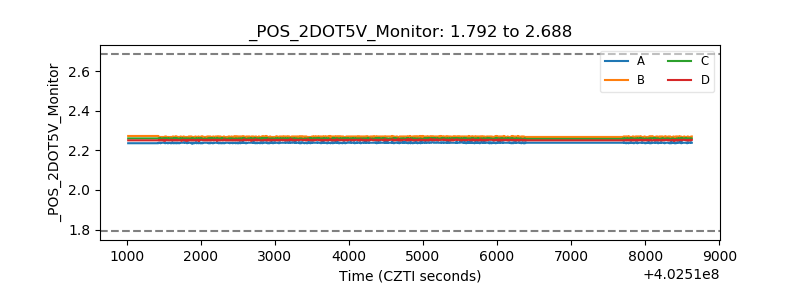 |
| +5 Volts monitor | 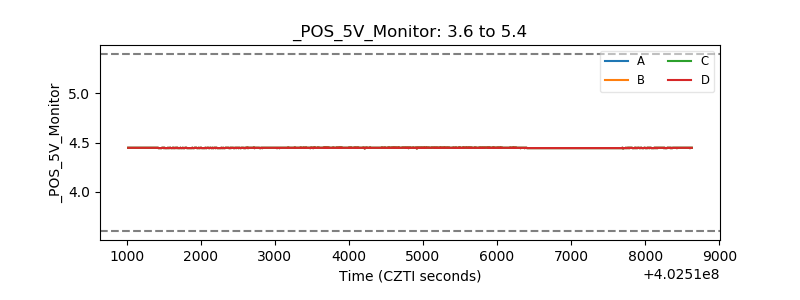 |
| _ROLL_ROT | 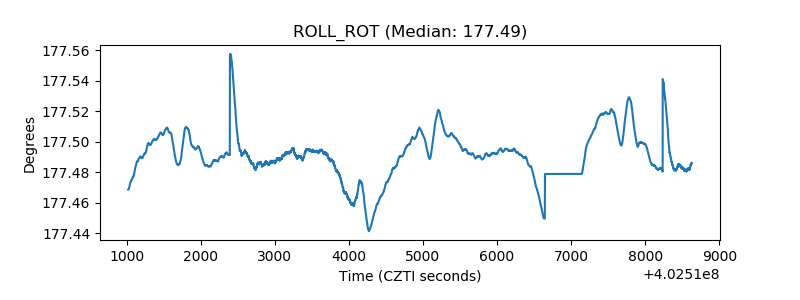 |
| _Roll_DEC | 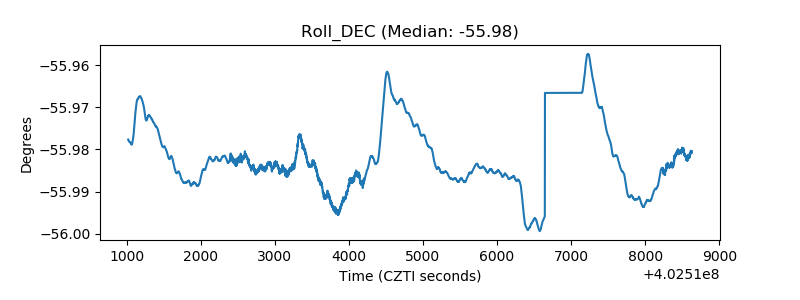 |
| _Roll_RA | 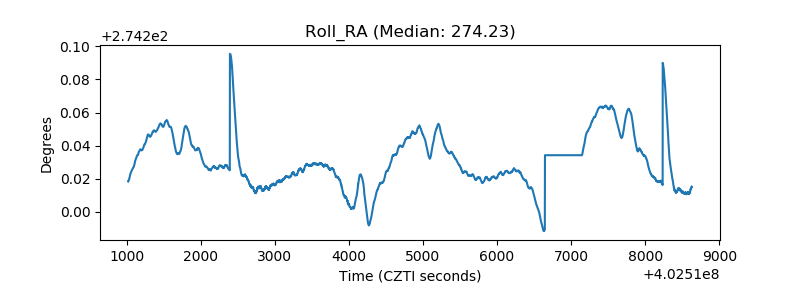 |
| Veto Counter | 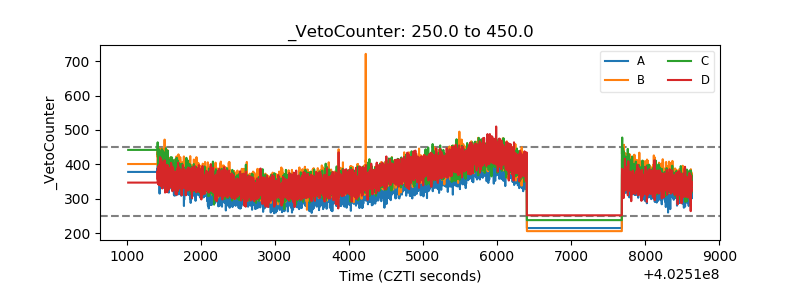 |